Remediation Operations on Alerts
Last updated - 09 July, 2026
On the Alerts page, you can view alerts for the resources that have RemediationSource applied to them. To remediate an issue, you can either manually run a RemediationSource or an active alert can trigger automated running of a RemediationSource.
On the Alerts page, you can select an alert and manually run a RemediationSource for the affected resource.
An alert can be generated based on a resource, resource group, resource property filters, LogicModule, instance, or datapoint. When an active alert matching the values specified in the Action rule is triggered, the RemediationSource specified in the Action rule runs automatically as per the stage defined in the Action Chain. You can run a maximum of 20 automated RemediationSources in a minute.
When an alert is generated, only the first five matching action rules are evaluated. The evaluation is based on the update order, and the most recently updated rule is run first.
For RemediationSources run manually or automatically, you can view the output result and history of the remediation action performed on the resource.
When manually running RemediationSources, if the daily execution quota is exhausted, a message indicating the quota limit displays on the UI. In case of automated running of RemediationSources, a log entry is added to the Audit logs. For more information, see Audit Logs.
Note: Manual and automated running of RemediationSources is currently not supported for website alerts, service alerts, cluster alerts, and alerts for resources managed by cloud Collectors.
LogicMonitor handles manually run RemediationSources on the Alerts page and the Resources page separately. When a RemediationSource is triggered on the Resources page, its output and run history display only on the Resources page and not on the Alerts page. However, when a RemediationSource is triggered on the Alerts page, its output and run history display both on the Alerts page and Resources page for the same resource.
Requirements for Running RemediationSource on Alerts
To run RemediationSources on Alerts, you need the following:
- Toggle the Enable Running Remediation Sources switch on the Security page.
For more information, see Security Settings. - A LogicMonitor user with resource permissions for “Remediation: Execute” settings for the resource group.
For more information, see Resources Role Permissions. - A LogicMonitor user with “Manage” permission for all installed modules in My Module Toolbox.
- Install EA Collector 39.500 or later on your machine.
For more information, see Adding Collector. - Sufficient daily contracted executions quota.
- Manually created RemediationSource or out-of-the-box RemediationSource modules imported in My Module Toolbox and applied to the resources.
For more information, see RemediationSource Configuration.
In addition, for automated running of RemediationSources, you need the following:
- Action rule and Action chain configured with RemediationSource specified in it.
- Action rule enabled for use in My Module Toolbox.
- An active alert, that is, an alert generated for less than 24 hours (after 24 hours, the alert cannot trigger automated RemediationSource).
Viewing Automated Run Result of RemediationSource on Alerts
- In LogicMonitor, navigate to Alerts.
- In the Search field, enter a value for alert where the resource has RemediationSource applied.
LogicMonitor attempts to match values as you type. - Select the alert and then select the Remediations tab.
A list of the latest executions of each RemediationSource run for the past 30 days displays. - Select a record.
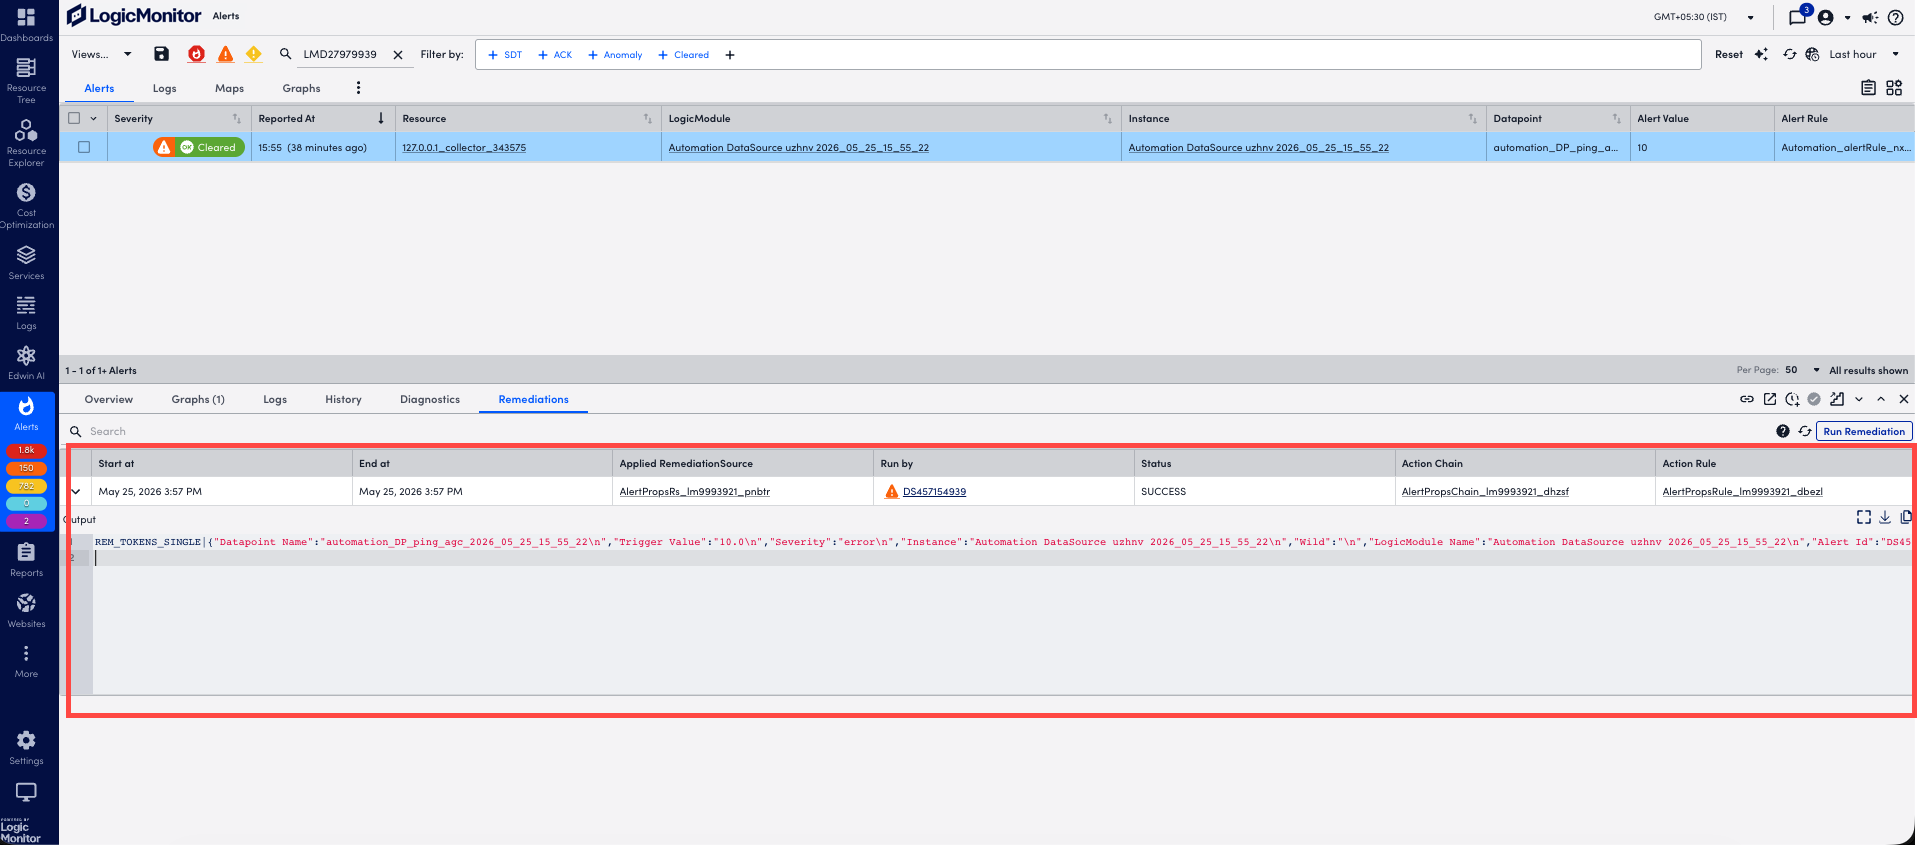
You can view the following details:- Date and time when the RemediationSource run started and ended
- Name of the applied RemediationSource
- Alert ID that triggered automated run of RemediationSource
- Recent run status
- Name of the Action rule and Action chain
- Output details
- Option to view output in fullscreen mode, download, and copy the output
- You can select
 Refresh to view the latest run output.
Manually Running RemediationSource on Alerts
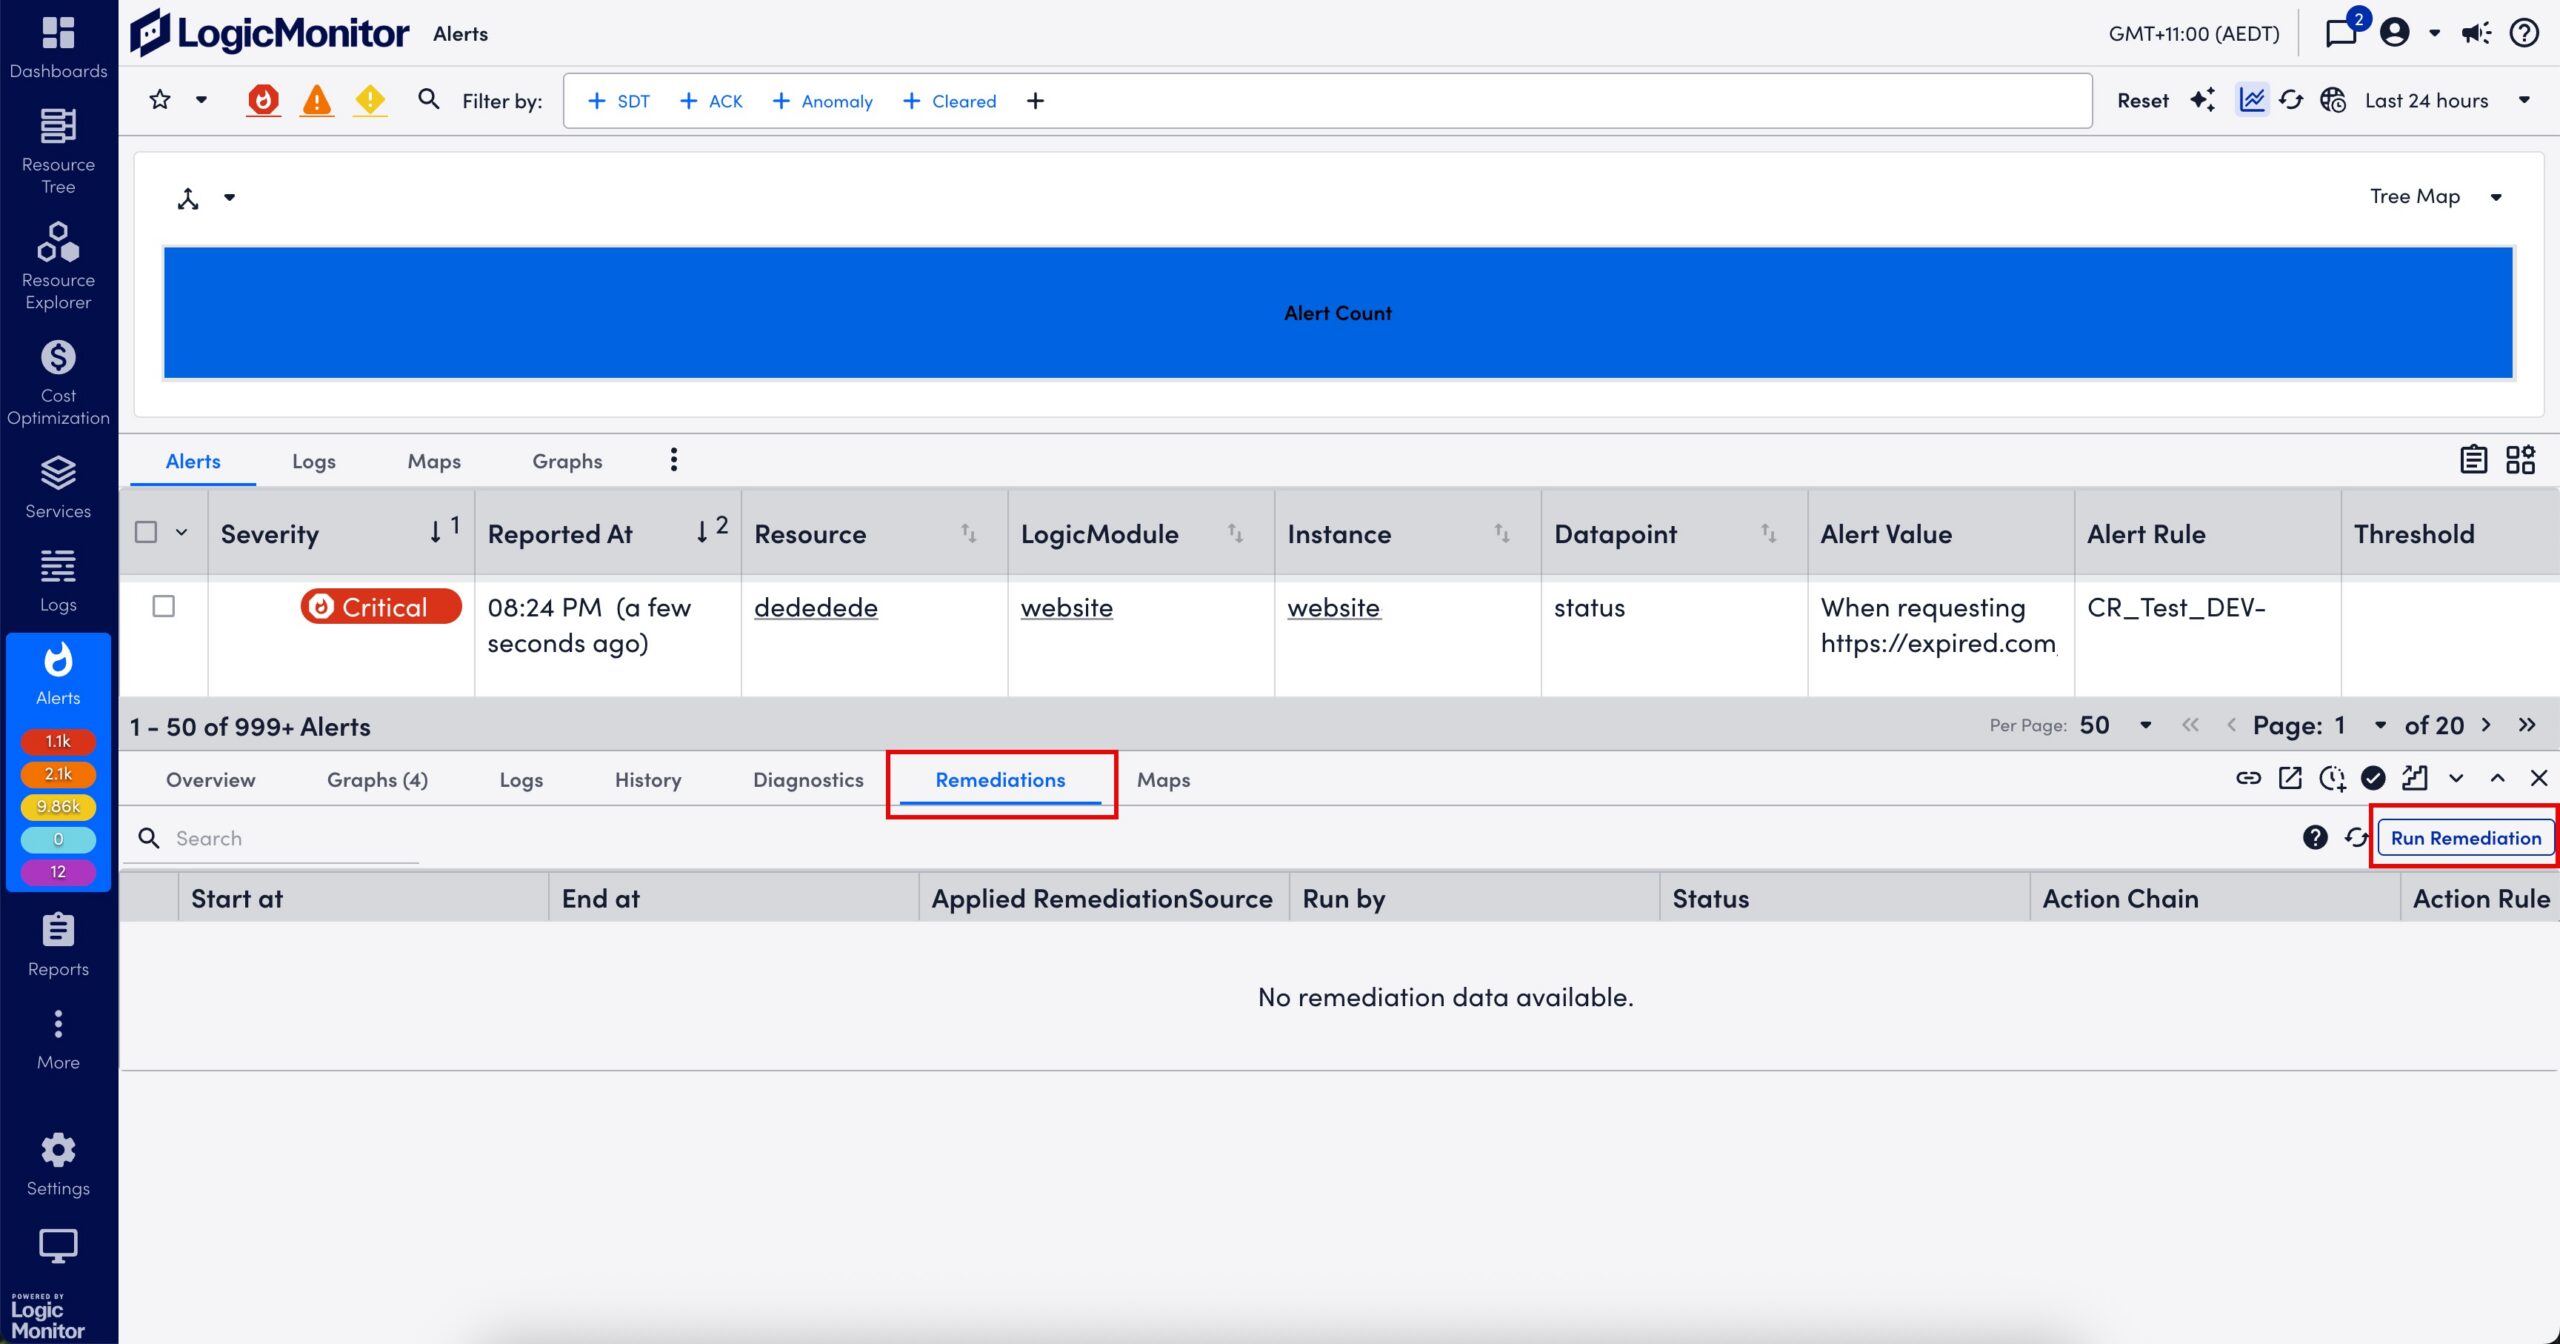
- In LogicMonitor, navigate to Alerts.
- In the Search field, enter a value for alert where the resource has RemediationSource applied.
LogicMonitor attempts to match values as you type. - Select the alert and then select the Remediations tab.
A list of the latest executions of each RemediationSource run for the past 30 days displays. - Select Run Remediation.
On a new page, a table with a list of all the RemediationSources applied to the resource displays. - In the Actions column, select
 Run for the RemediationSource that you want to run.
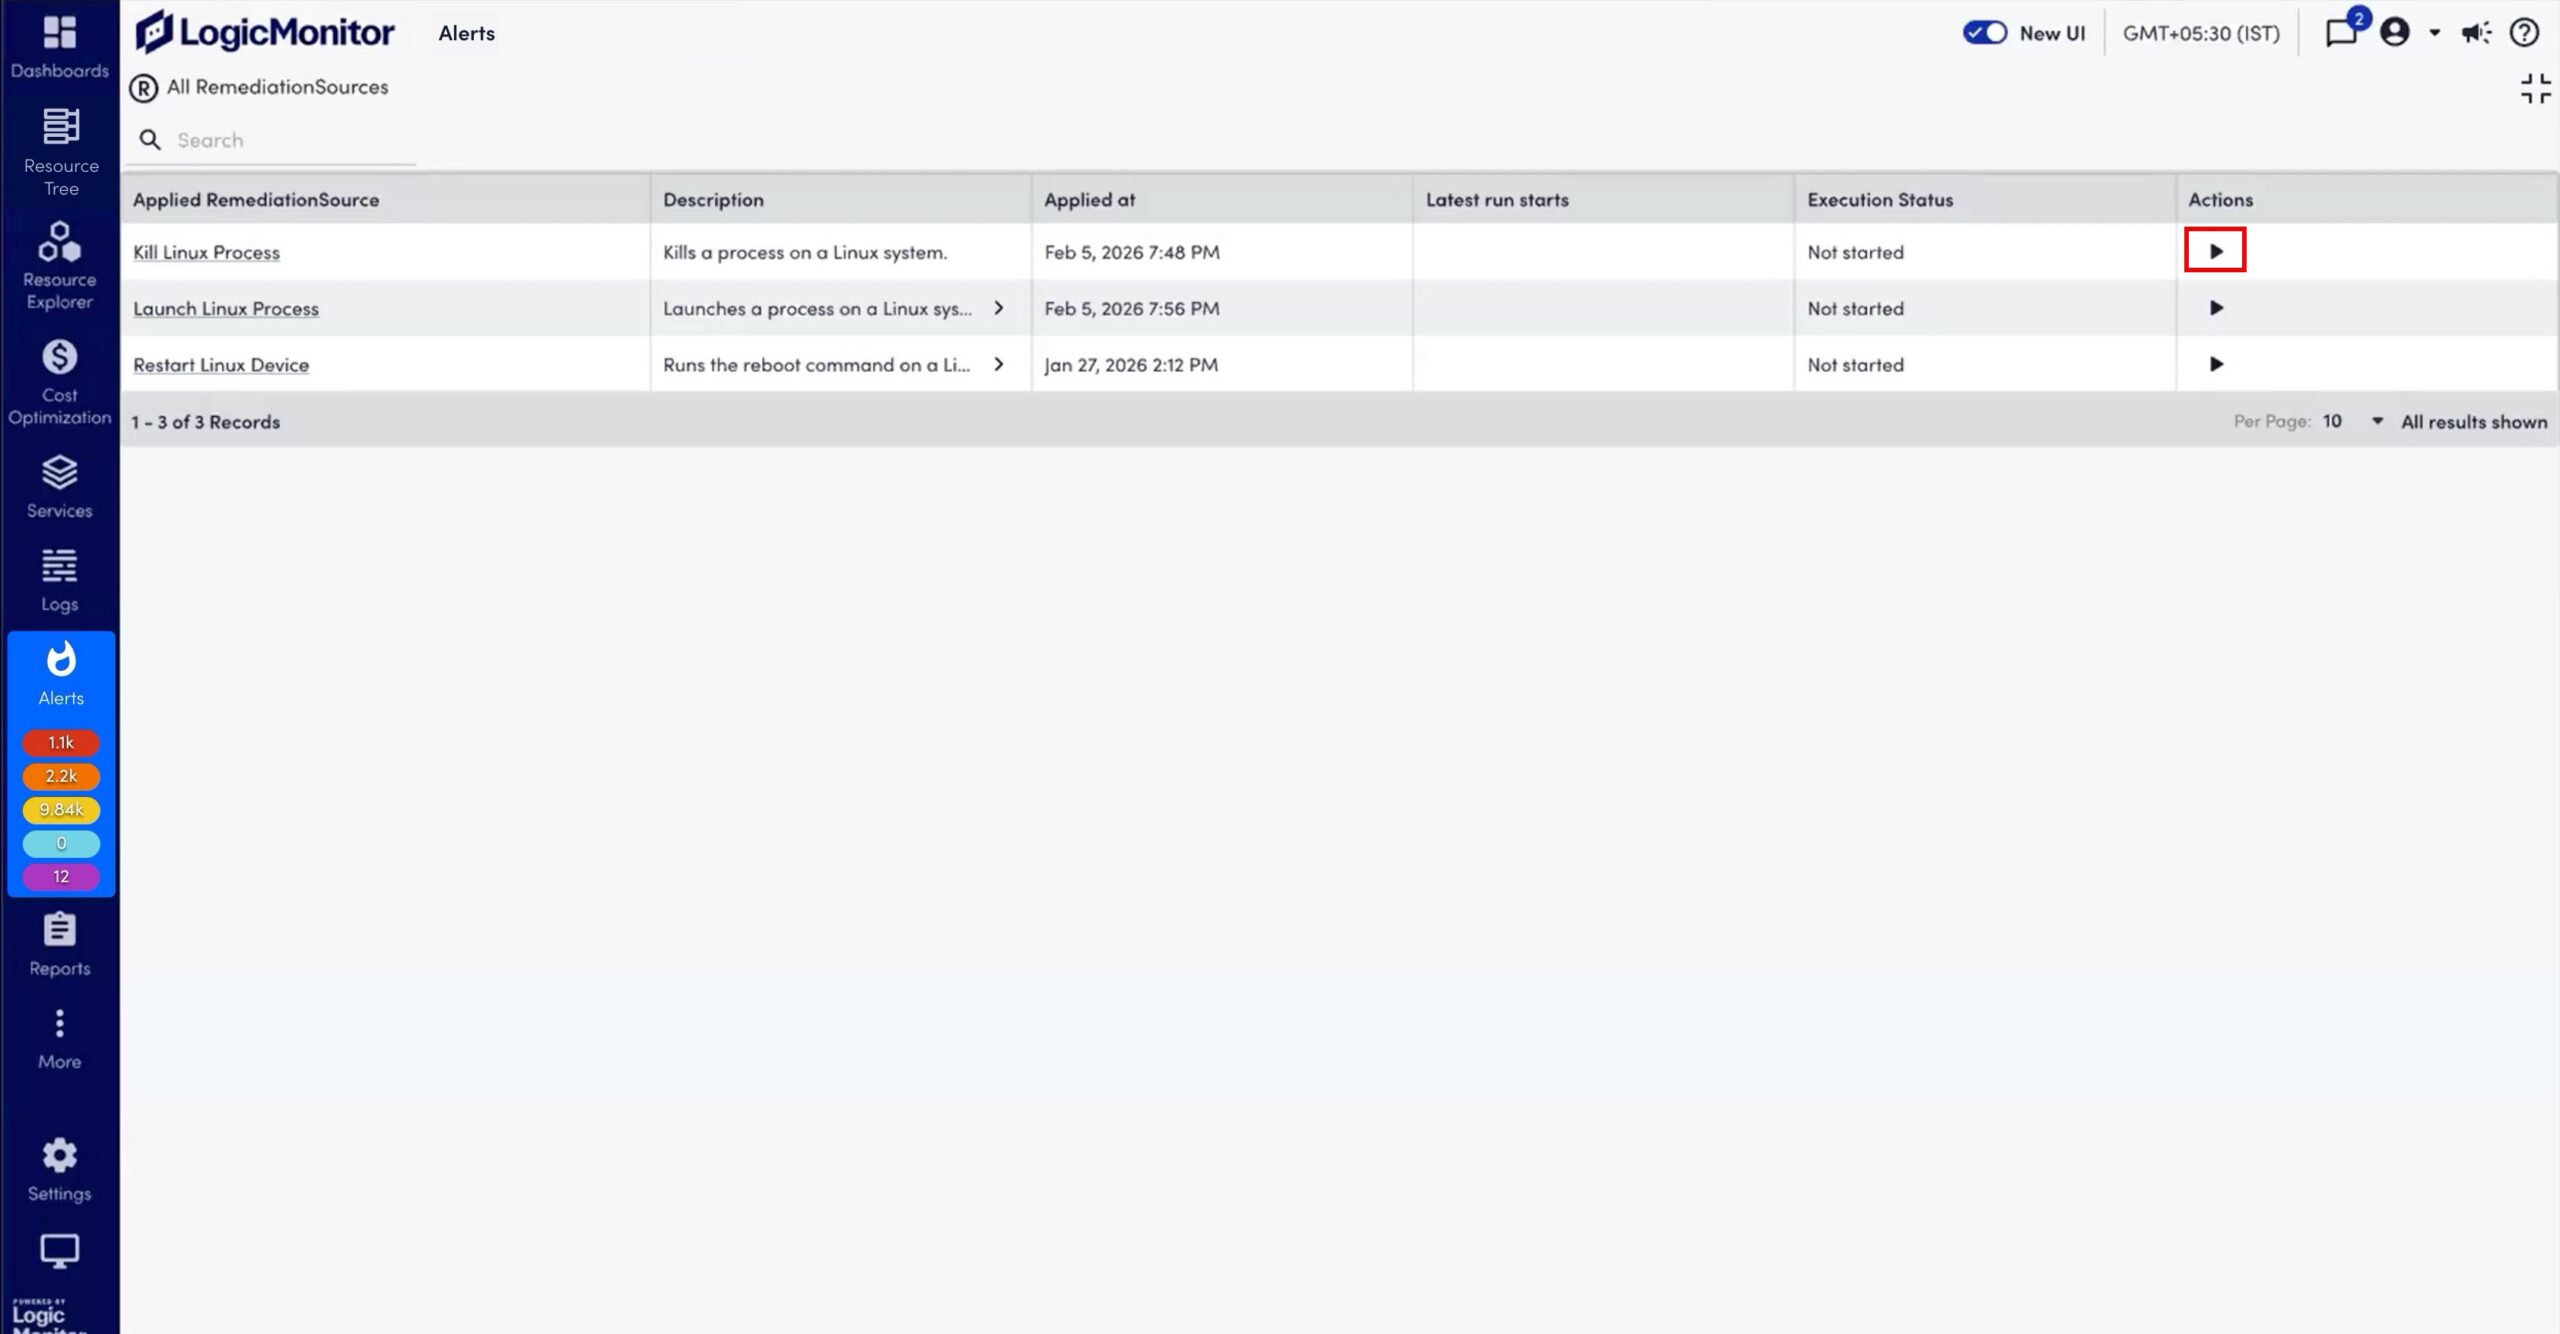
The system runs the RemediationSource and updates the execution status as In Progress.
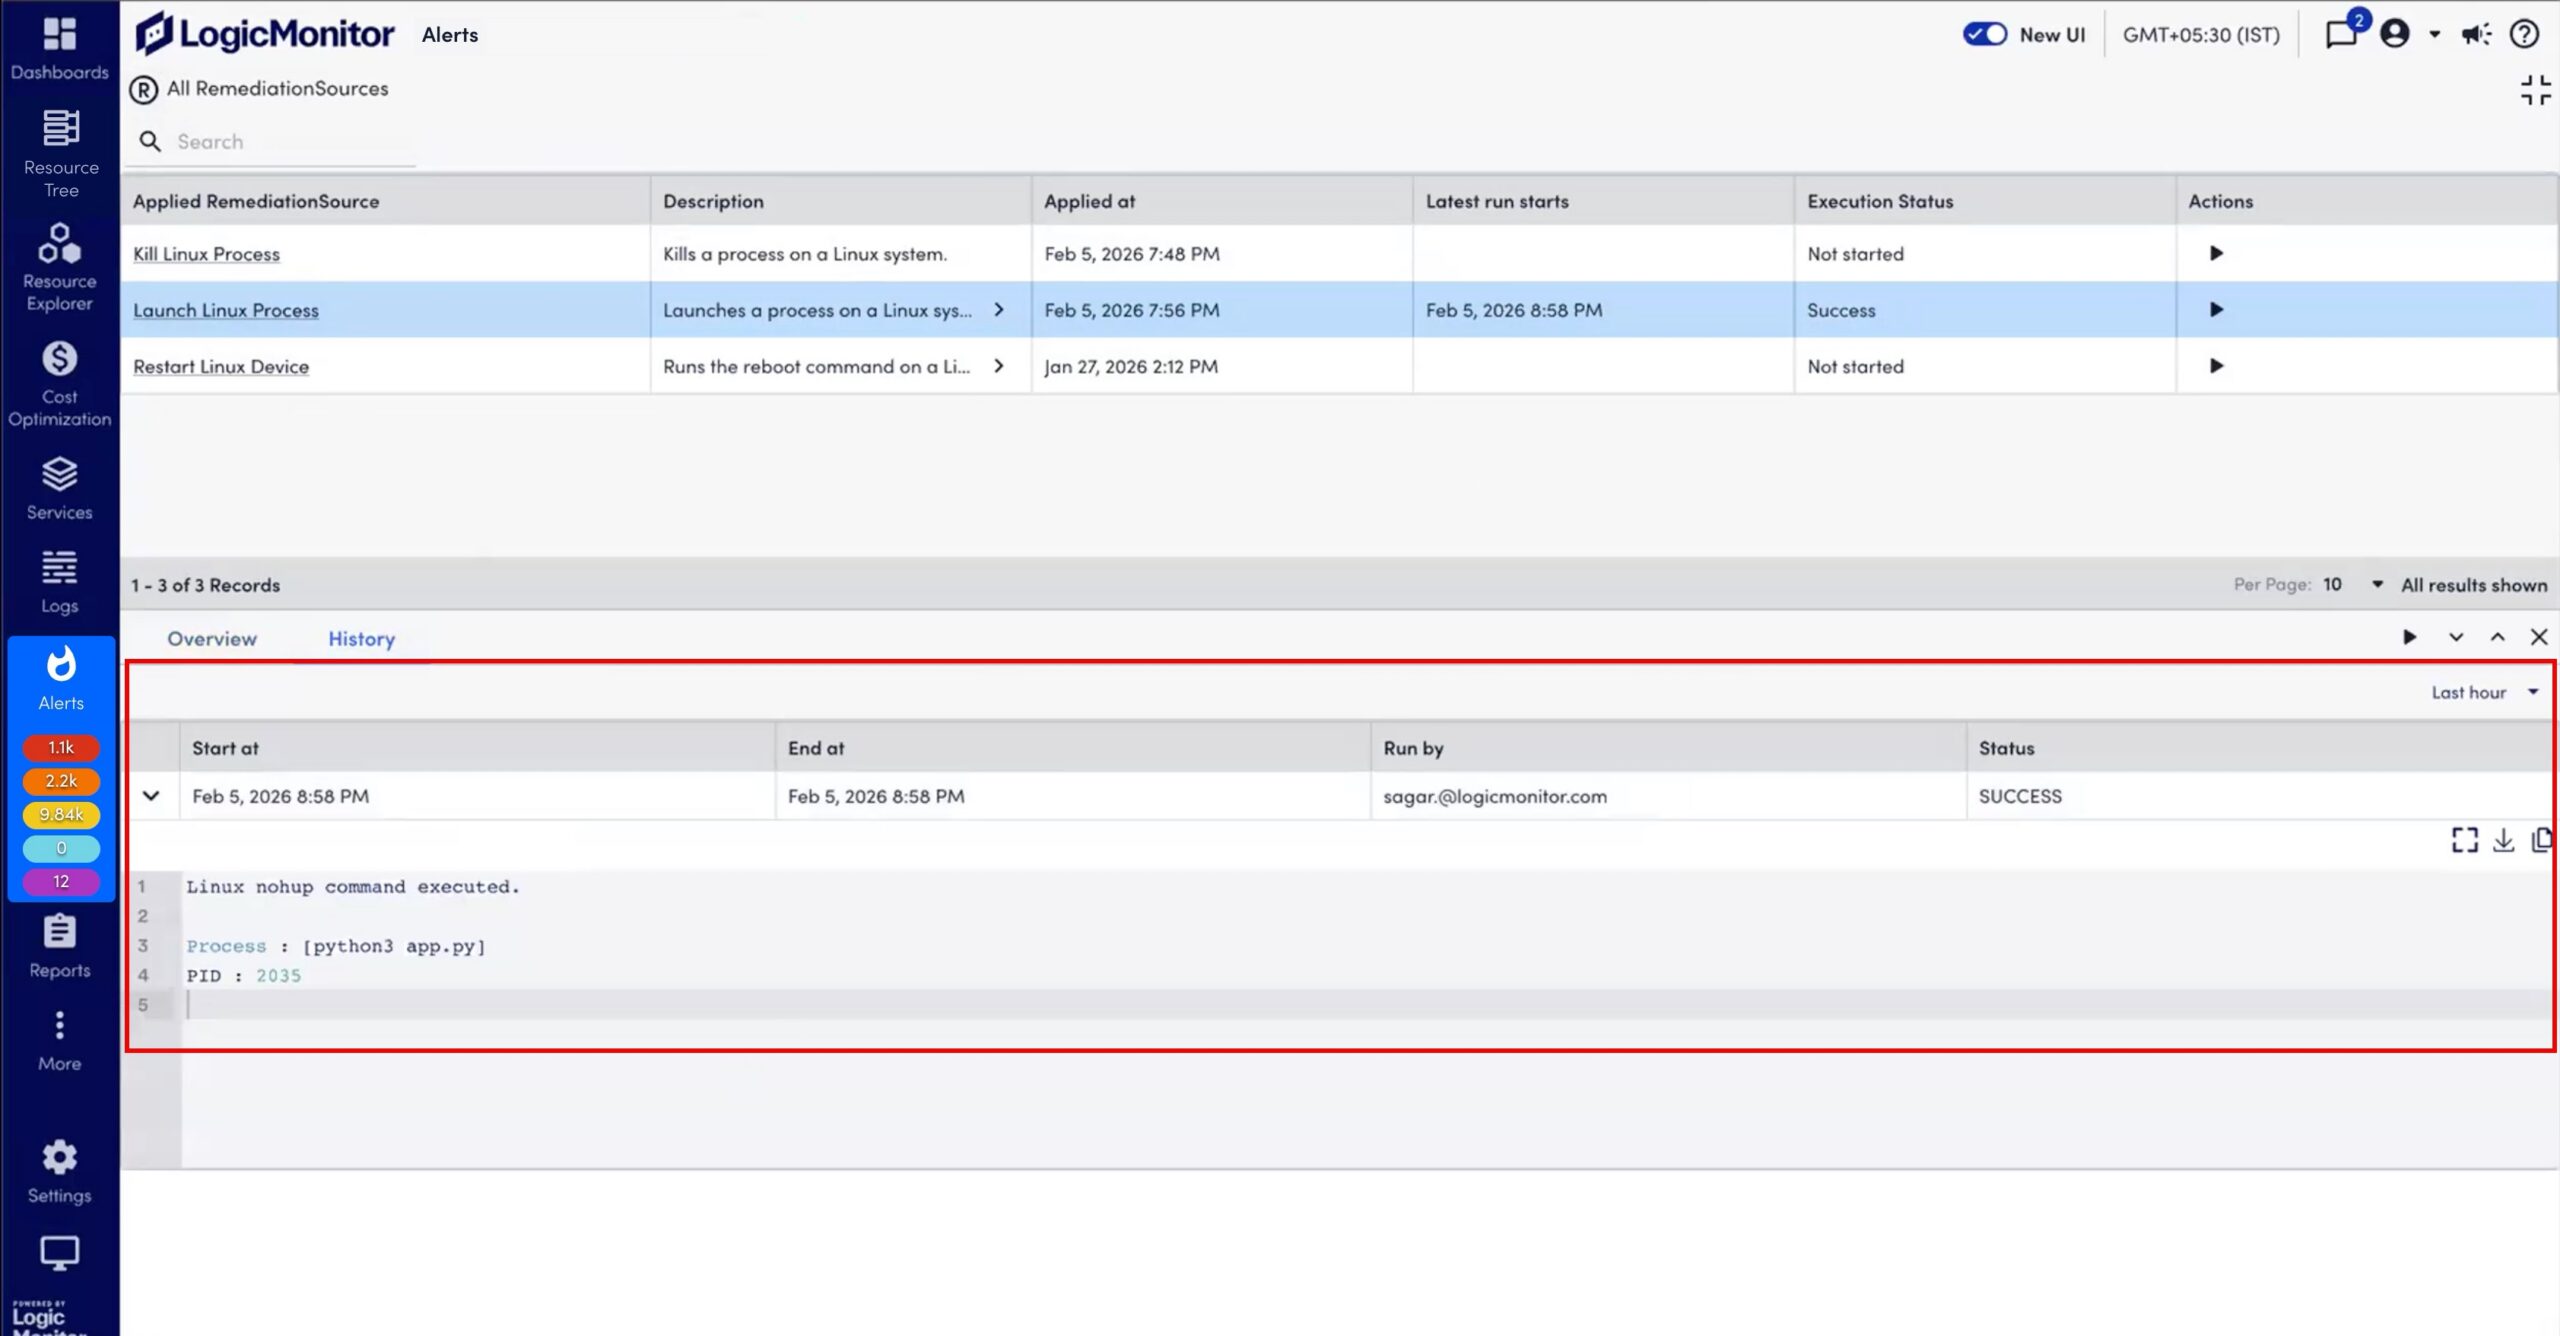
When the process is complete, you can view the latest output in the Overview tab.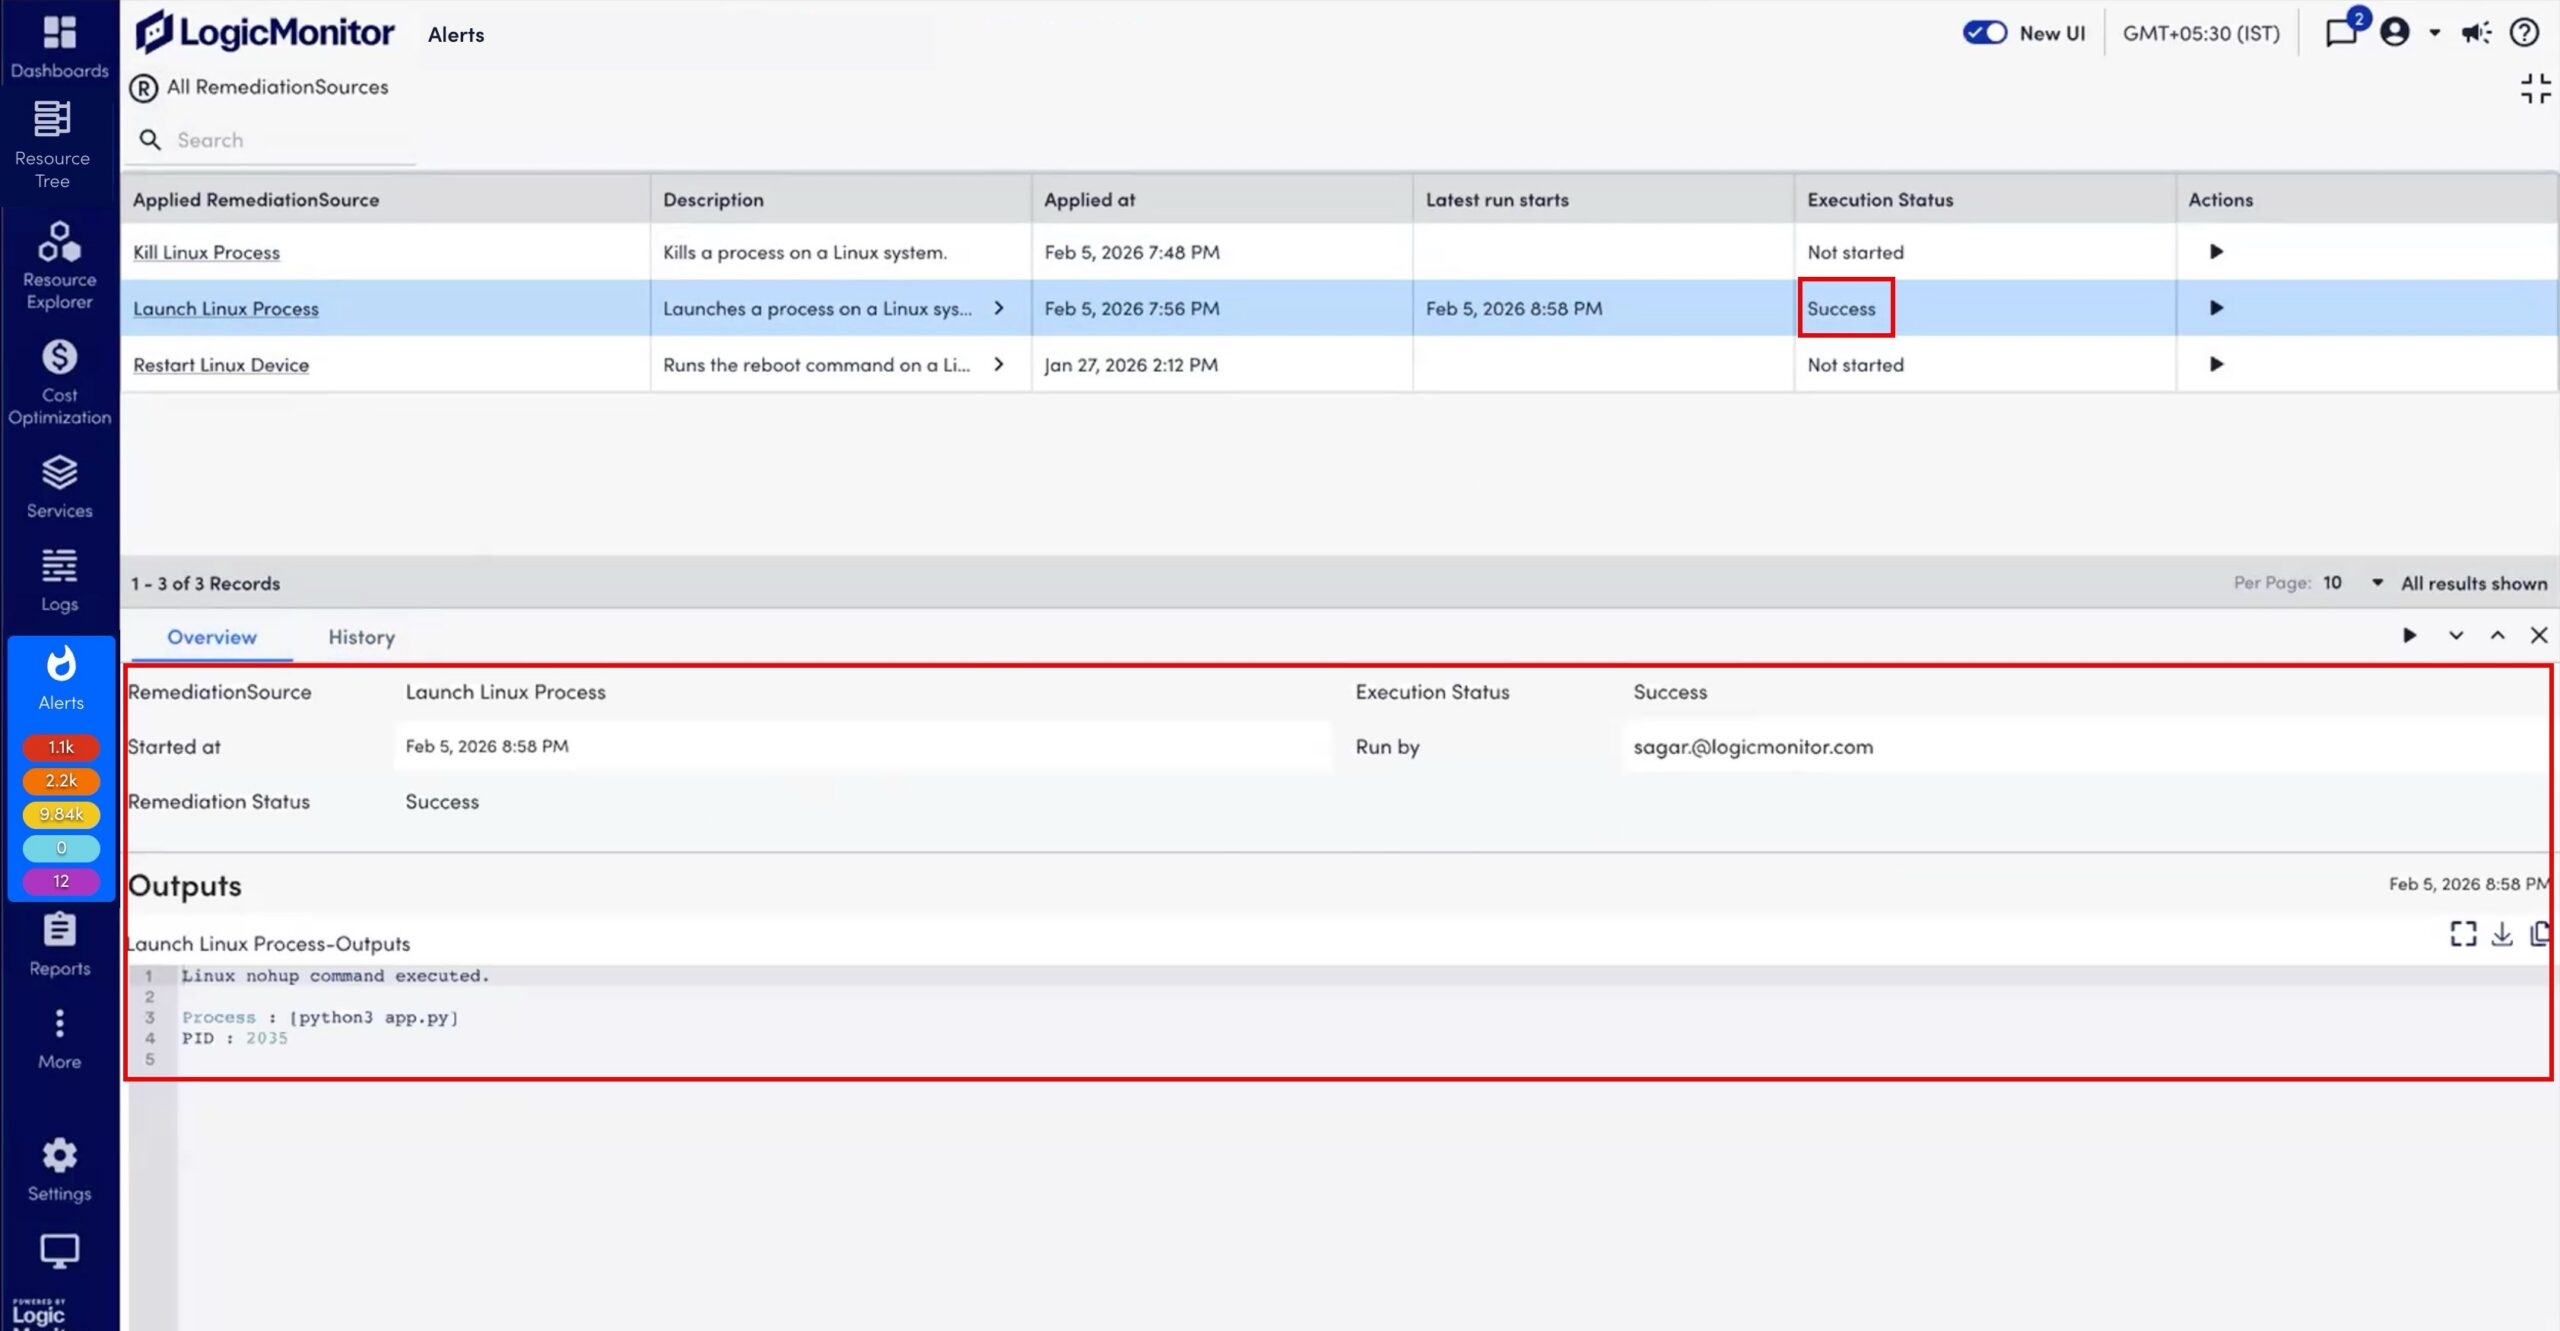
By default, the Overview tab displays the following details:- Name of the RemediationSource
- Recent execution status
- Date and time when the RemediationSource run started and ended
- Username of the user who triggered the running of RemediationSource
- Output details
- Option to view output in fullscreen mode, download, and copy the output
- Select the History tab.
- (Optional) Select a time range.
- Select a record to view the run history for the resource.