
AWS Billing Monitoring Setup
Last updated - 25 April, 2023
You can use LogicMonitor to monitor AWS billing data for your AWS account using AWS Cost and Usage Reports. LogicMonitor can automatically monitor the cost of any line item in your Cost and Usage Report. The following table displays the DataSources automatically available to you and what information they monitor from your Cost and Usage Report:
| DataSource | Monitors Cost By |
| Cost by Account (AWS_Billing_CostByAccount) | Account IDs |
| Cost by Region (AWS_Billing_CostByRegion) | Region |
| Cost by Service (AWS_Billing_CostByService) | AWS Products |
| Cost by Operation (AWS_Billing_CostByOperation) | Operations |
| Cost by Tag (AWS_Billing_CostByTag) | Cost allocation tags |
Note: The Cost by Tag DataSource is a multi-instance DataSource that supports Active Discovery (AD) that you can use to collect values for tagged items in your AWS Cost and Usage Report. For more information, see AWS Cost by Tag Monitoring.
Setting up monitoring for AWS billing involves inputting values from AWS into LogicMonitor so that LogicMonitor can access your AWS Cost and Usage Report.
Requirements for Monitoring AWS Billing
To set up monitoring for AWS billing, you need the following values from your AWS account:
- Name of your Amazon S3 bucket
To obtain the name of your S3 bucket, you must set up an Amazon S3 bucket for your Cost and Usage Report.
For more information, see AWS’s Setting up an Amazon S3 bucket for cost and usage reports documentation. - Report path prefix of your cost and usage report
To obtain the report path prefix, you must create a Cost and Usage Report that is enabled to integrate with Amazon Redshift.
For more information, see AWS’s Creating Cost and Usage Reports documentation.
Note: The report path prefix must point to a single Cost and Usage Report only, not multiple related reports. This ensures that LogicMonitor gets billing data related only to your monitored resources.
To monitor cost using cost allocation tags, you must enable the tags as cost allocation tags in AWS to include them in your Cost and Usage Report. For more information, see AWS’s Using AWS cost allocation tags documentation.
If your environment does not include the DataSources to monitor the line items in your AWS Cost and Usage Report, you must import these DataSources. For more information about importing DataSources, see LogicModule Updates.
Setting up Monitoring for AWS Billing
- Navigate to Resources, and select the AWS account you want to set up billing monitoring for.
If you are setting up monitoring for AWS billing for a fresh AWS account, see AWS Monitoring Setup for more information on navigating to the Billing step in the wizard when adding your AWS account to LogicMonitor. - Select Manage Properties.
- Select the Billing tab and do the following:
- In the S3 Bucket Name field, enter the name of the S3 bucket that you set up for your Cost and Usage Report.
- In the Report Path Prefix field, enter the report path prefix of your folder that contains your Cost and Usage Report.
For more information about how to find the report path prefix, see AWS’s Viewing your report documentation.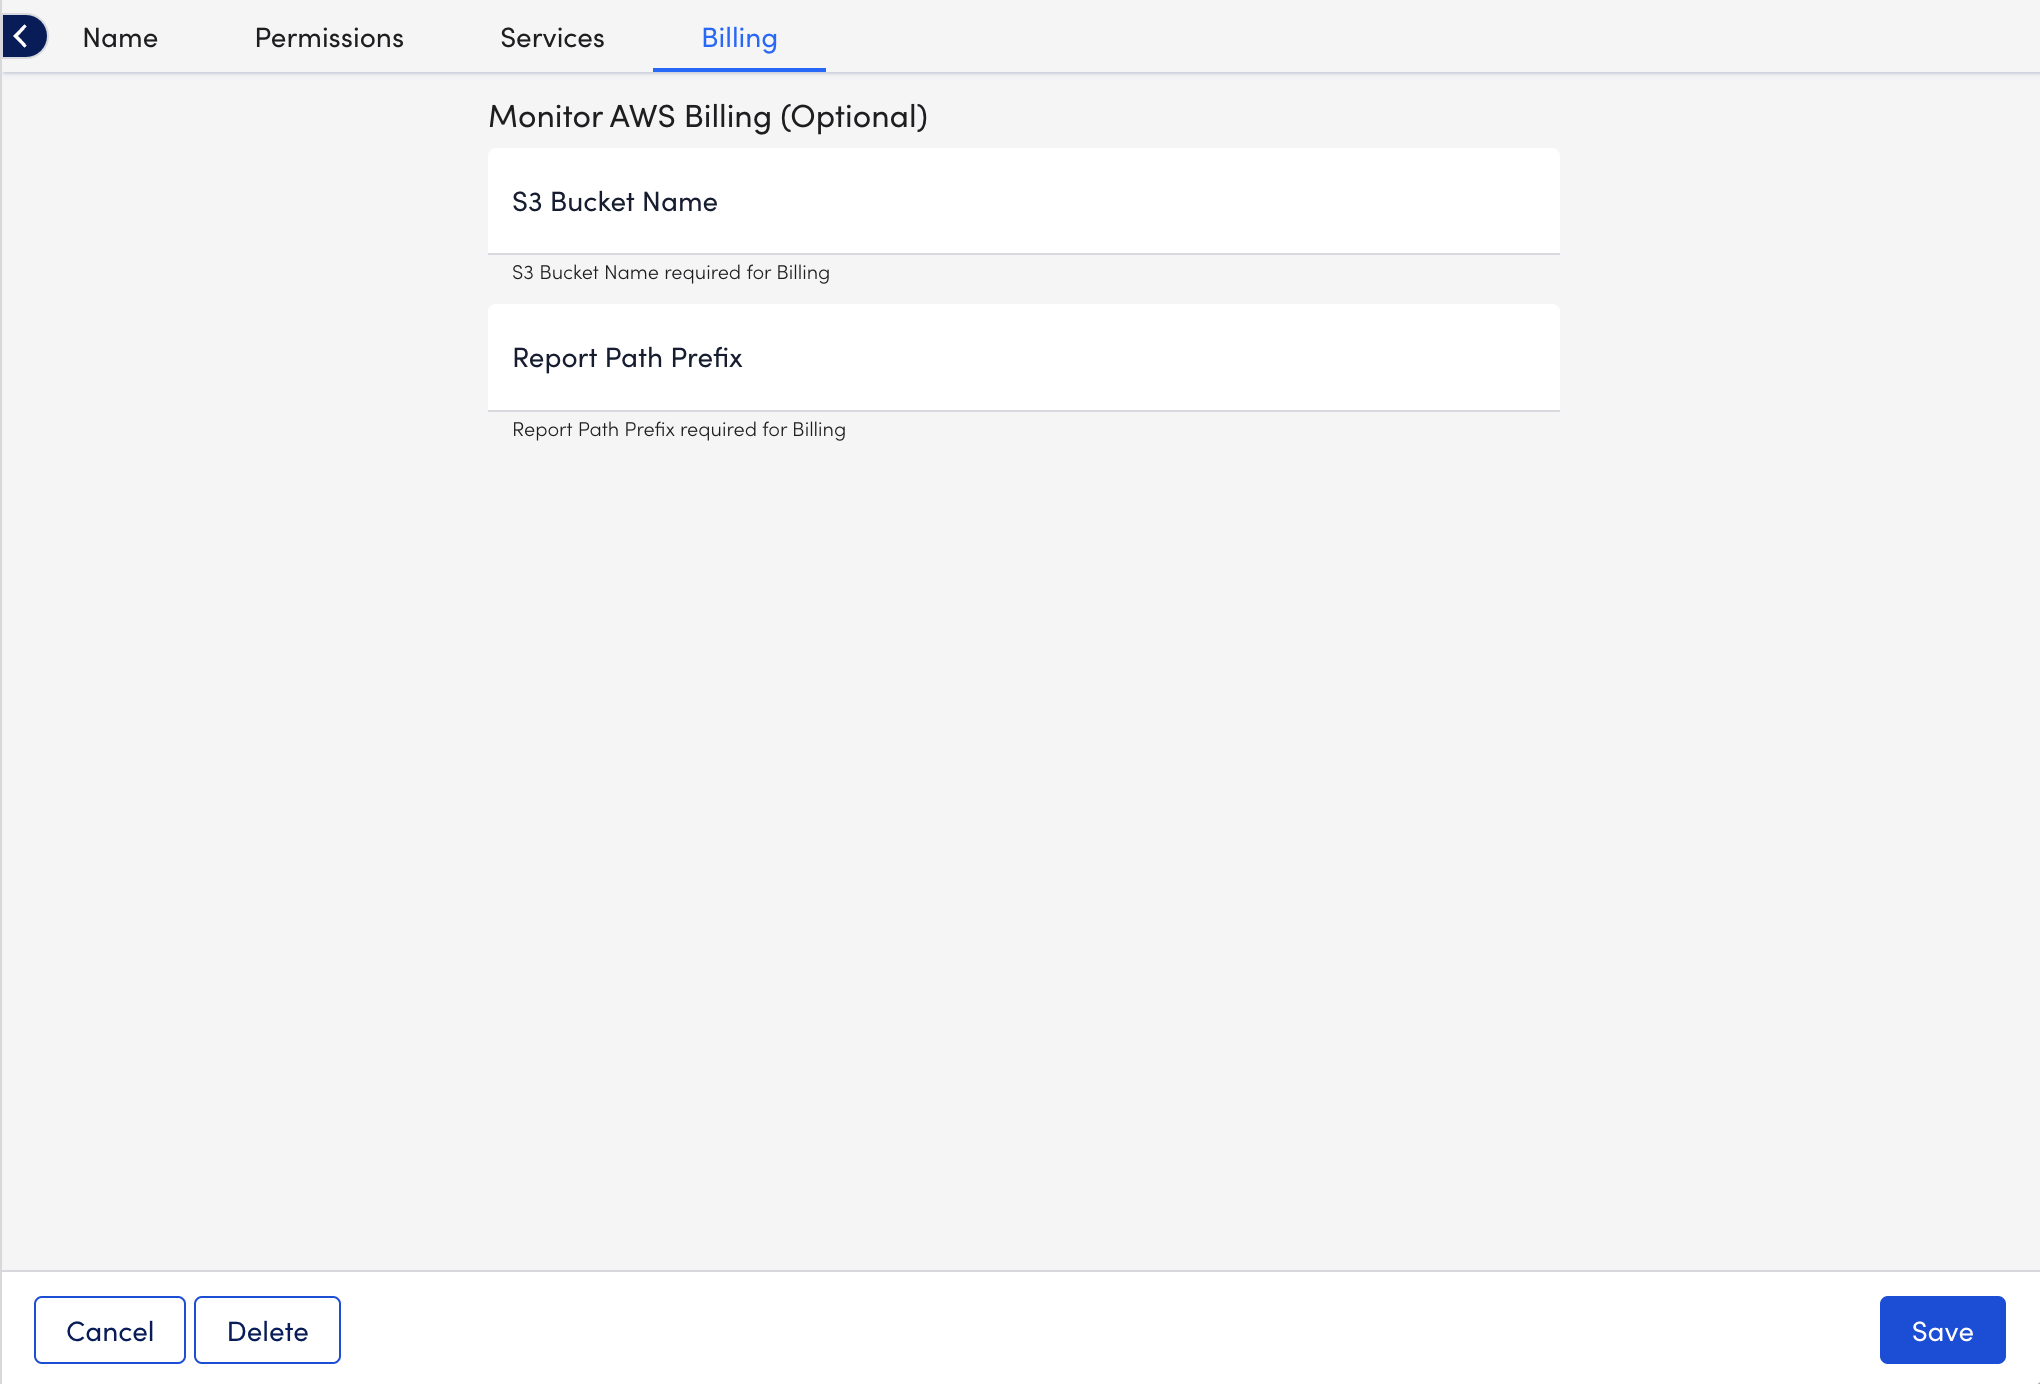
- Select Verify Billing Information when entering billing details to confirm your details are configured correctly. An alert message displays If the cost data region of your AWS environment differs from the LogicMonitor portal region during setup.

- Select Save.
If you select Add Billing and Finish when this alert is active, a new alert displays warning of potential extra costs. You must select Accept and finish to proceed, or Cancel and re-configure your AWS S3 bucket before completing setup. Navigate to your AWS console and create a new bucket in the appropriate region to match your LogicMonitor portal.

Additional Information
After you set up monitoring for AWS billing and LogicMonitor collects data, you can use dashboards to visualize the data. For more information, see Sharing and Exporting/Importing Dashboards.
In addition, you can use an AWS Billing JSON template available from LogicMonitor. For more information, see dashboards/AWS from LogicMonitor.
