Dynamic Service Insights
Service-Centric Monitoring for ITOps Teams
See IT the way your business runs: by services, along with devices. Prioritize what truly impacts customers and operations, and resolve issues with context.
Dynamic Service Insights
See IT the way your business runs: by services, along with devices. Prioritize what truly impacts customers and operations, and resolve issues with context.
WHY DYNAMIC SERVICE INSIGHTS
Help your teams cut through alert fatigue, align IT with business priorities and resolve issues faster by focusing on the services that matter.
See services the way your business operates. Keep IT decisions focused on outcomes that impact customers and revenue.
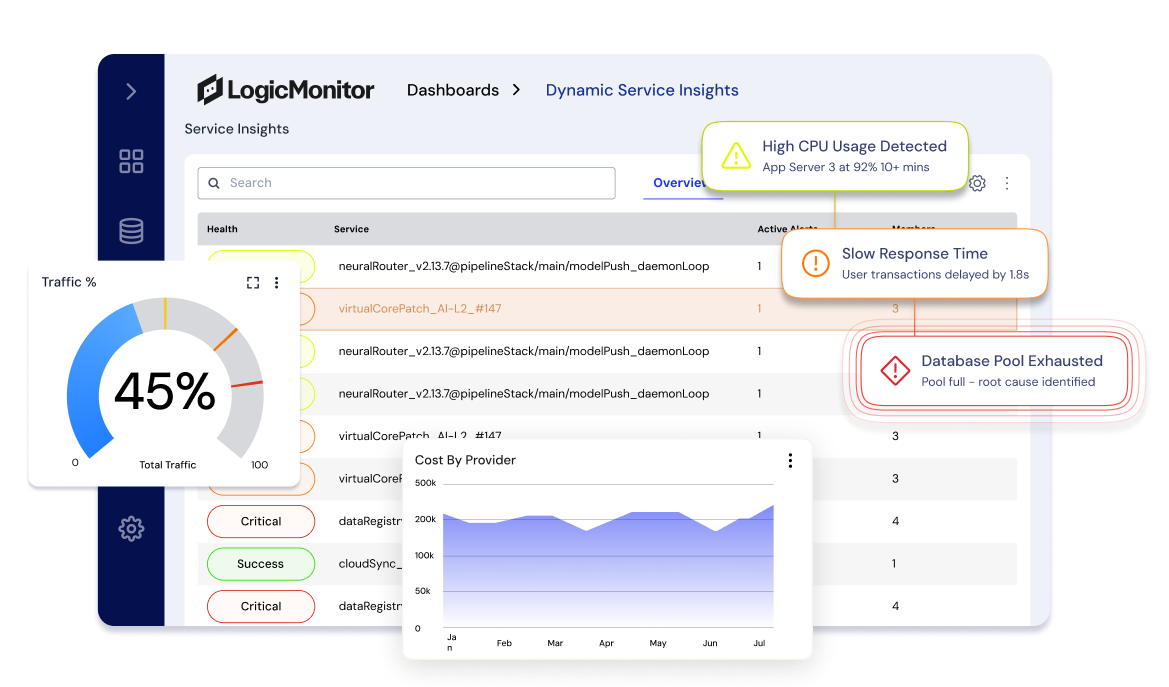
Surface only meaningful alerts tied to service health, so your teams can find and fix problems in minutes, not hours.
As your environment grows, service-level visibility grows with you without adding complexity for your teams
Catch problems before they escalate with adaptive health rules that adjust in real time, ensuring consistent uptime for your critical services.
Give SREs, app owners, and NOC teams a shared view of service status, so collaboration is faster and fixes happen without finger-pointing.
Spend less time firefighting and more time optimizing IT resources, reducing wasted effort and avoiding unnecessary spend.
What you can do with Dynamic Service Insights
Dynamic Service Insights brings structure and meaning to your monitoring data by letting you define, monitor, and troubleshoot based on how your business operates.
Use tag-based rules to automatically build and maintain logical service groupings that reflect how systems work together across locations, technologies, and cloud environments.
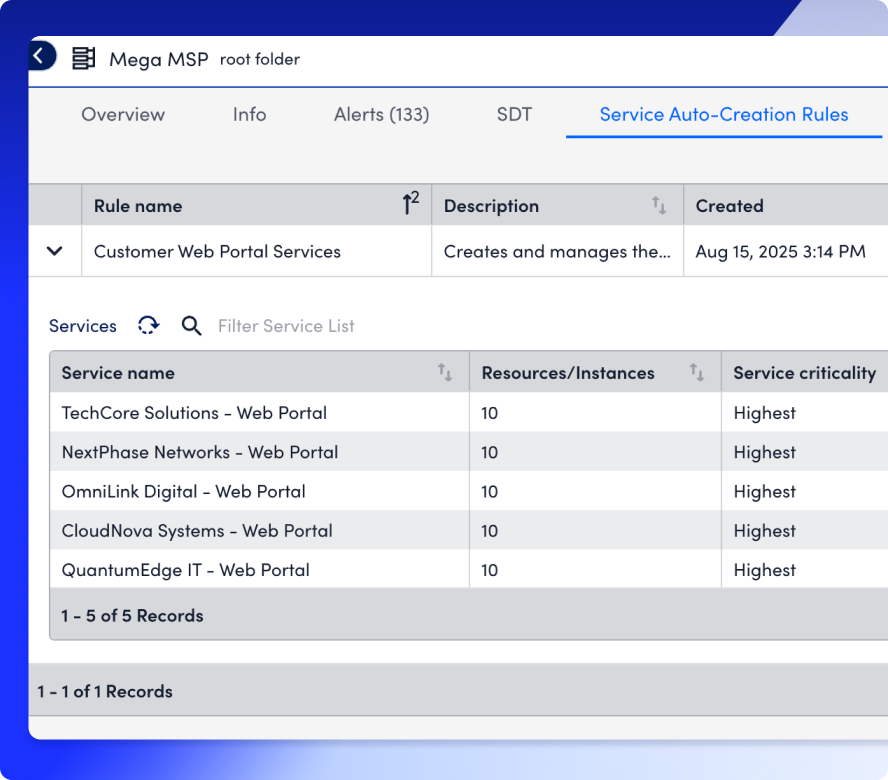
Define service health using key metrics from underlying systems. Assign a criticality level so that your most important systems drive overall status. LogicMonitor updates health in real time, no refresh needed.
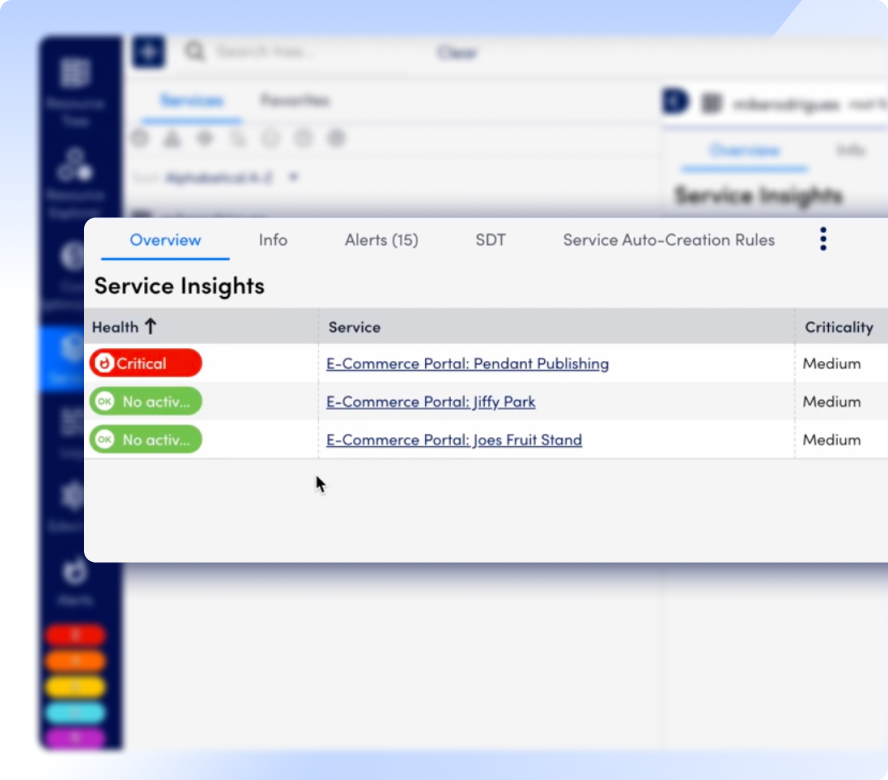
Dynamic Service Insights consolidates infrastructure alerts into a single service impact view, allowing teams to focus solely on impacts that affect business continuity. No more wading through floods of low-impact alerts.
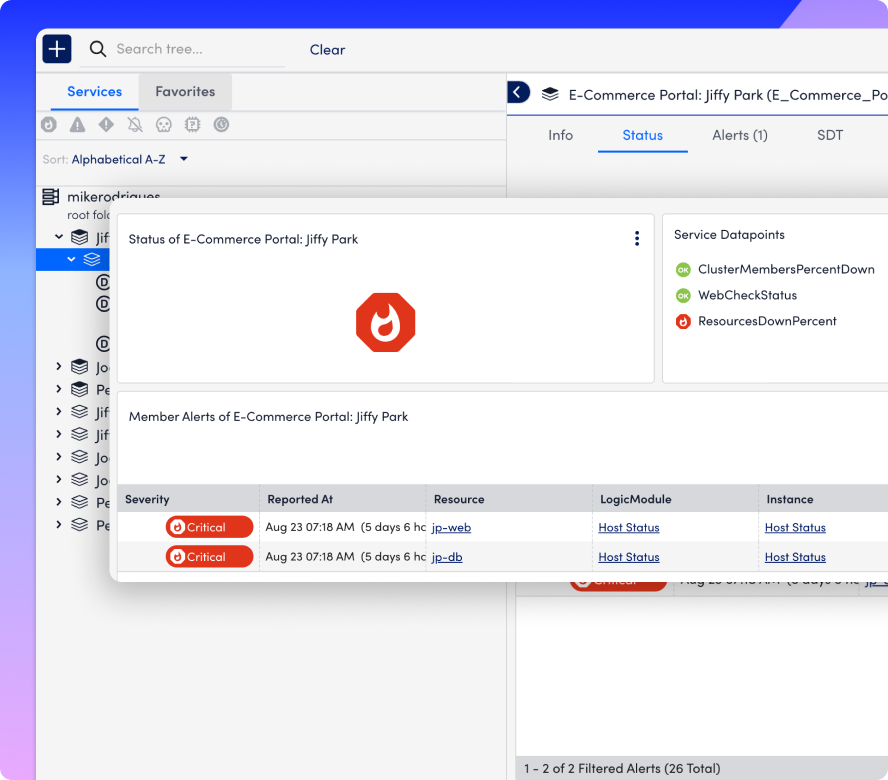
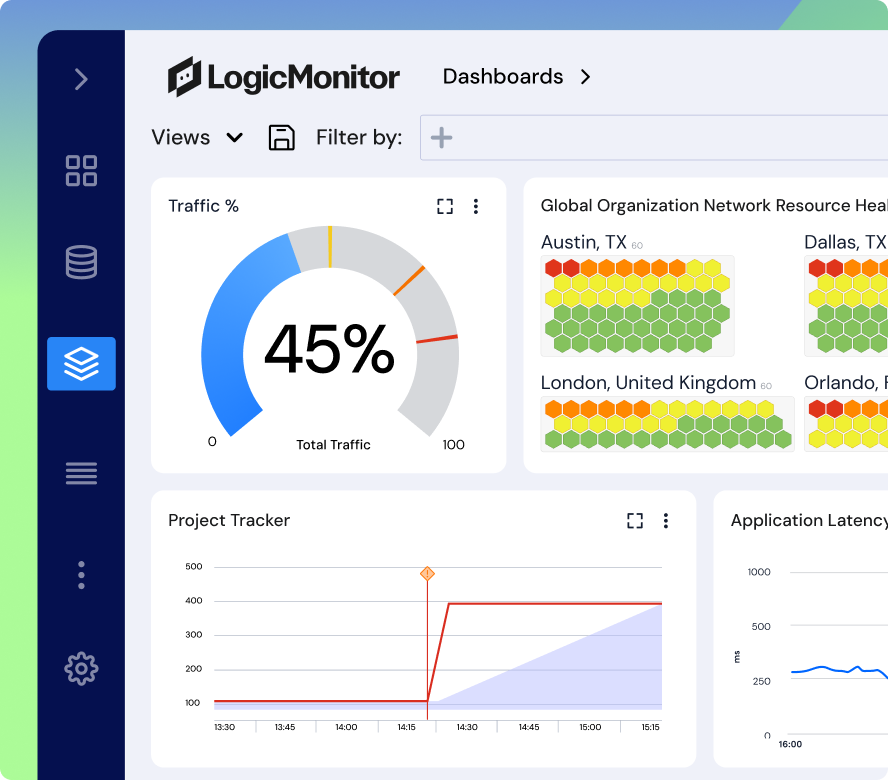
Highlight real-time KPIs, trends, and issues. Service views aggregate data so you can assess status at a glance or drill into details fast.
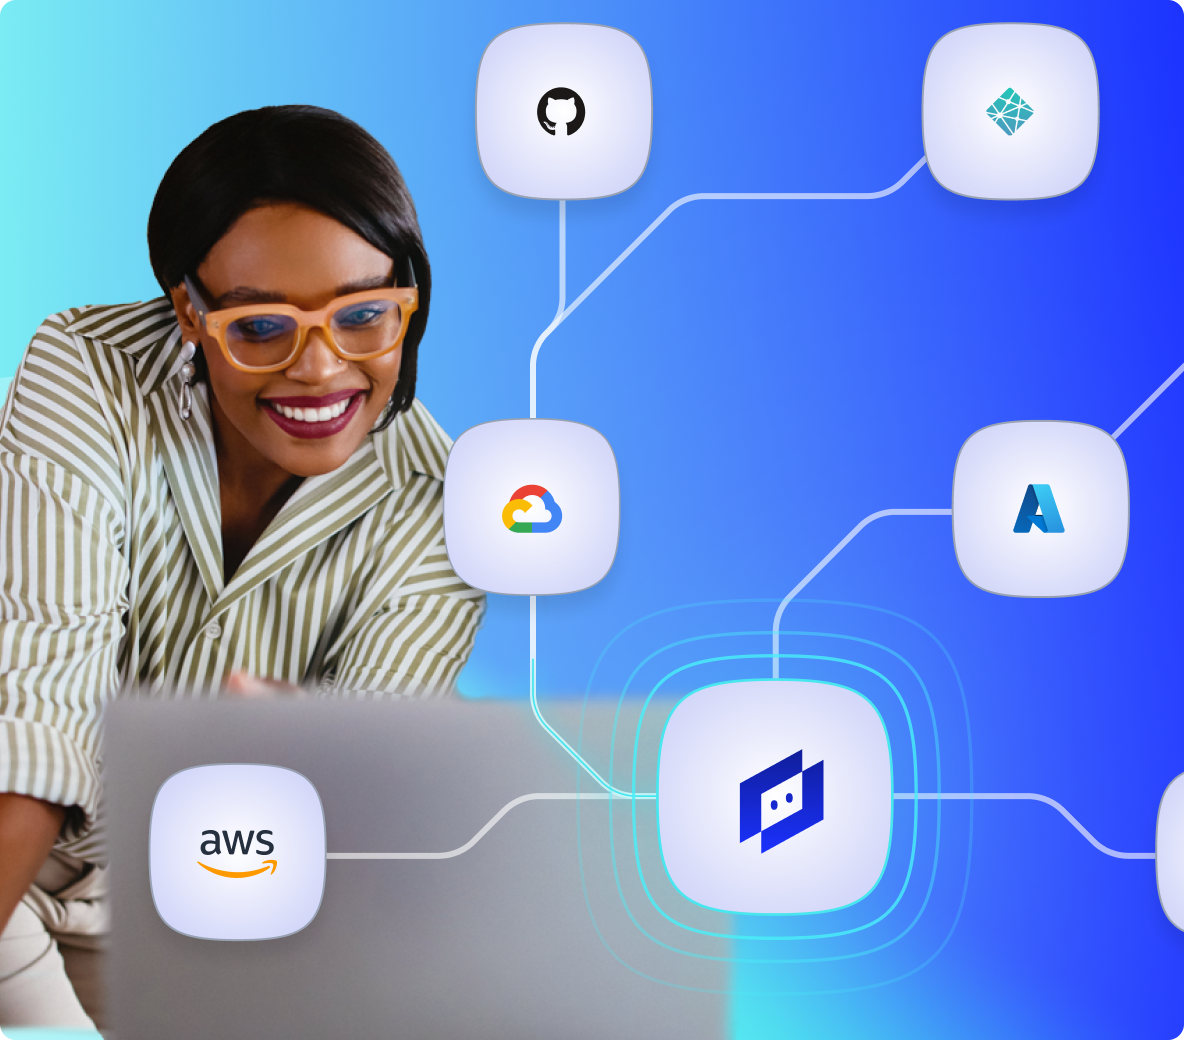
Dynamic Service Insights is built into LM Envision. It’s built to work out of the box with your existing configuration and infrastructure.