
Operational Efficiency
Do more with less by optimizing all aspects of your IT organization.

What is operational efficiency?
Operational Efficiency means maximizing outputs while minimizing inputs. In the context of IT, operational efficiency refers to using the least amount of effort to help increase the return on investment. Engineers, for instance, can spend less time fixing problems, troubleshooting, and keeping the lights on, and more time innovating and improving.


Operational efficiency benefits
Save money
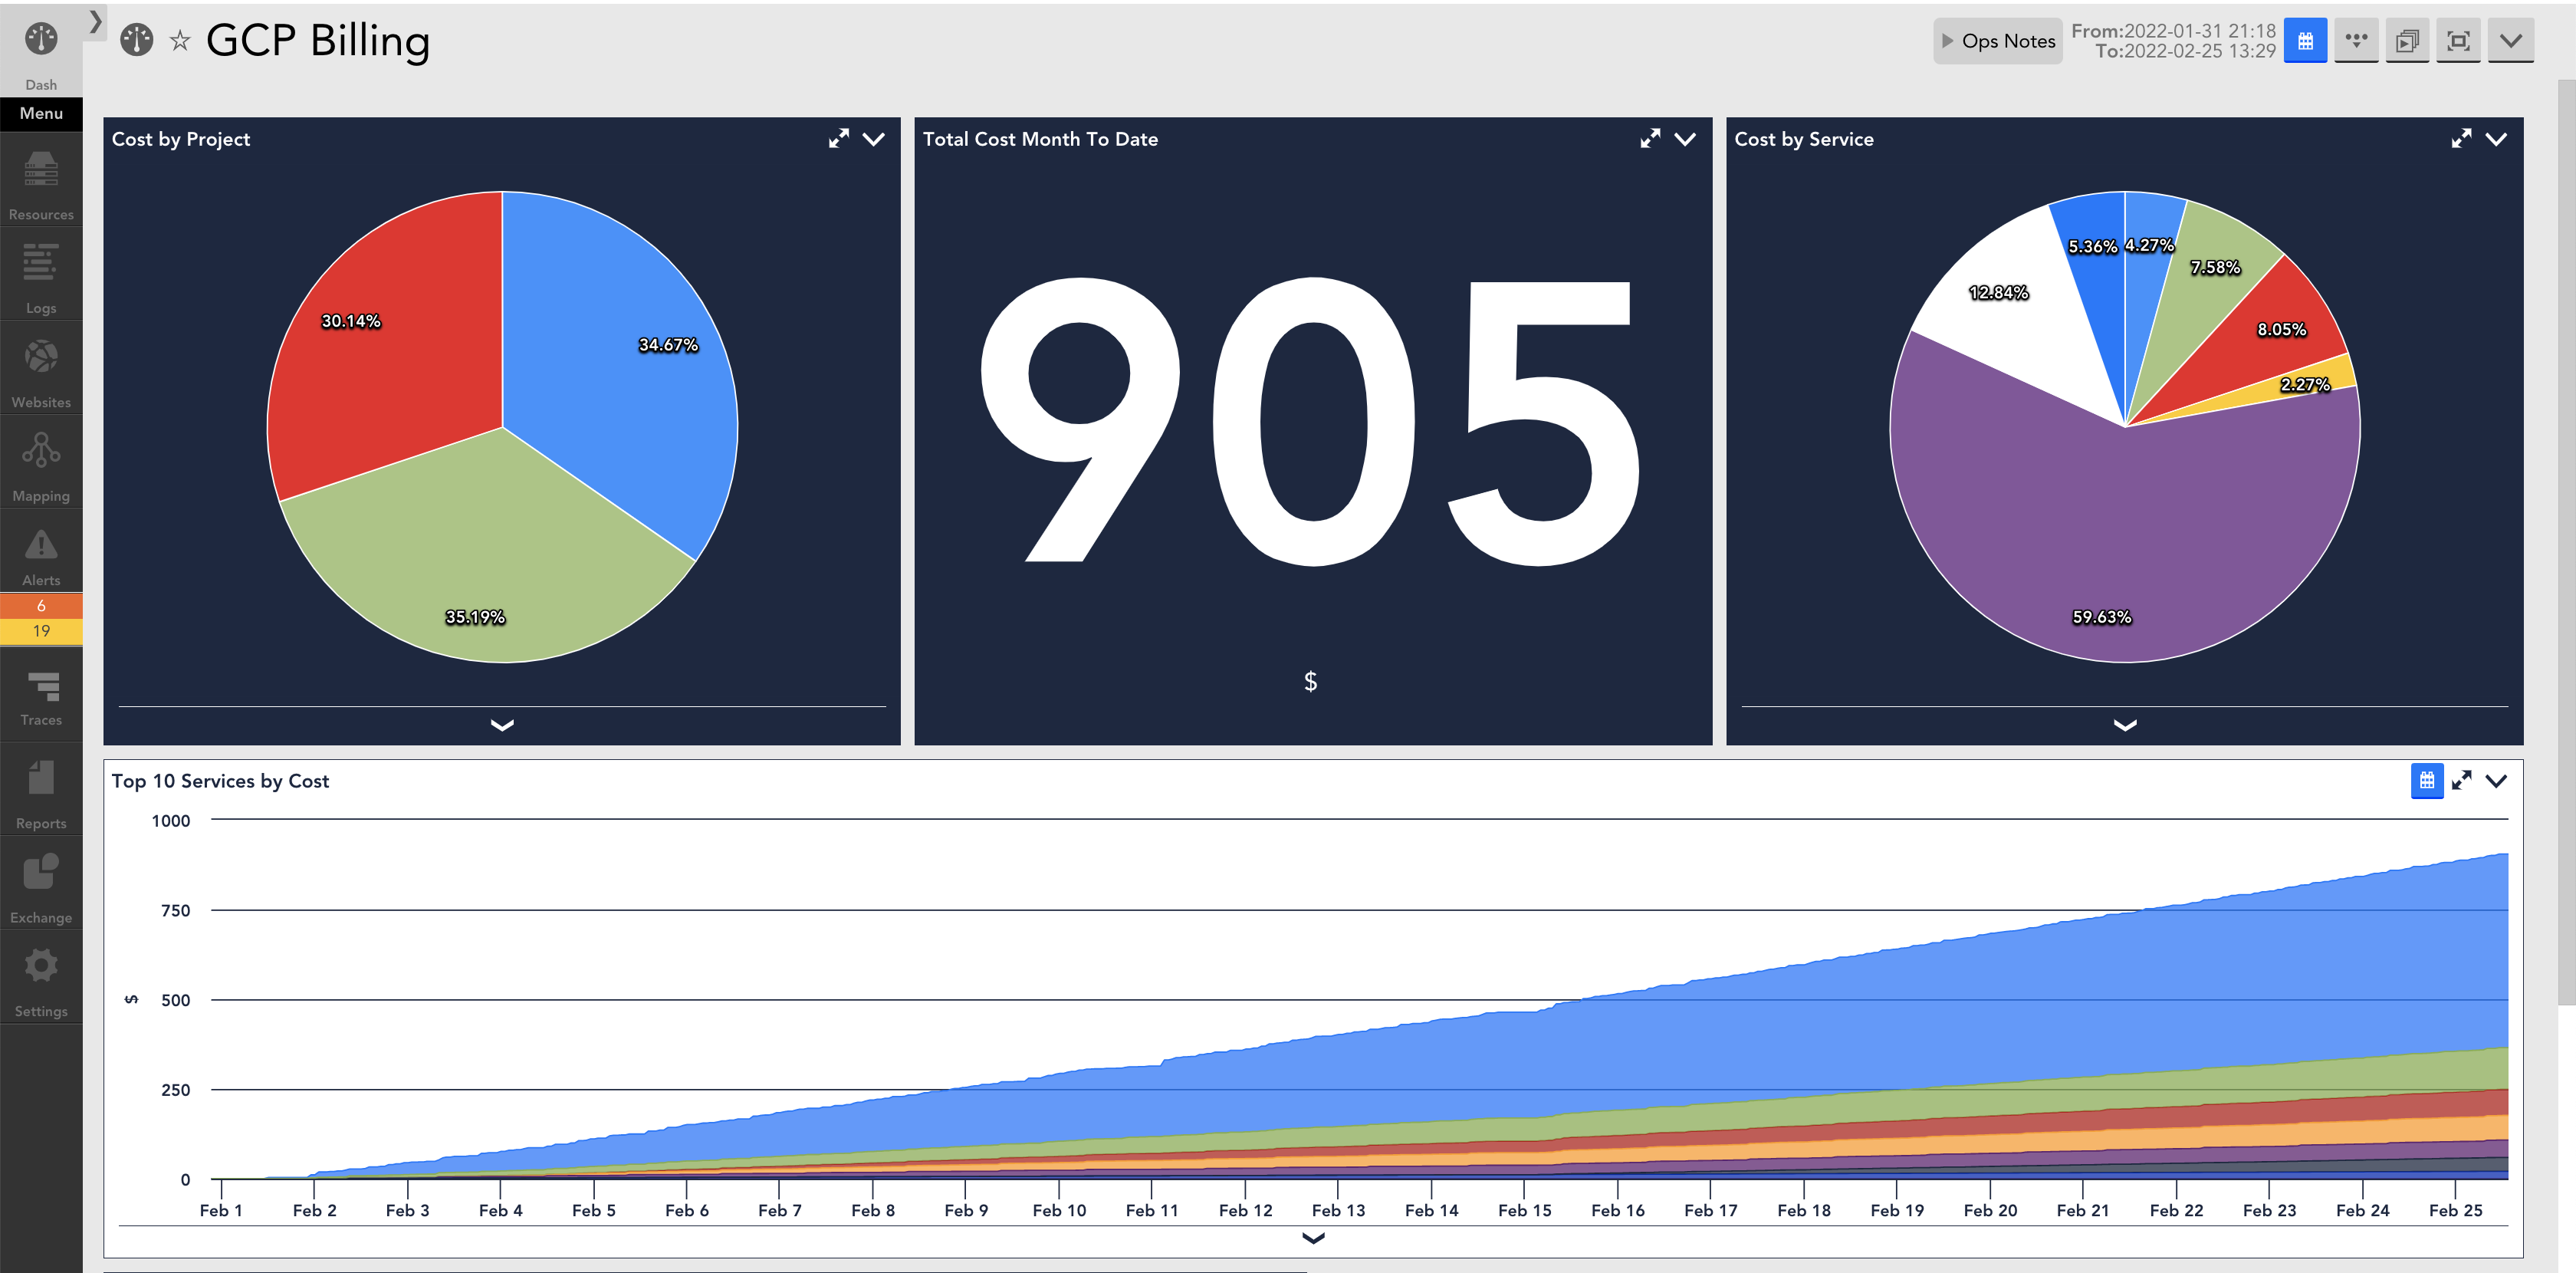
A penny saved is a penny earned. Operationally efficient IT departments can save organizations millions of dollars annually, and it starts with the ability to monitor everything in your IT stack.
Using LM Envision, thousands of out-of-the-box integrations and data sources mean you can reduce costs from every angle, including reducing time troubleshooting, saving on server allocation, and so much more.
Be agile
A key benefit of operational efficiency is the ability to be more agile. As IT becomes more complex, eliminating redundancies, reducing tool sprawl, and automating onboarding are essential to efficient best practices.
Reduce MTTR
Reduce noise, backed by context, so issues can be resolved faster.
Use LogicMonitor’s root cause analysis to:
- Make signals more actionable
- Identify and group alerts due to dependencies based on topology
- Limit alert notifications to root cause
- Prevent alert storms
- Understand more with automatically detected log anomalies
- Troubleshoot faster within context indicators for anomalies, reducing the need to context switch
Focus on what’s important
Ensure the right issues are being sent out to teams, and the wrong ones aren’t.
LogicMonitor’s dynamic thresholds can:
- Automatically learn what’s normal
- Suppress non-anomalous alerts
- Generate alerts for anomalies
- Include support for the rate of change and seasonality
See what our customers are saying:
Track your company’s network and devices with LogicMonitor.
It’s great since we don’t have to install bothersome agents on the devices or hardware that we want to monitor. I didn’t even need to consult the instructions or contact customer support when I wanted to add a device; the process is simple and easy to follow.
Feb 12, 2024
The tool for strategic Managed Services partners
SolarWinds had the big breach just as we left it. We loved how powerful it was, and how customizable – however, it is an ON-Prem tool, and as a growing MSP, that dynamic didn’t and couldn’t scale.
Nov 21, 2022

Help businesses spend less time on manual tasks and consolidate existing tools
LogicMonitor dynamically scales with our network’s growth. Whether we add new devices or expand into the cloud, the platform adapts seamlessly, eliminating the need for constant manual configuration. Excels in providing comprehensive visibility into our network infrastructure. It auto-discovers devices and monitors various network components, including servers, switches, routers, and cloud services.
Sep 22, 2023

Automate and scale
LM Envision was built to help scale your business, using automation to eliminate redundancies. Clone and customize data sources, allowing you to easily manage custom applications across multiple environments.
For MSPs using LM Envision,customer onboarding is seamless. The platform automatically provides extensive visualization into all key technologies related to customer environments and other services. The time saved by automating onboarding can greatly increase operational efficiency.
Intelligent alerting
If you don’t have to worry about keeping the lights on in your house, why should you have to worry about it at work?
Get warnings early. LogicMonitor’s intelligent early warning system features:
- The ability to distinguish signals from noise
- The ability to eliminate noise and focus on what needs attention
- Dependency Mapping
- Actionable signal configuration
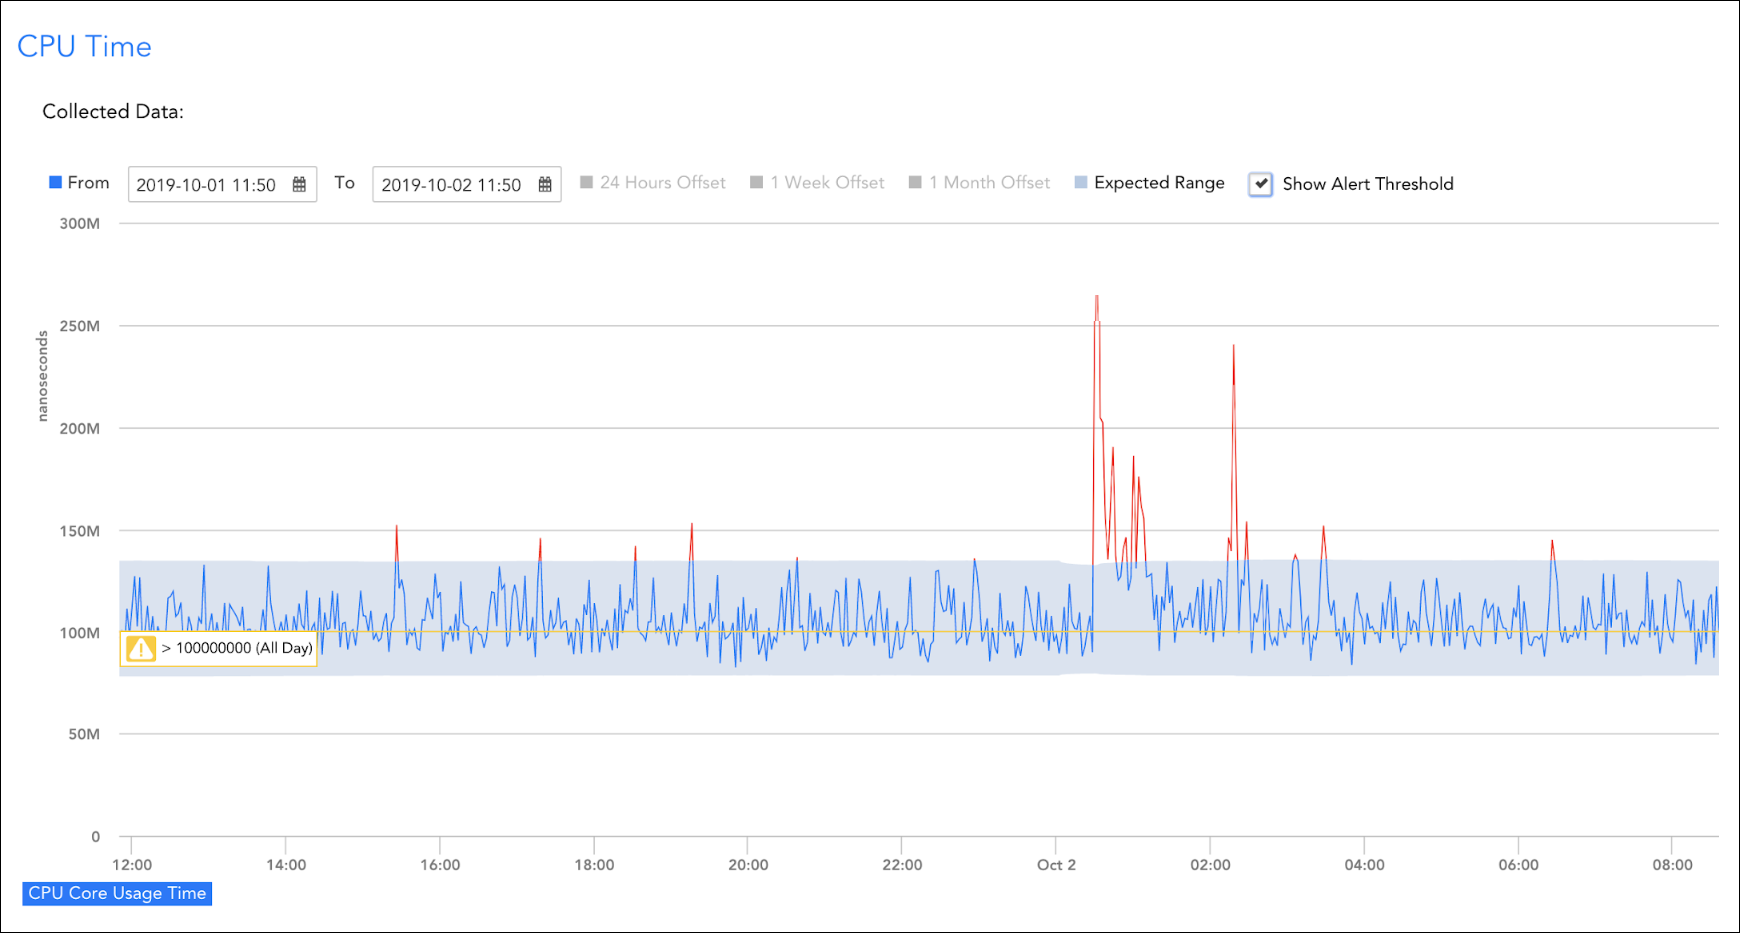
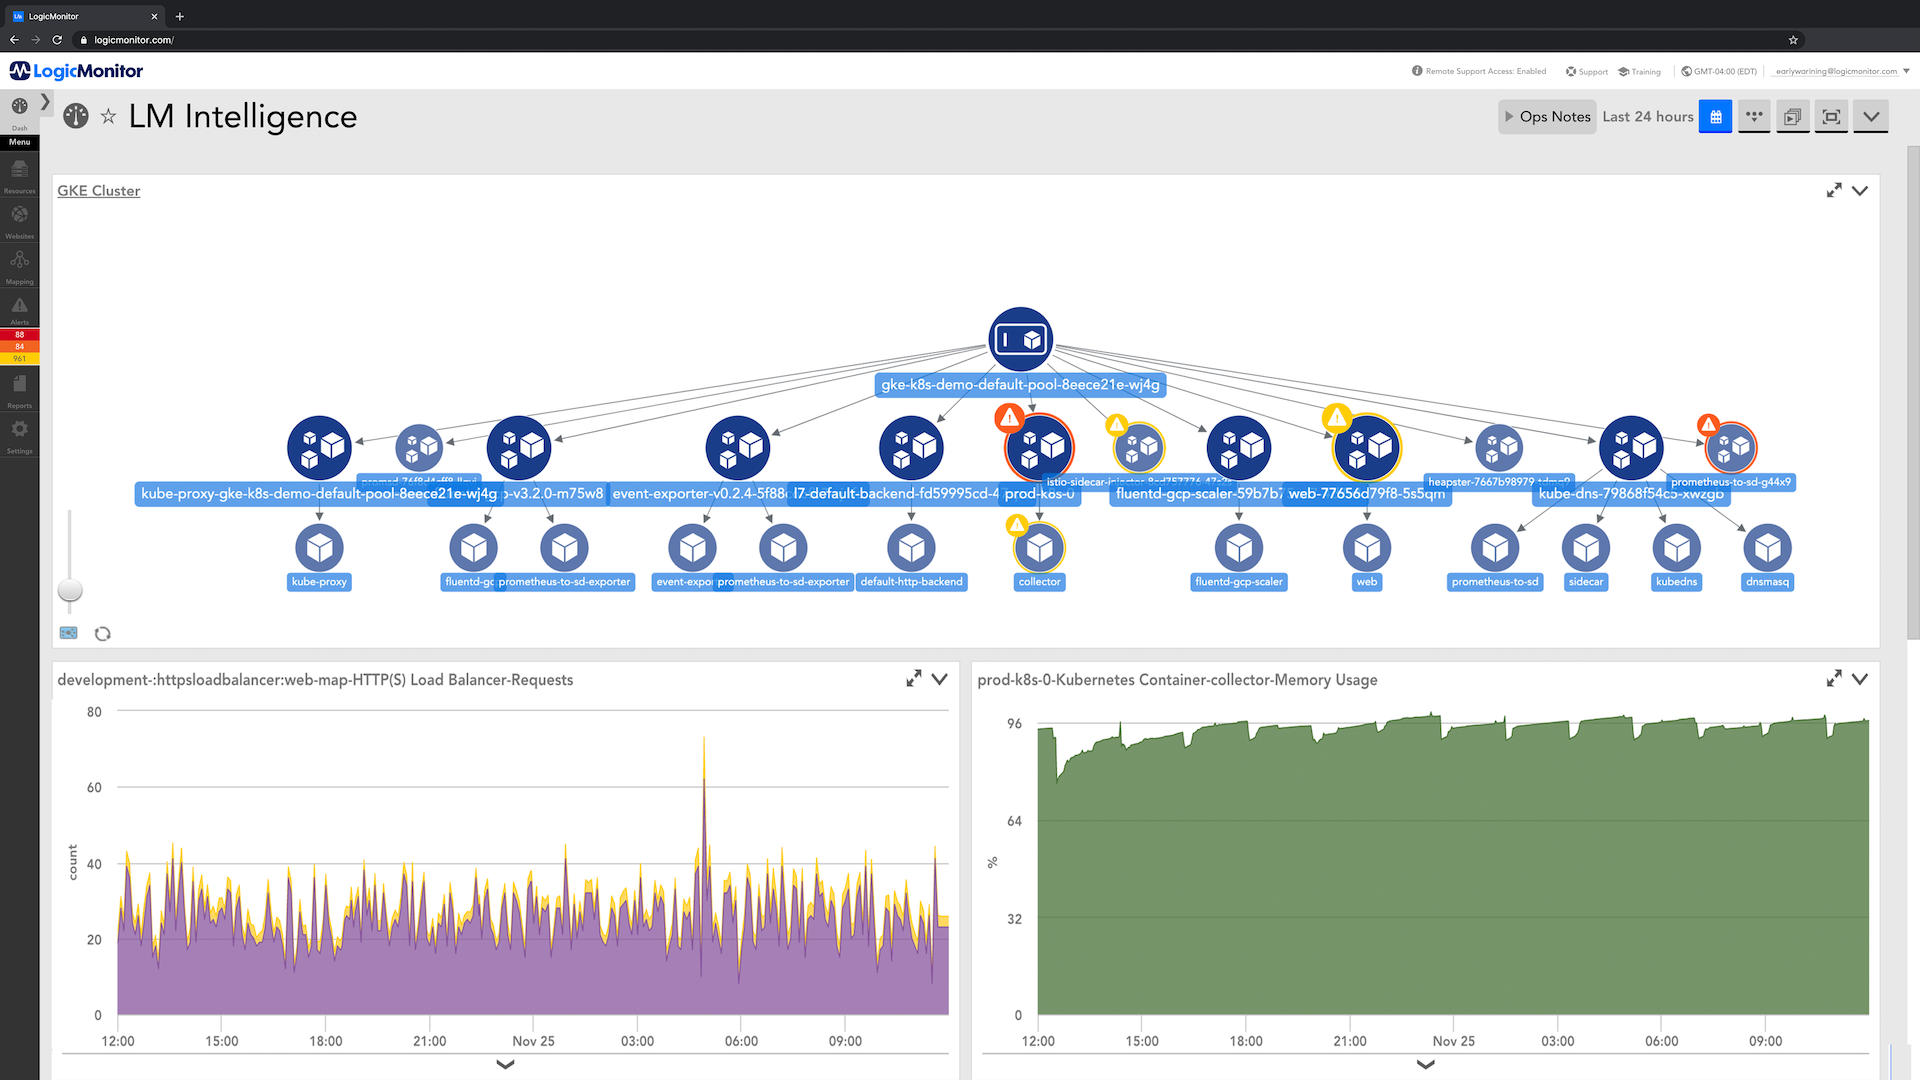
For example, say you’re looking at memory usage for a Kubernetes container. With one click, LM Envision can show anomalies from the collected data over a period of time, showing drops or upticks dynamically based on historical data, and only notify you when something is out of the norm. Additionally, you can set your own hard parameters for usage, so if memory usage drops below the acceptable range, you can be notified of a critical alert, potentially saving you significant time troubleshooting.
Less time fixing, more time improving
LM Envision is built to go beyond monitoring, allowing you to identify and quickly resolve issues that arise, ultimately reducing MTTR. Automatically surface anomalies and see them in the context of your alerting, so you can go from wondering what’s wrong to finding why something happened –making troubleshooting happen much quicker.
Let’s say you’re using a Tomcat server, and one of the engineers spelled one of the document roots incorrectly, which created a path that doesn’t exist. Moments later, you were alerted that your web server went from good to bad, showing HTTP 4XX errors. By taking a quick look at log anomalies, LM Envision helps you see when those errors started occurring, as well as changes detected prior to the alert triggering. Instead of troubleshooting for hours because of one & accidentally thrown in.
More resources

accelerate growth / 02.13.24
How Hain Celestial Group Streamlined IT and Slashed Costs with LogicMonitor and AWS
Learn More
accelerate growth / 02.07.24