Reduce MTTR with unified logs and metrics
Everyone defines MTTR a little differently, but it all comes down to fixing problems and freeing up time to innovate. Whatever it is, fix it fast with LM Envision.


Reduce MTTR with modern monitoring & proactive data
To keep MTTR at a minimum, you need efficient Ops teams, empowered by knowledge and time. But it can be a process. With LM Envision, reduce MTTR by understanding connectivity across IT environments and remove guesswork at every step. Know exactly why a failure occurred and quickly identify, fix, and learn to maximize service availability.

Monitoring alone is no longer enough
With hybrid and multi-cloud IT environments, Ops teams are forced to switch between tools and sift through siloed data streams.
The complexity lies in knowing how to find the problem and equip the team with the right data to investigate and troubleshoot.
- Overwhelming IT metrics and alerts that don’t correlate to the underlying issue
- Tool sprawl results in artificial inefficiencies and longer MTTR
- Siloed IT and log data prevents quick and accurate troubleshooting
- Too much IT and log data becomes difficult to analyze and makes it nearly impossible to pinpoint issues
- Legacy monitoring solutions leave gaps in IT health
Eliminate guesswork with predictive and proactive observability
Unified logs and metrics
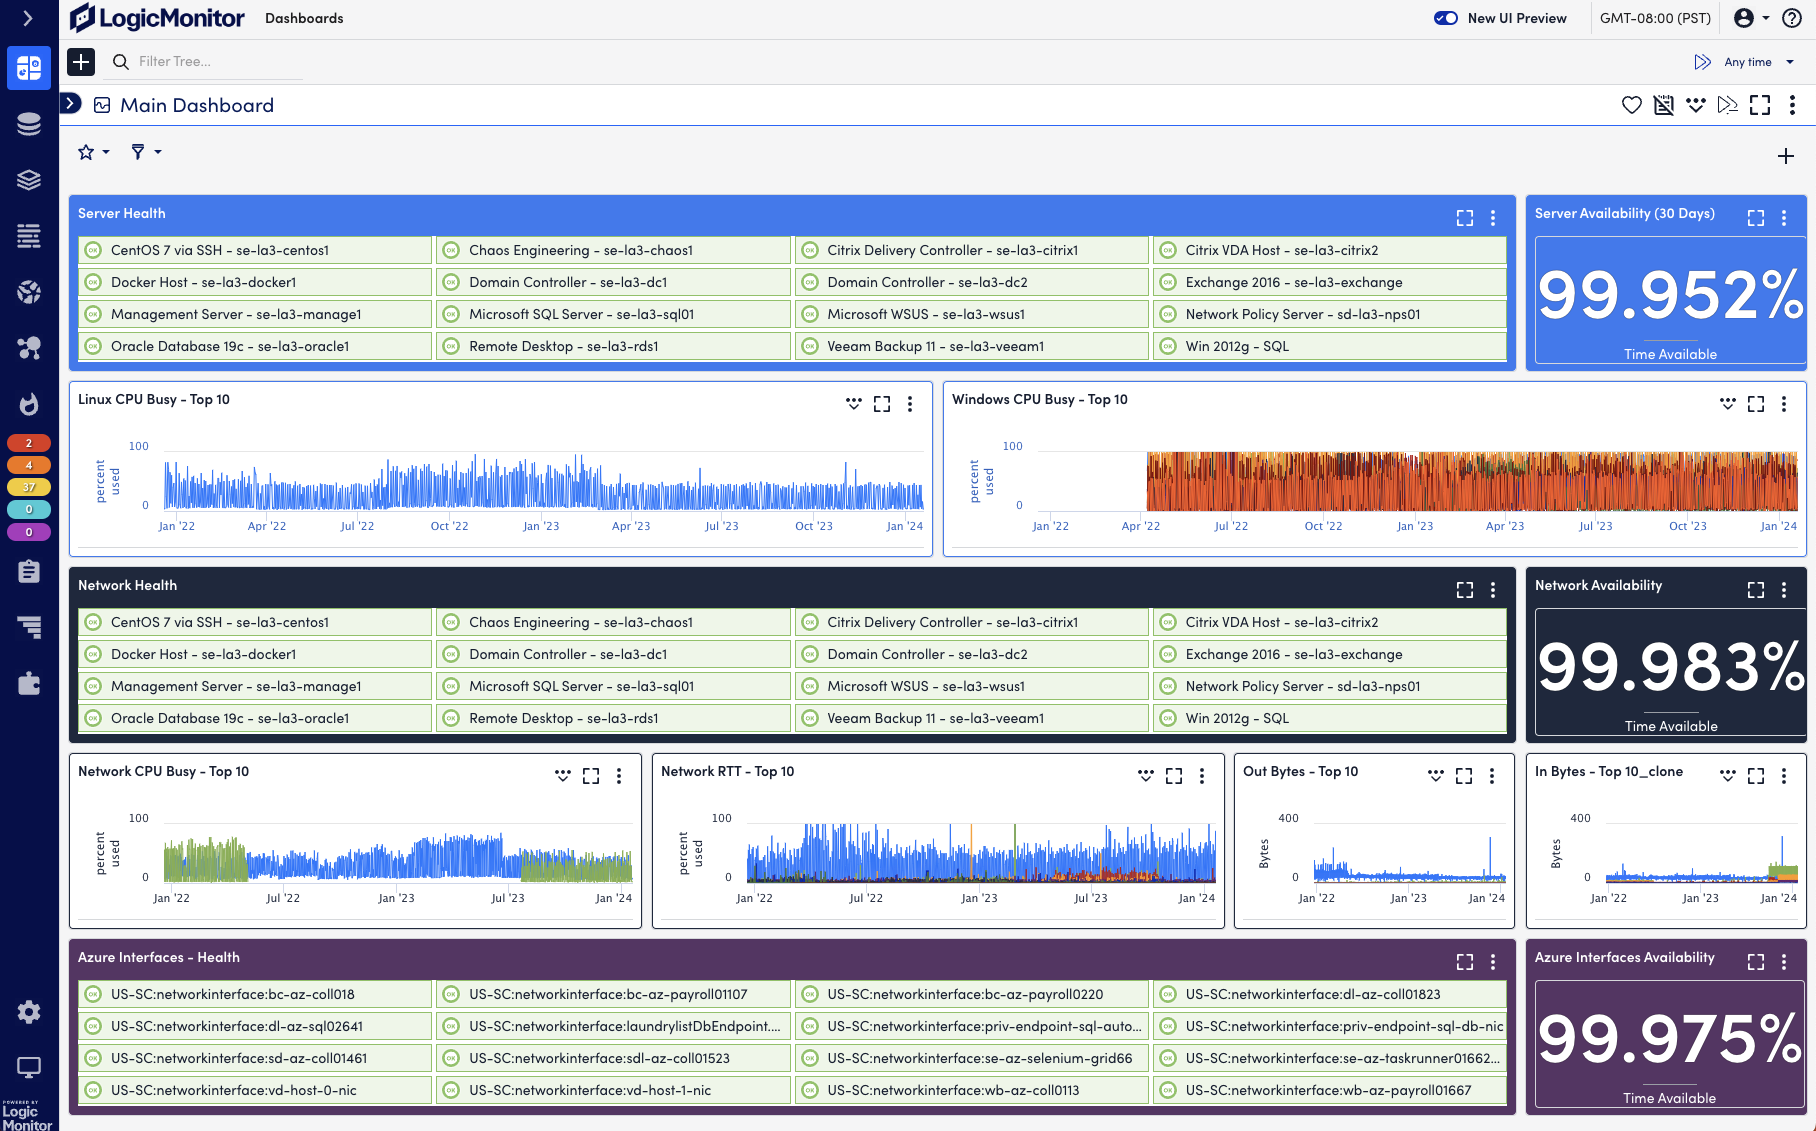
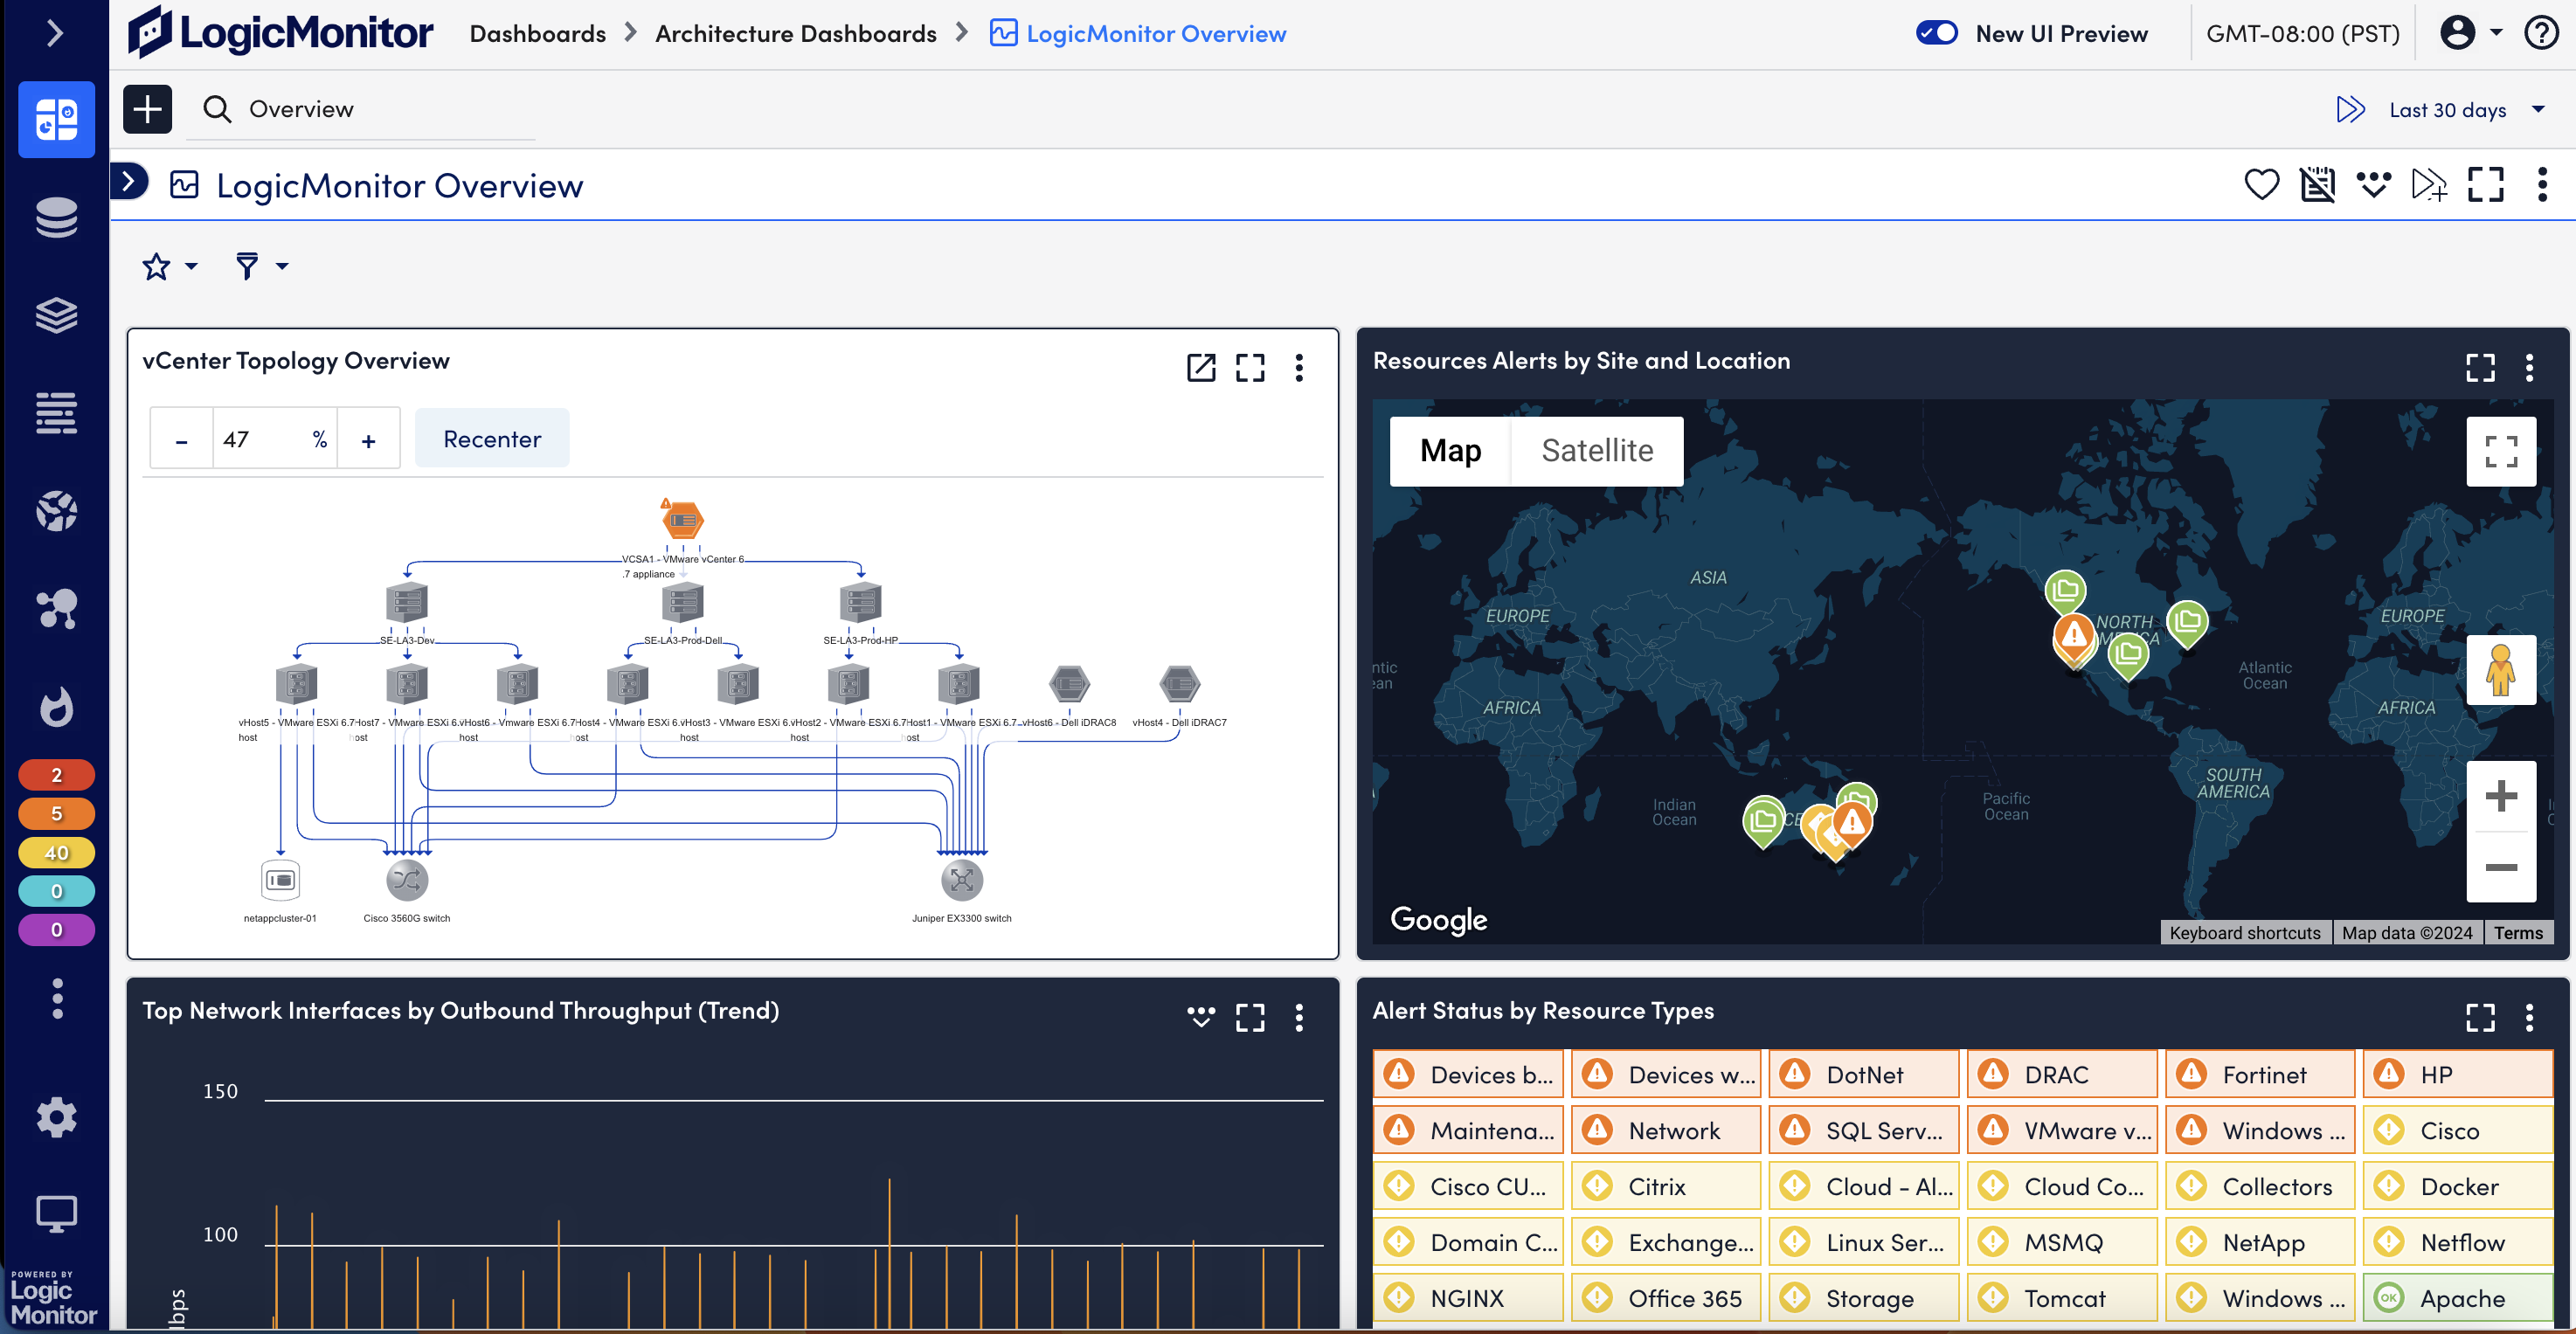
LM Envision connects all of your IT data from any source in a single, unified observability platform for centralized logs and metrics (for visibility in MTTR).
Proactive (AIOps) workflows
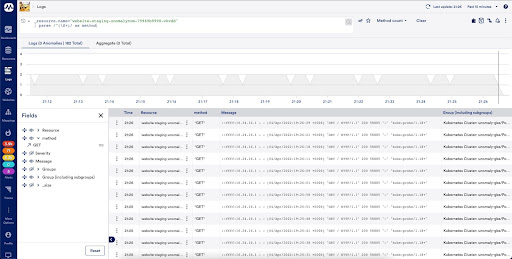
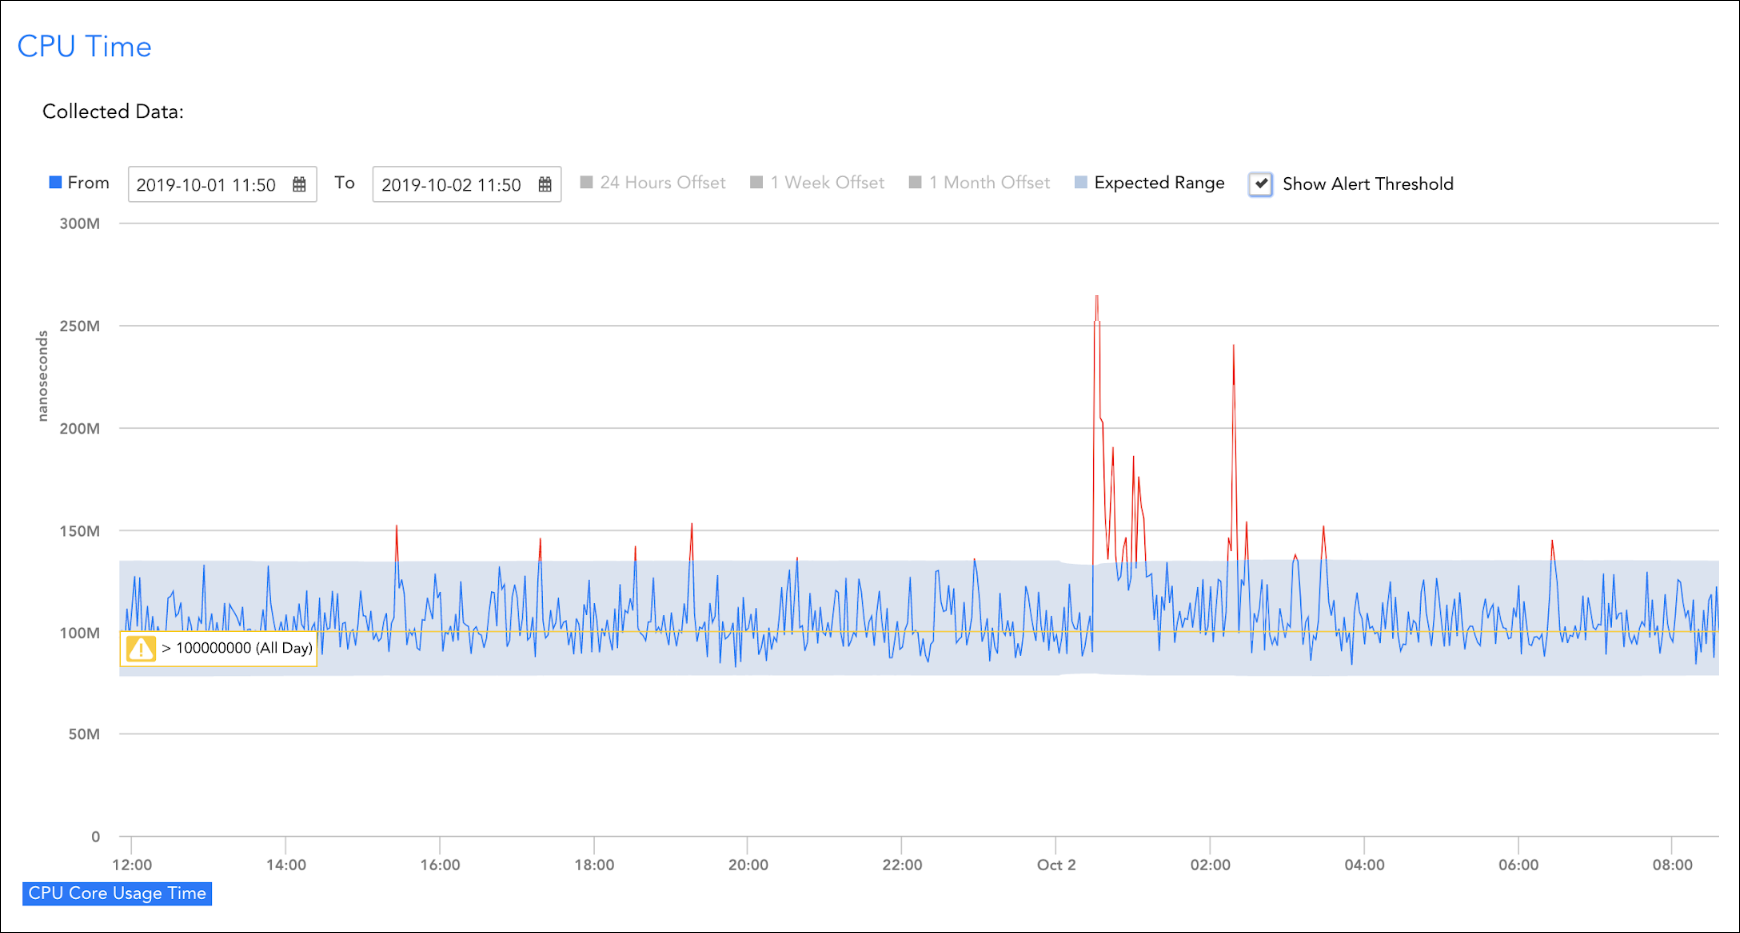
Dynamic threshold and log-based anomaly detection alert specific Ops teams to potential service issues, allowing them to reduce MTTR with actionable insights.
Automated correlation with IT metric-based alerts
Access correlated log data to add context to alerts and reduce time identifying root cause.
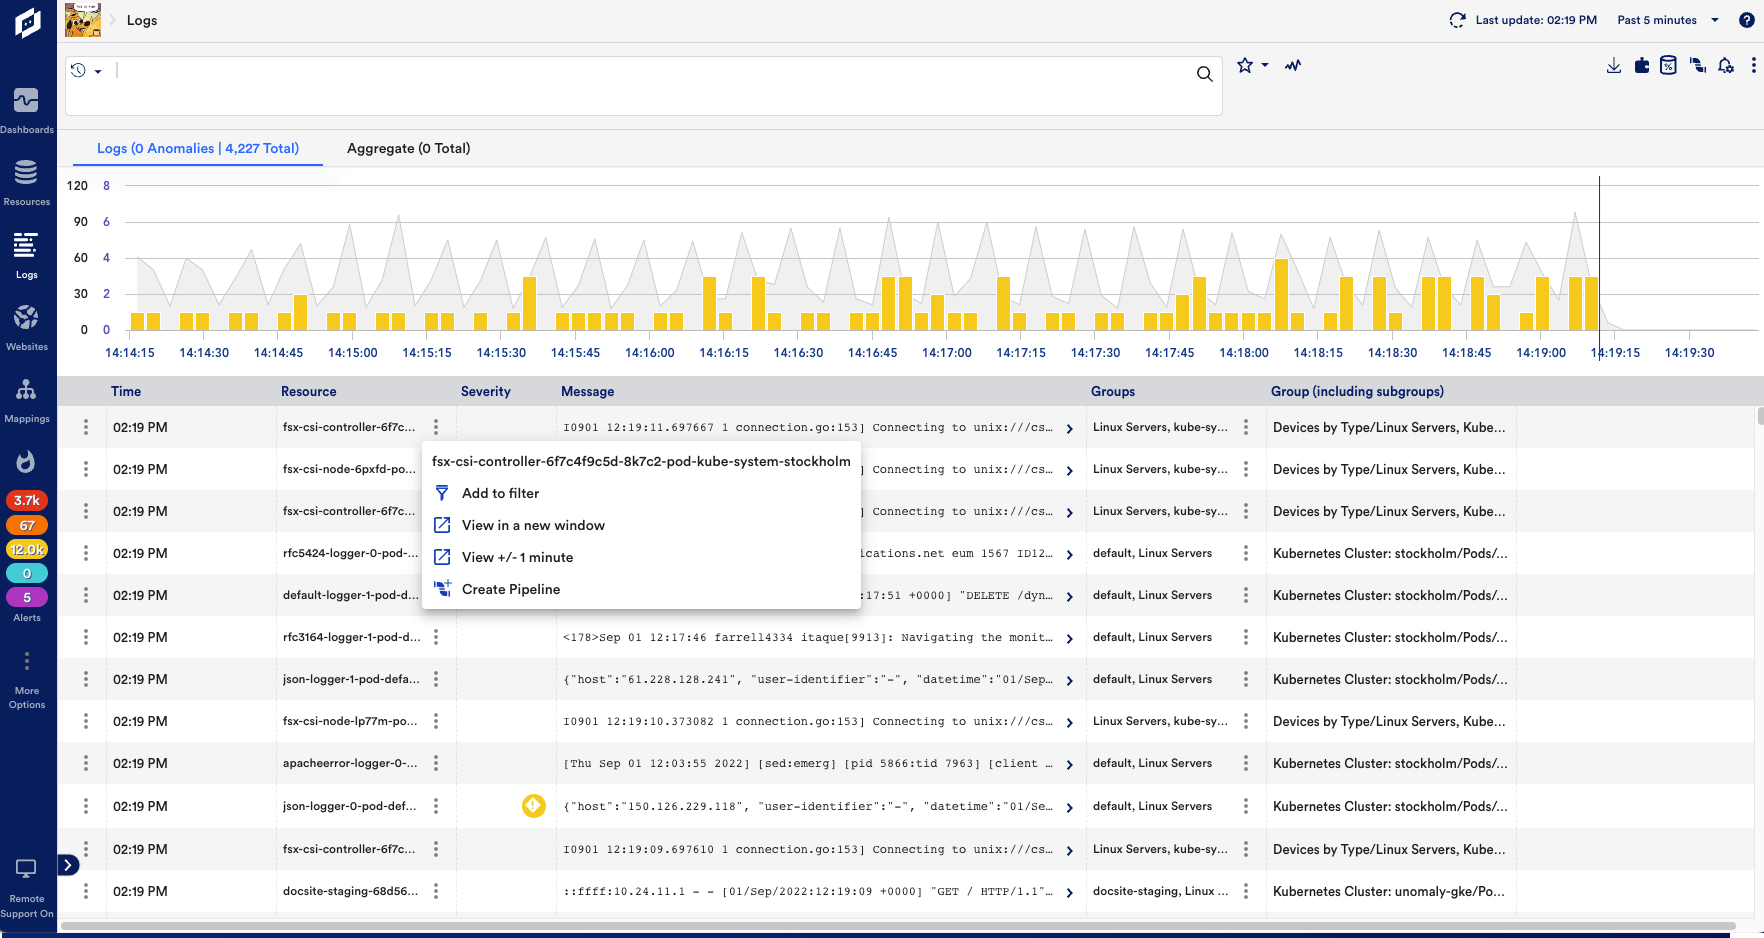
Intelligent log analysis
Import log data to LM Envision for monitoring and analysis with integrations, modules, and pre-built templates. Enhanced data helps reduce MTTR.
Dynamic observability experience
LM Envision can remove monitoring blind spots by adding context-rich IT and log data to every layer of the techstack — in both hybrid and multi-cloud environments.
Historical data for trend analysis
Historical log data and robust data retention allows teams to establish baselines and forecast trends. Learning from previous issues leads to faster fixes and reduced MTTR.
Resolve issues once and for all
Monitor cloud, networks, applications, services, log data, and more in one unified platform.

Streamlined ops workflow
- Single monitoring solution enables IT teams to work efficiently
- No more swivel chair between monitoring and logging solutions to troubleshoot
- Pivoting from metrics to logs in-context allows investigation of log data until insights are found
- Access IT health metrics, with log data for a specific device or resource just one click away
- Identify issues–and fix them instantly–with all of that data in one place
Make sense of your data
- Access historical log data instantly with hot storage and use simple searches to analyze it
- Onboard faster with easy log data ingestion and analysis
- Create predictive log alerts by easily reviewing past issues and associated anomalies

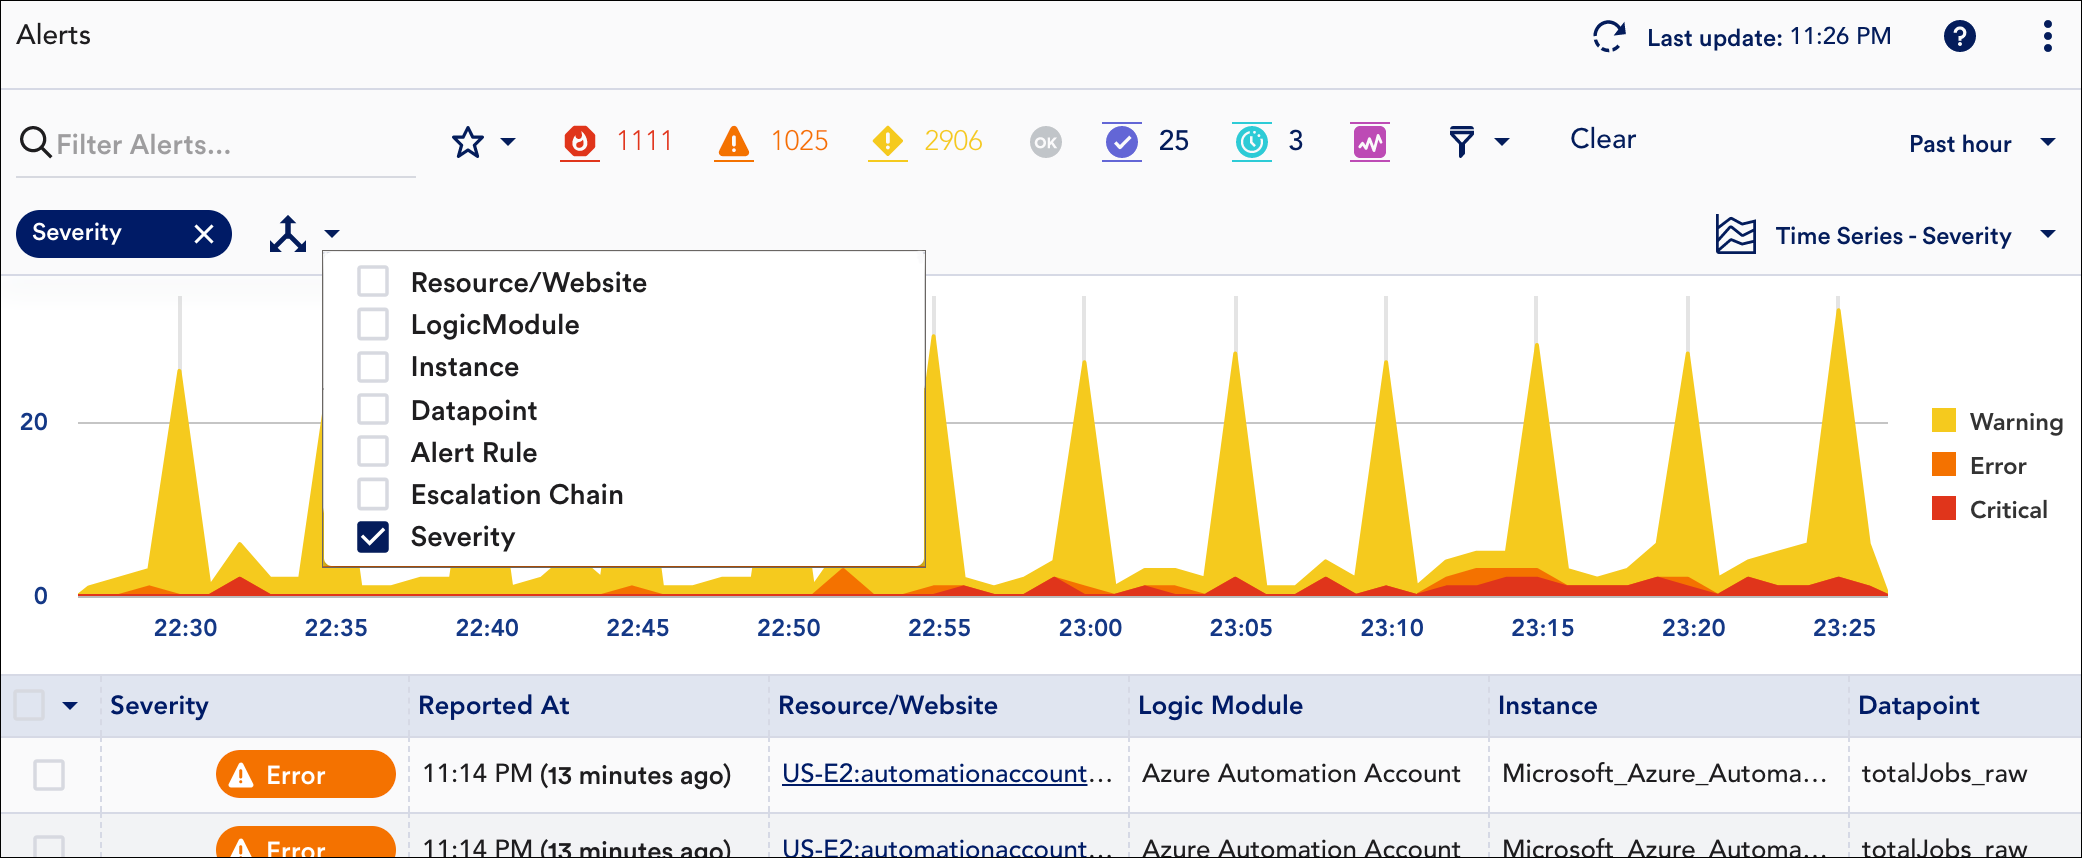
Reduce noise with relevant alerting
- Use anomaly detection to surface issues that require immediate attention
- Proactively troubleshoot in tandem with infrastructure alerts
- Give logs access to all IT practitioners to reduce unnecessary escalations
- Save important log searches to create metrics for expanded alerting

Intelligent log-based anomaly detection
- Algorithms automatically analyze every element of log data events at the time of ingest for immediate triage
- Gain 360-degree visibility into logs with anomaly detection for any device, system, cloud instance, or K8s pod
- Focus on impactful, performance-related activity without having to decipher between normal and abnormal events
Fix it fast with unified logs and metrics
Watch a webinar about how you can reuce MTTR with logs
Don’t take our word for it. Hear it from the source.
Track your company’s network and devices with LogicMonitor.
It’s great since we don’t have to install bothersome agents on the devices or hardware that we want to monitor. I didn’t even need to consult the instructions or contact customer support when I wanted to add a device; the process is simple and easy to follow.
Feb 12, 2024
The tool for strategic Managed Services partners
SolarWinds had the big breach just as we left it. We loved how powerful it was, and how customizable – however, it is an ON-Prem tool, and as a growing MSP, that dynamic didn’t and couldn’t scale.
Nov 21, 2022

Help businesses spend less time on manual tasks and consolidate existing tools
LogicMonitor dynamically scales with our network’s growth. Whether we add new devices or expand into the cloud, the platform adapts seamlessly, eliminating the need for constant manual configuration. Excels in providing comprehensive visibility into our network infrastructure. It auto-discovers devices and monitors various network components, including servers, switches, routers, and cloud services.
Sep 22, 2023

More resources