LogicMonitor for State and Local Government

Prioritize infrastructure modernization and back-end process automation to fast-track digital transformation.

Government icon

Addressing state and local government IT trends, challenges and solutions

Modernize legacy services and applications to increase performance and reliability of critical services across cloud and hybrid environments.

With LogicMonitor’s GCP support, Cloud SQL database instances are automatically discovered and monitored alongside the rest of your hybrid infrastructure.

One platform for unified observability

Logs

Log intelligence at scale– instant access to contextualized and correlated logs and metrics in a single, unified cloud-based platform. With tiered retention options (including unlimited retention) and hot storage to optimize data hygiene and internal compliance initiatives.

Metrics

Single platform for ITOps and DevOps that eliminates data silos and tracks metrics that matter. Built on OpenTelemetry and OpenMetrics allowing for a vendor-neutral approach to better understand the user experience and accelerate business transformation.

Traces

Never miss an application error, improve code quality, and diagnose and fix issues faster. Gain insight into the performance of the entire app stack, from code to cloud, to ensure a flawless customer experience in agile environments.

Helping businesses drive innovation by consolidating and standardizing monitoring for on-premise and cloud environments

LogicMonitor provides comprehensive visibility into dynamic IT environments for your networks, cloud, applications, servers, log data, and more. Data correlation provides insights for intelligent troubleshooting and predicting bottlenecks to scale IT investments and control operational costs enabling enterprises to consolidate and streamline their observability estates.

Data governance: transparency, open data

LogicMonitor provides instant access to contextualized and correlated logs and metrics in a single, unified cloud-based platform with infinite log retention and hot storage that democratizes logs access to maximize data hygiene, and internal compliance initiatives.

Rapid and automatic deployment and configuration for efficient monitoring and lessened workloads

Get the answers you need to solve problems faster with LogicMonitor’s fully automated platform. Our agentless collectors automatically discover, map, and set baselines for complex and distributed infrastructure in a matter of minutes. Put the manual configuration and expensive hardware behind you and ensure quicker time to train and lessened workloads on IT staff.

Visibility for teams to modernize public services and improve application performance at scale

LogicMonitor prevents context switching with a single view of application services, performance, and infrastructure. LogicMonitor empowers teams to gather, track, trace, and measure application and infrastructure performance so they can achieve digital transformation initiatives with business outcomes – delivered via LogicMonitor’s Unified Observability Platform.

Secure by design

LogicMonitor’s platform is secure. The following are just some of the ways LogicMonitor ensures user and systems security:

Secure architecture

RBAC, 2FA, Encryption of data in transit and at rest

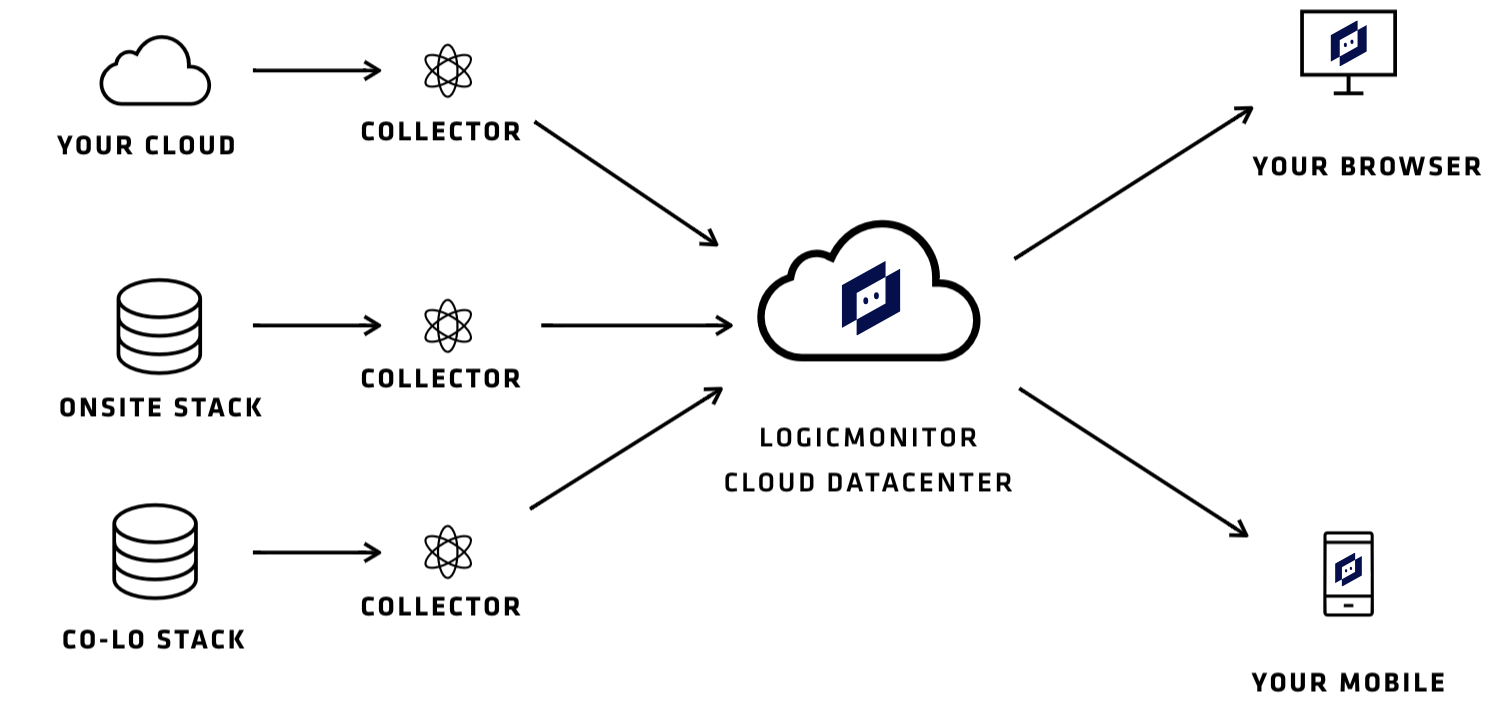
Secure data collection

Only outbound comms allowed from LM Collector, data encrypted with TLS, LM Collectors securely locked to your environment.

Secure operations

Collectors based on hardened Linux with perimeter and host-based IPS, operated out of top tier DCs and AWS regions, all with top security measures in place.

Secure practices

Minimal personal data stored, device access credentials stored in memory and never written to disk, salted one way hashes used in place of user passwords.

Secure standards

Constant penetration testing ensures maximum security, SOC2 validates our controls for security, high availability and confidentiality.

Trusted by:

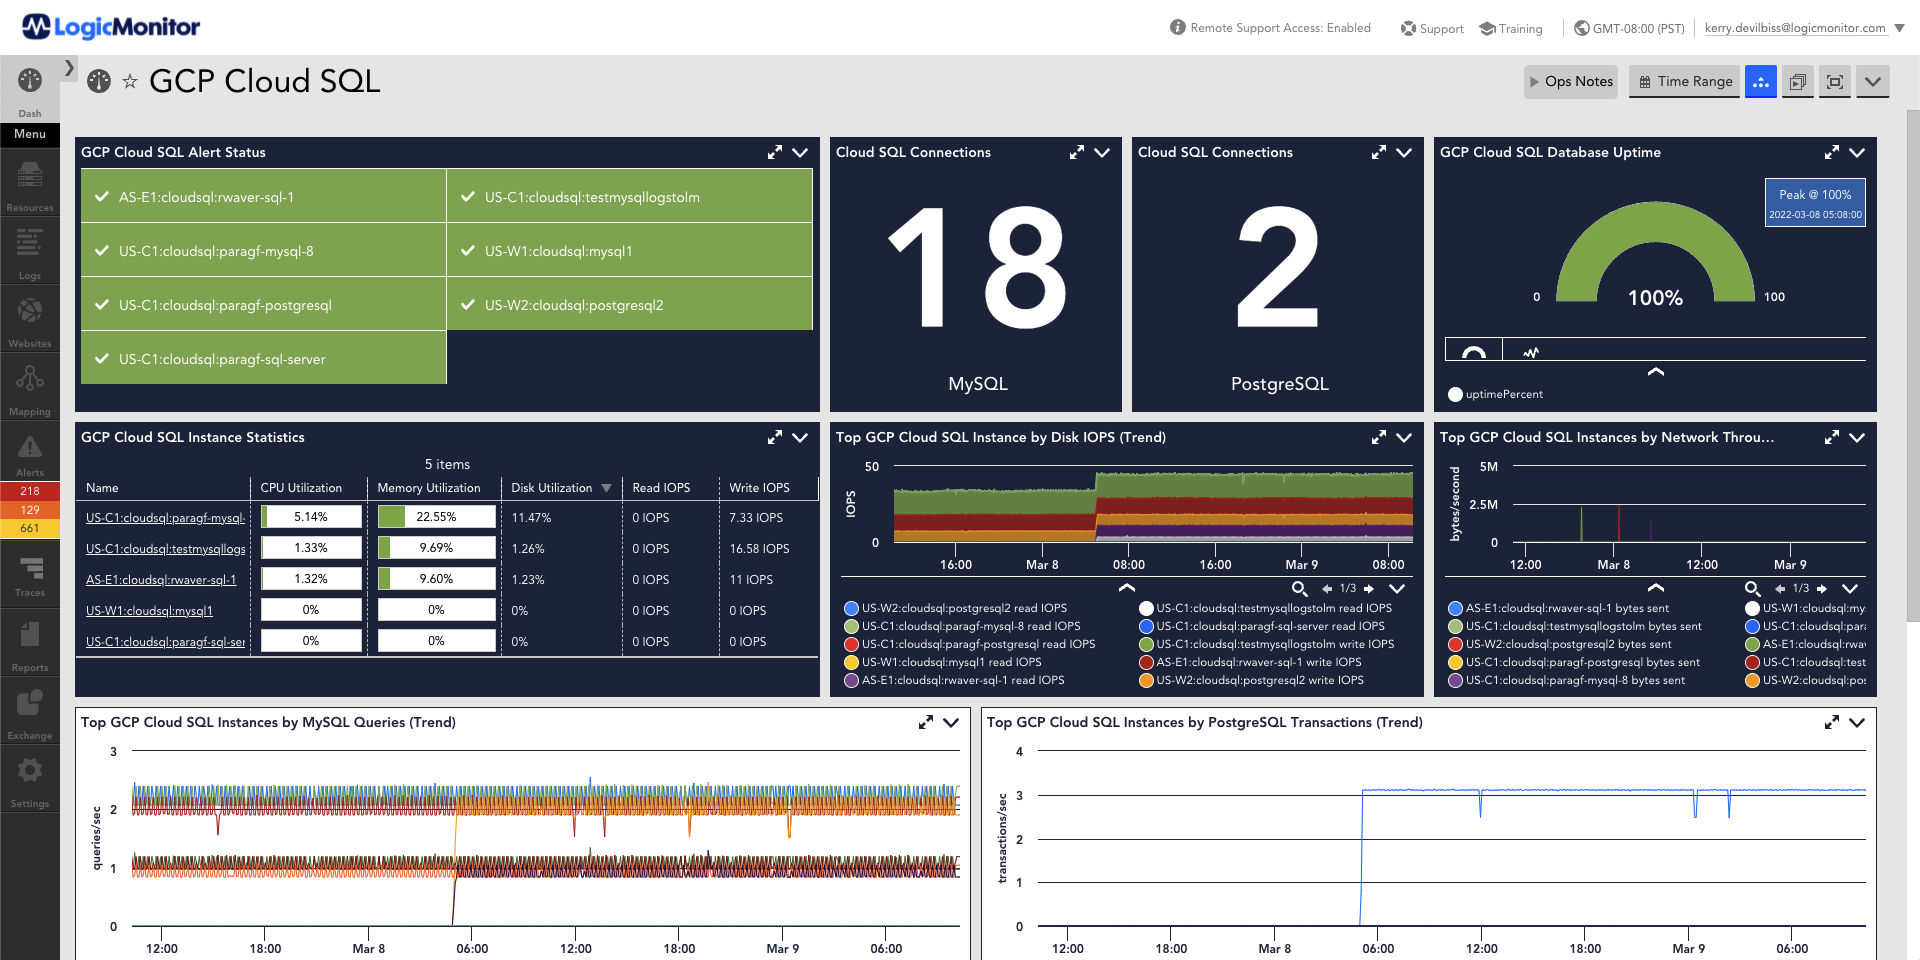
LogicMonitor has given us the power of full-stack observability and the ease of a SaaS product. We’ve got a set of dashboards that are focused on specific products and tell us everything that we need to know.

AL HEPWORTH, SENIOR DIRECTOR OF ENGINEERING PEACH

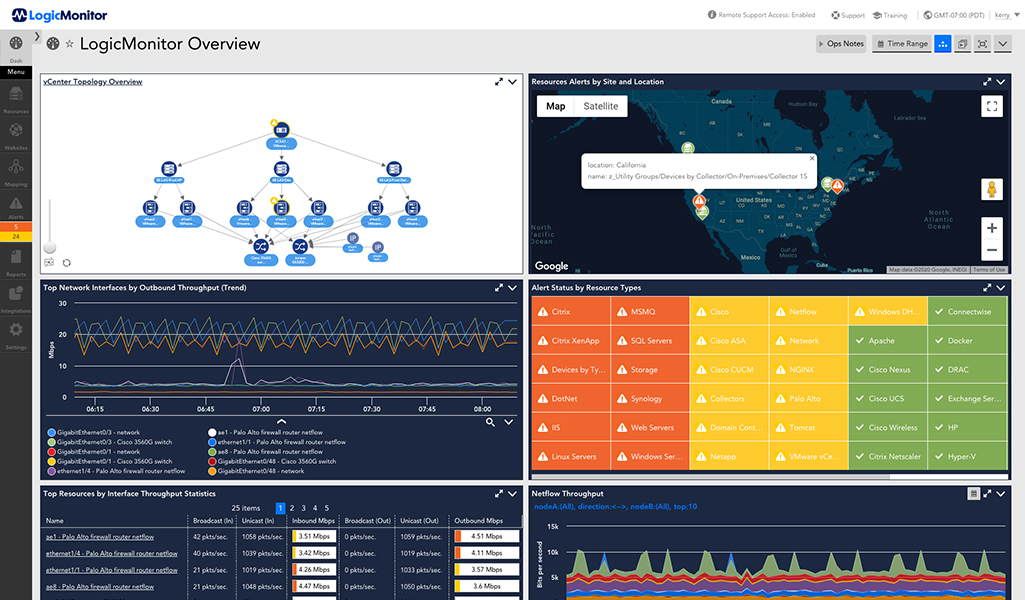
Single pane of glass for IT and OT

LogicMonitor marries visibility into your traditional and cloud workloads with your IOT and production systems to allow you to troubleshoot and optimize the system as a whole.

Extensive breadth of coverage across on-prem, cloud and containers

  • 2,500+ integrations
  • Rapid release cycle
  • 350+ new or updated data sources released last year
LogicMonitor Overview Takeout View

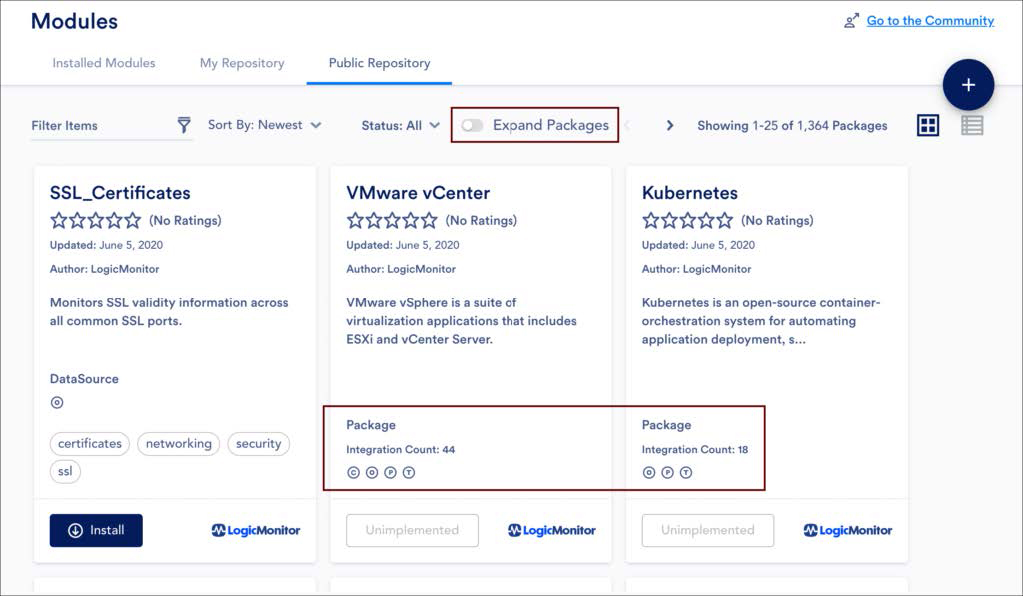
Simplified extensibility into IOT

  • LM Exchange offers a library of integrations to bring you out-of-the-box monitoring for networking devices, applications, databases and services
  • A centralized view of integrations available in LogicMonitor’s global repository
  • Custom monitoring templates with rapid protyping capabilities

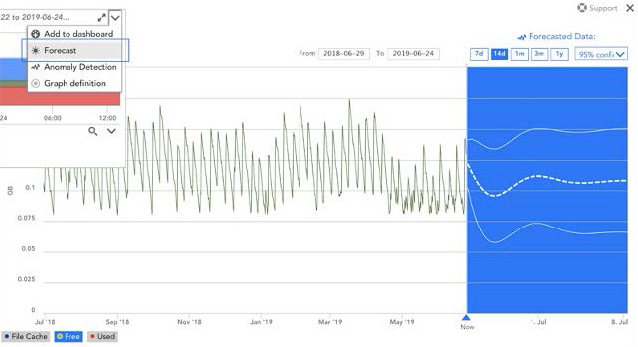
AIOps to forecast and identify anomalies

  • Intelligently detect service-impacting signals from noise, making signals more actionable
  • Ensure the right team members are informed via SMS, email, chat or ITSM integrations
  • Identify the root cause of an outage and put an end to alert storms
AIOps to Forecast and Identify Anomalies

Related resources

LogicMonitor Partners With Carahsoft to Deliver Digital Transformation Solutionsto the Public Sector 

government / 08.01.23

LogicMonitor Partners With Carahsoft to Deliver Digital Transformation Solutions to the Public Sector 

LogicMonitor announced a partnership with Carahsoft Technology Corp., The Trusted Government IT Solutions Provider.

Learn More
Henrico IT reduces alert noise by 90% with LogicMonitor

alerts / 04.05.23

Henrico IT reduces alert noise by 90% with LogicMonitor

The County of Henrico went from 5,000 daily alerts to three by reducing alert noise with LogicMonitor. Learn how it happened.

Learn More
OPERS logo

case study / 02.27.23

OPERS increases visibility and insights

OPERS gained new capabilities for monitoring and displaying key information, including the ability to create custom dashboards to monitor and log server utilization with LogicMonitor.

Learn More

It’s almost like magic. Let’s chat.