LogicMonitor for Manufacturing
Manage IT and OT holistically to drive innovation and change for your business with LogicMonitor’s unified observability platform.
Manufacturing industry: IT trends, challenges and solutions at LogicMonitor
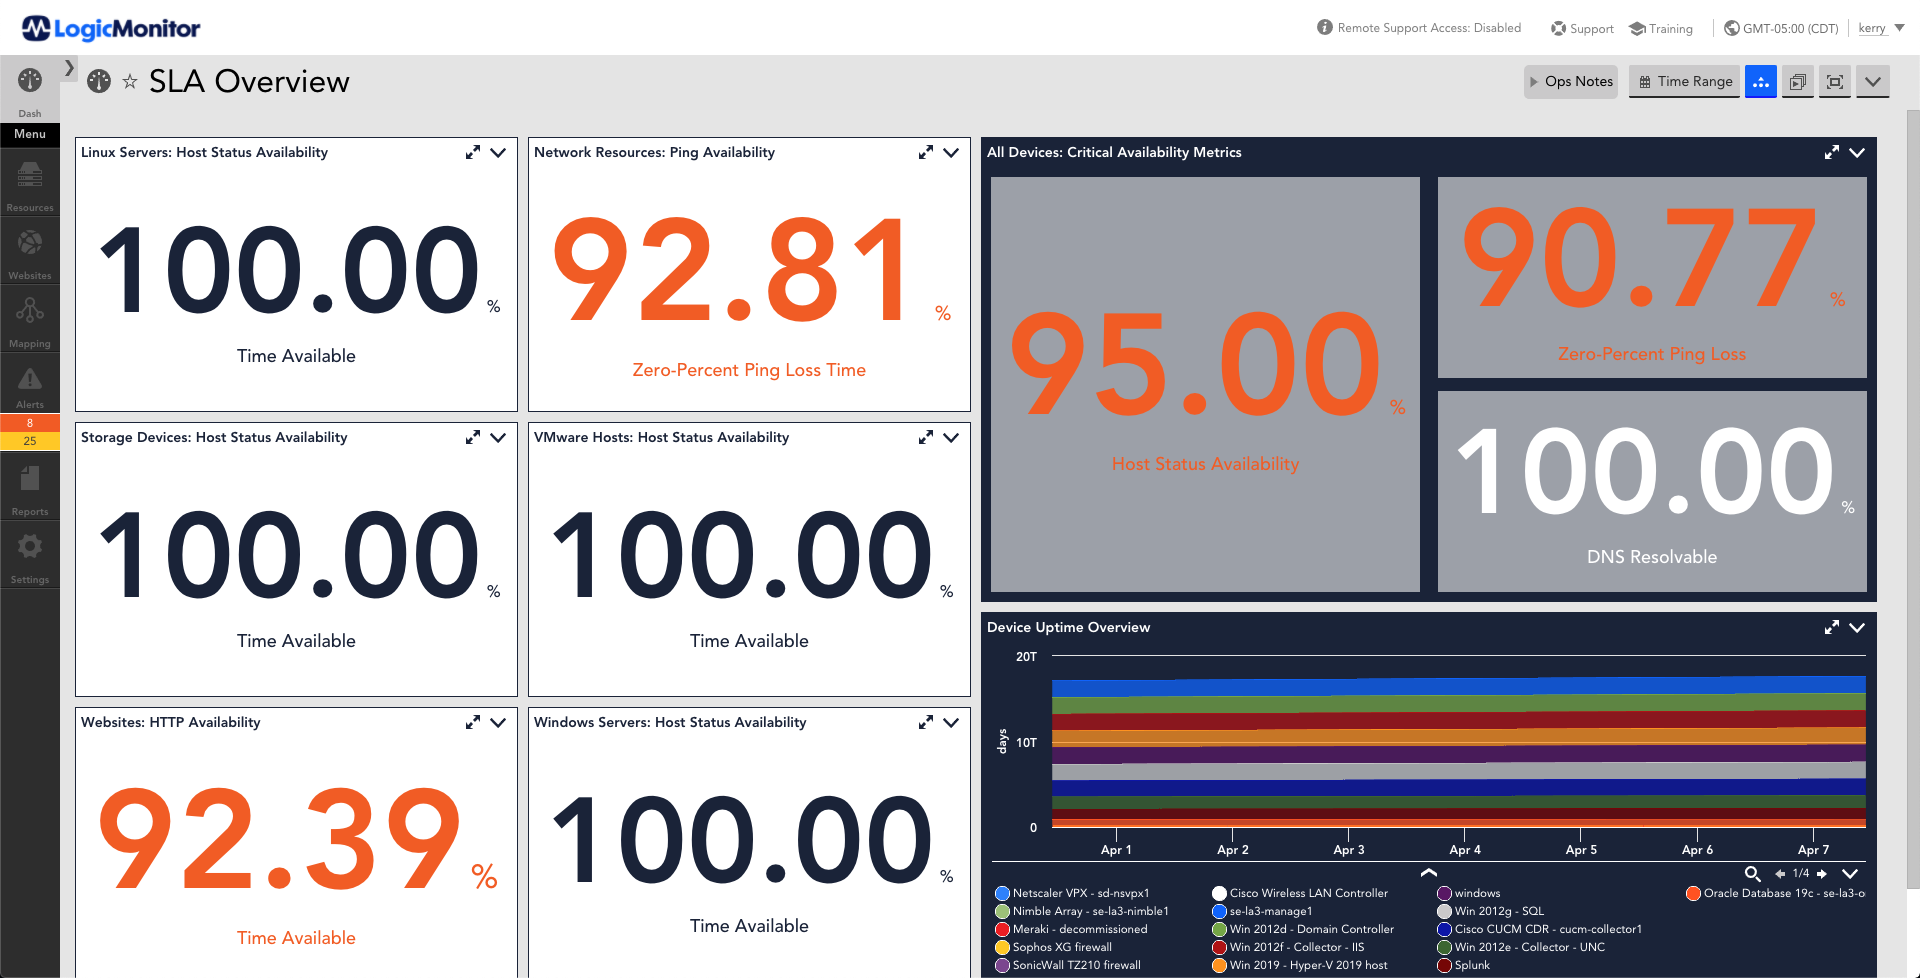
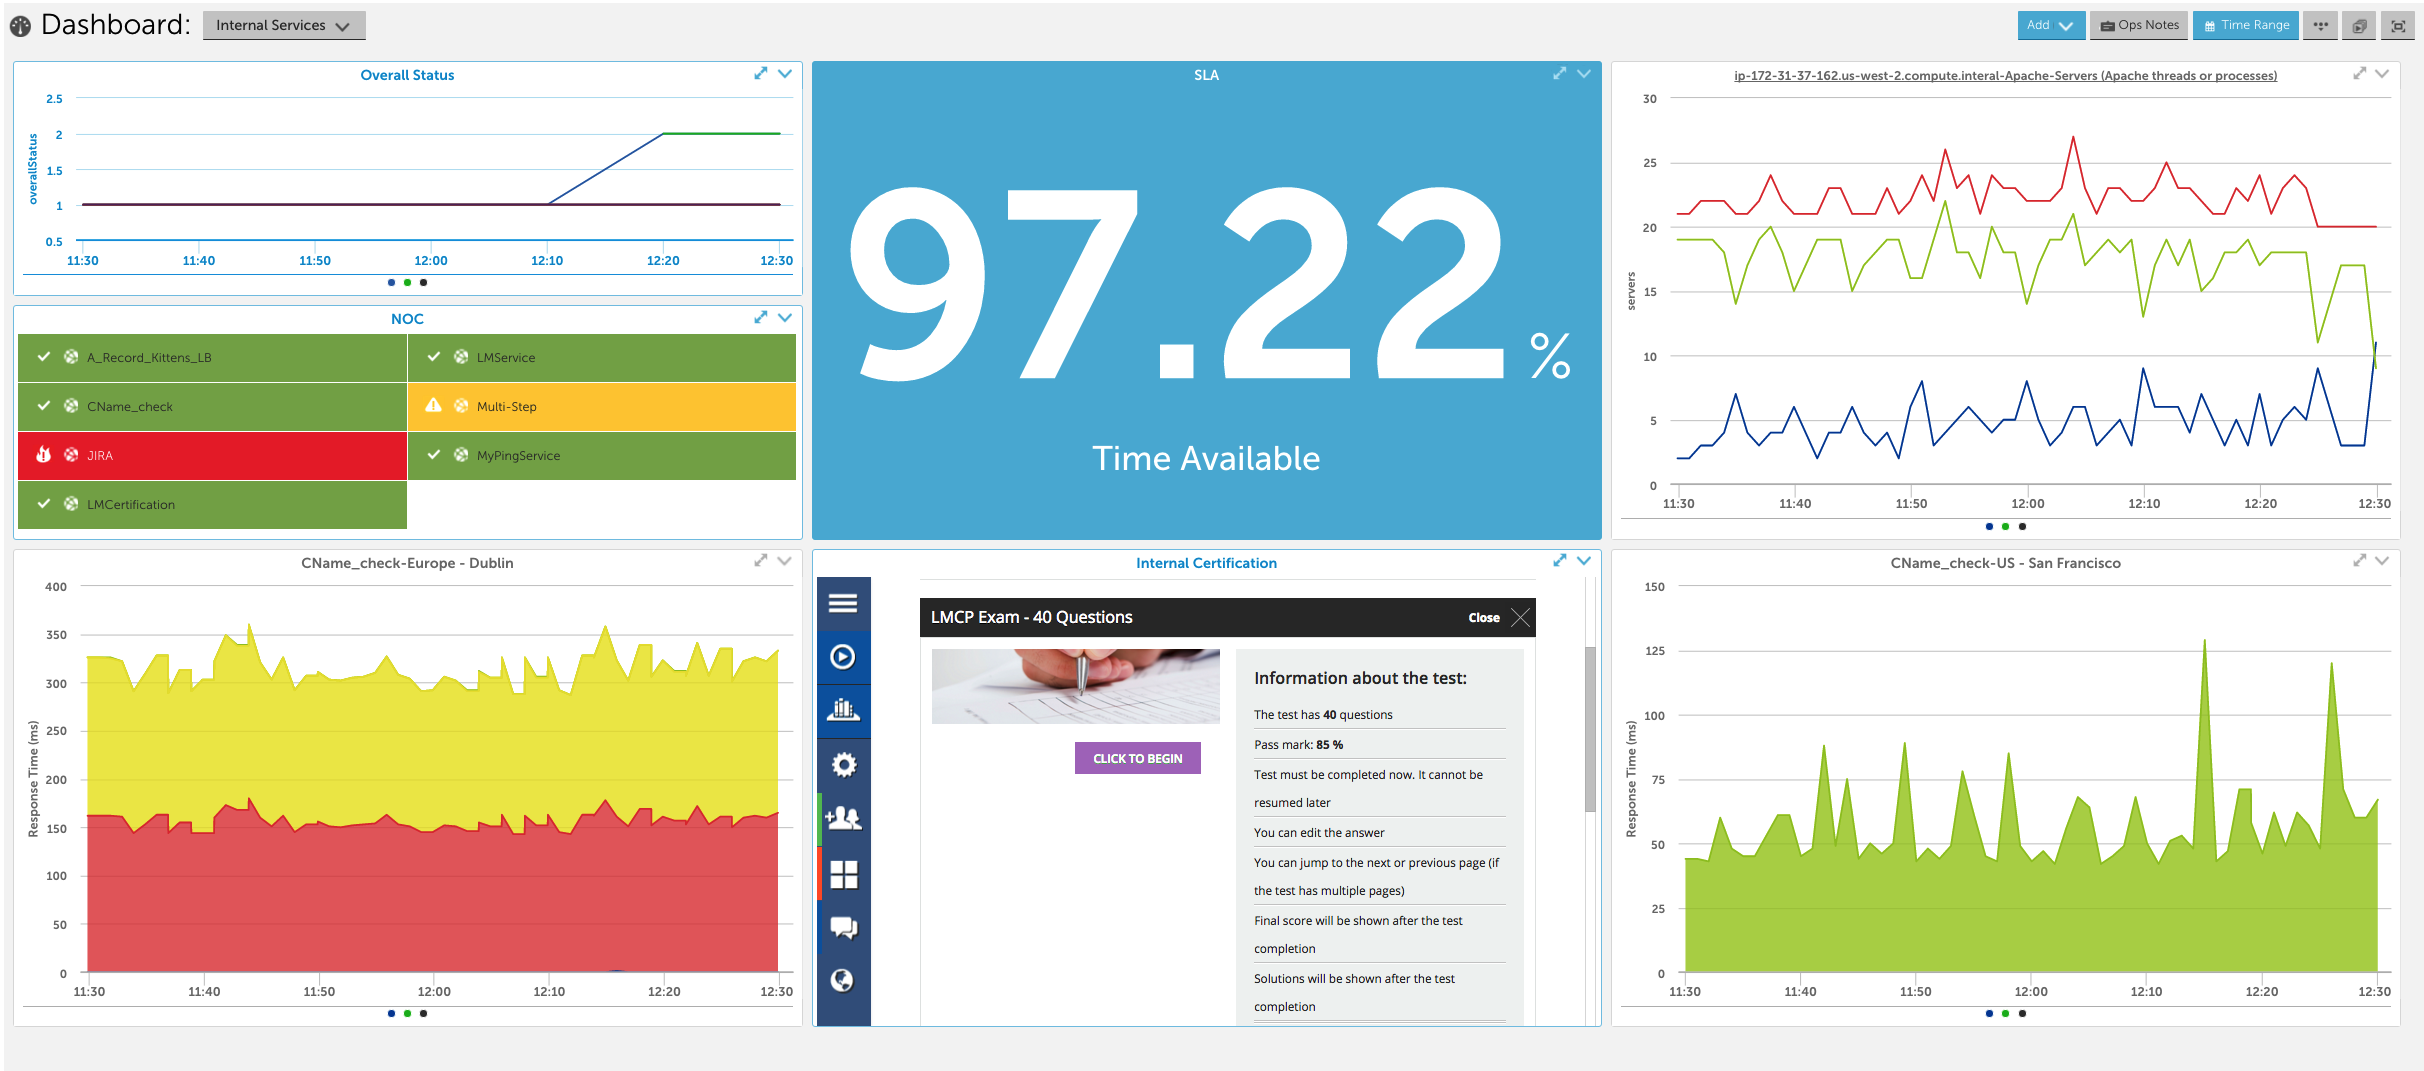
Gain full visibility for your modern enterprise with LogicMonitor’s powerful monitoring platform – from your IT infrastructure to the edge.

Logs
Metrics
Traces
LogicMonitor lets us predict issues and intervene before users are affected or need to report a problem themselves. The platform’s alerts and reports mean there are fewer outages.
KARL FRANKLIN, GLOBAL INFRASTRUCTURE MANAGER LUCY GROUP


Trusted by:


Secure by design
LogicMonitor’s platform is secure. The following are just some of thernways LogicMonitor ensures user and systems security:

Secure architecture
RBAC, 2FA, Encryption of data in transit and at rest

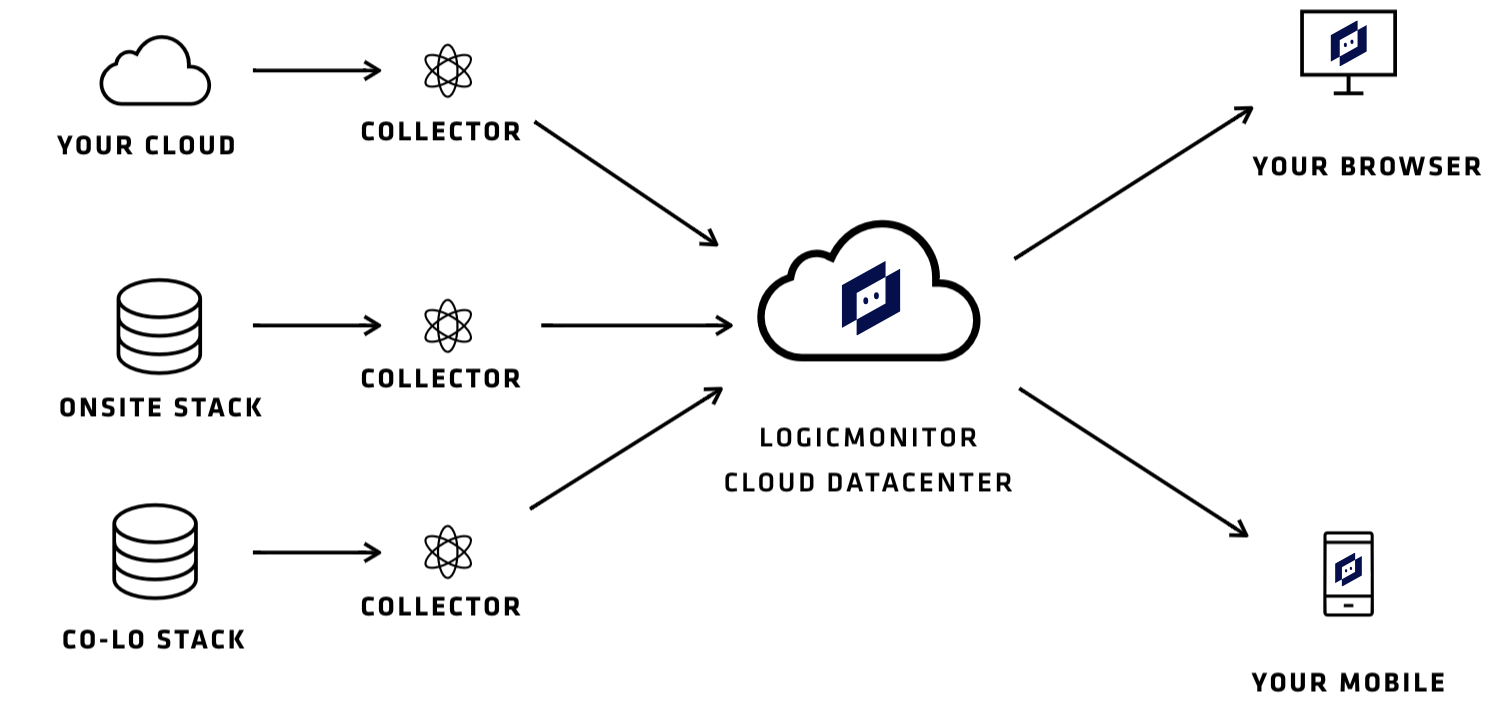
Secure data collection
Only outbound comms allowed from LM Collector, data encrypted with TLS, LM Collectors securely locked to your environment.

Secure operations
Collectors based on hardened Linux with perimeter and host-based IPS, operated out of top tier DCs and AWS regions, all with top security measures in place.

Secure practices
Minimal personal data stored, device access credentials stored in memory and never written to disk, salted one way hashes used in place of user passwords.

Secure standards
Constant penetration testing ensures maximum security, SOC2 validates our controls for security, high availability and confidentiality.
We have absolutely seen a return on investment with LogicMonitor. We have a very good, stable environment as a result of LogicMonitor, and the information that it provides us keeps us on top of our game, making sure that our environment is operating at peak capacity.
DAVID DIETZ, SYSTEMS ENGINEER IFM EFECTOR
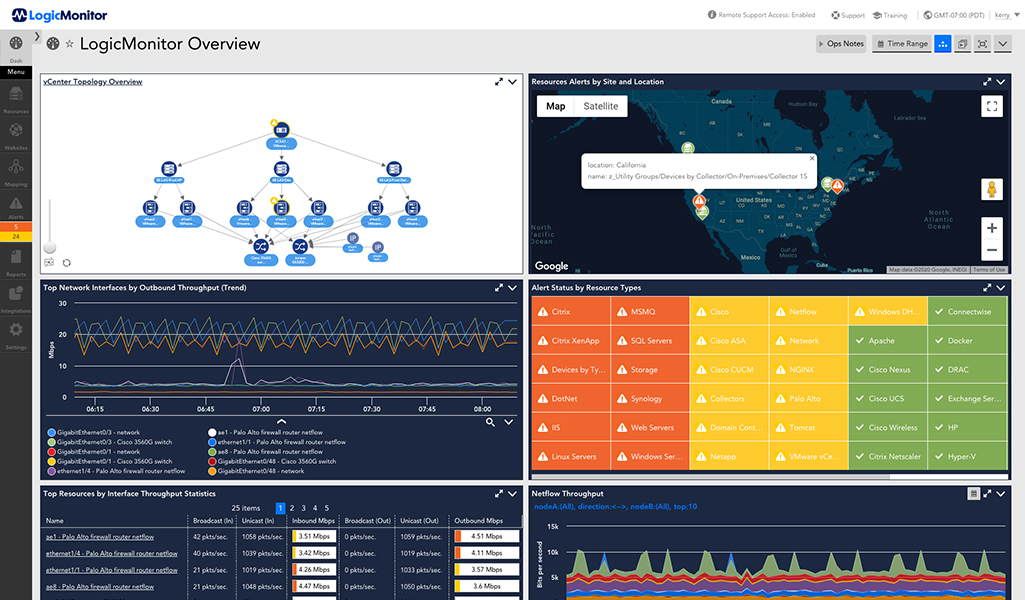
Single pane of glass for IT and OT
LogicMonitor marries visibility into your traditional and cloud workloads with your IOT and production systems to allow you to troubleshoot and optimize the system as a whole.
Extensive breadth of coverage across on-prem, cloud and containers
- 2,500+ integrations
- Rapid release cycle
- 350+ new or updated data sources released last year
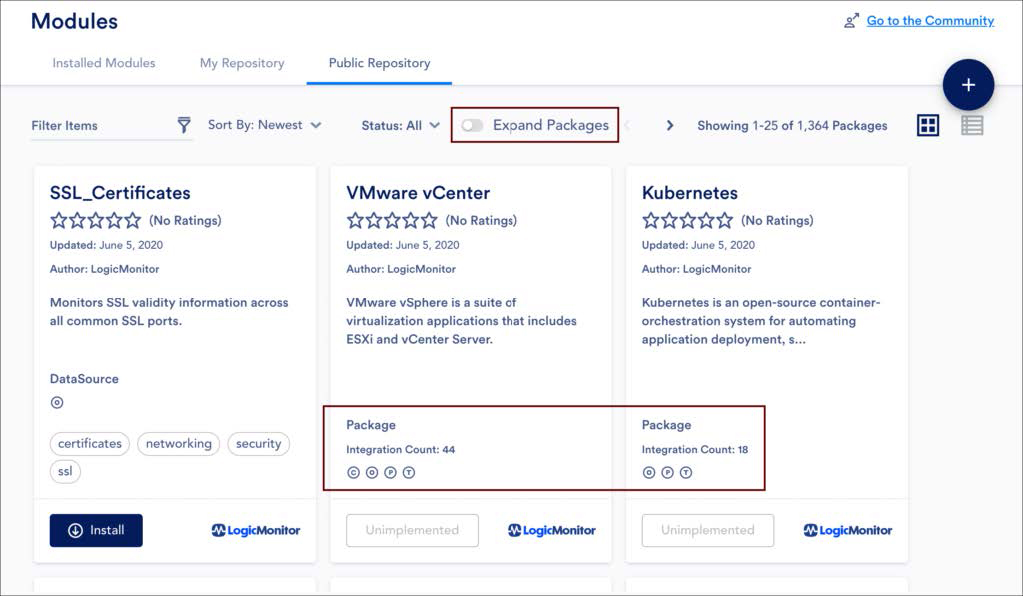
Simplified extensibility into IOT
- LM Exchange offers a library of integrations to bring you out-of-the-box monitoring for networking devices, applications, databases and services
- A centralized view of integrations available in LogicMonitor’s global repository
- Custom monitoring templates with rapid protyping capabilities
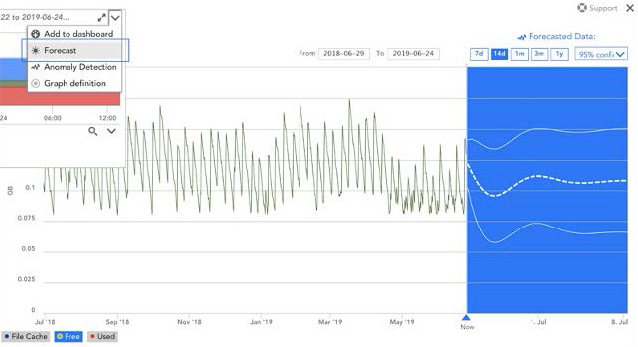
AIOps to forecast and identify anomalies
- Intelligently detect service-impacting signals from noise, making signals more actionable
- Ensure the right team members are informed via SMS, email, chat or ITSM integrations
- Identify the root cause of an outage and put an end to alert storms
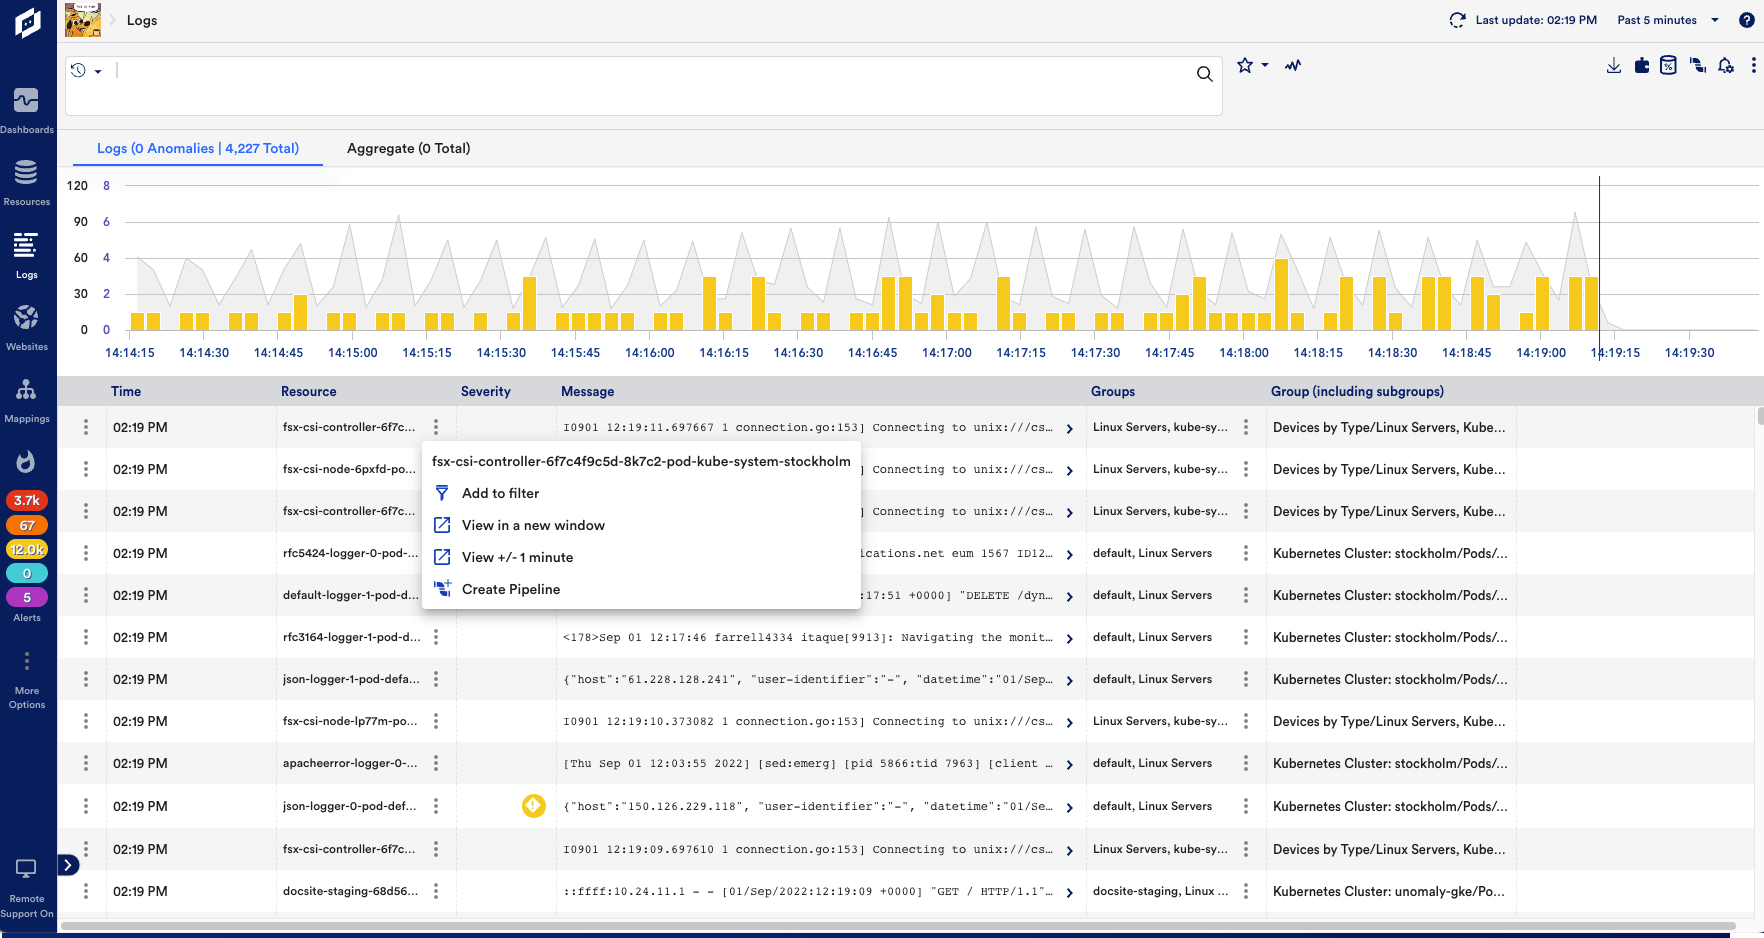
Centralized logs and metrics
- Connect log data to IT performance to meet and accelerate business objectives
- Free up to 40% of non-value adding engineering time with log-based anomaly detection
- Solve changing industry needs for control over context-rich log data across hybrid and multi-cloud environments
More Resources

accelerate growth / 02.13.24
How Hain Celestial Group Streamlined IT and Slashed Costs with LogicMonitor and AWS
Learn More
accelerate growth / 02.07.24
How Coca-Cola Bottling Consolidated have revolutionized their IT infrastructure
Learn More