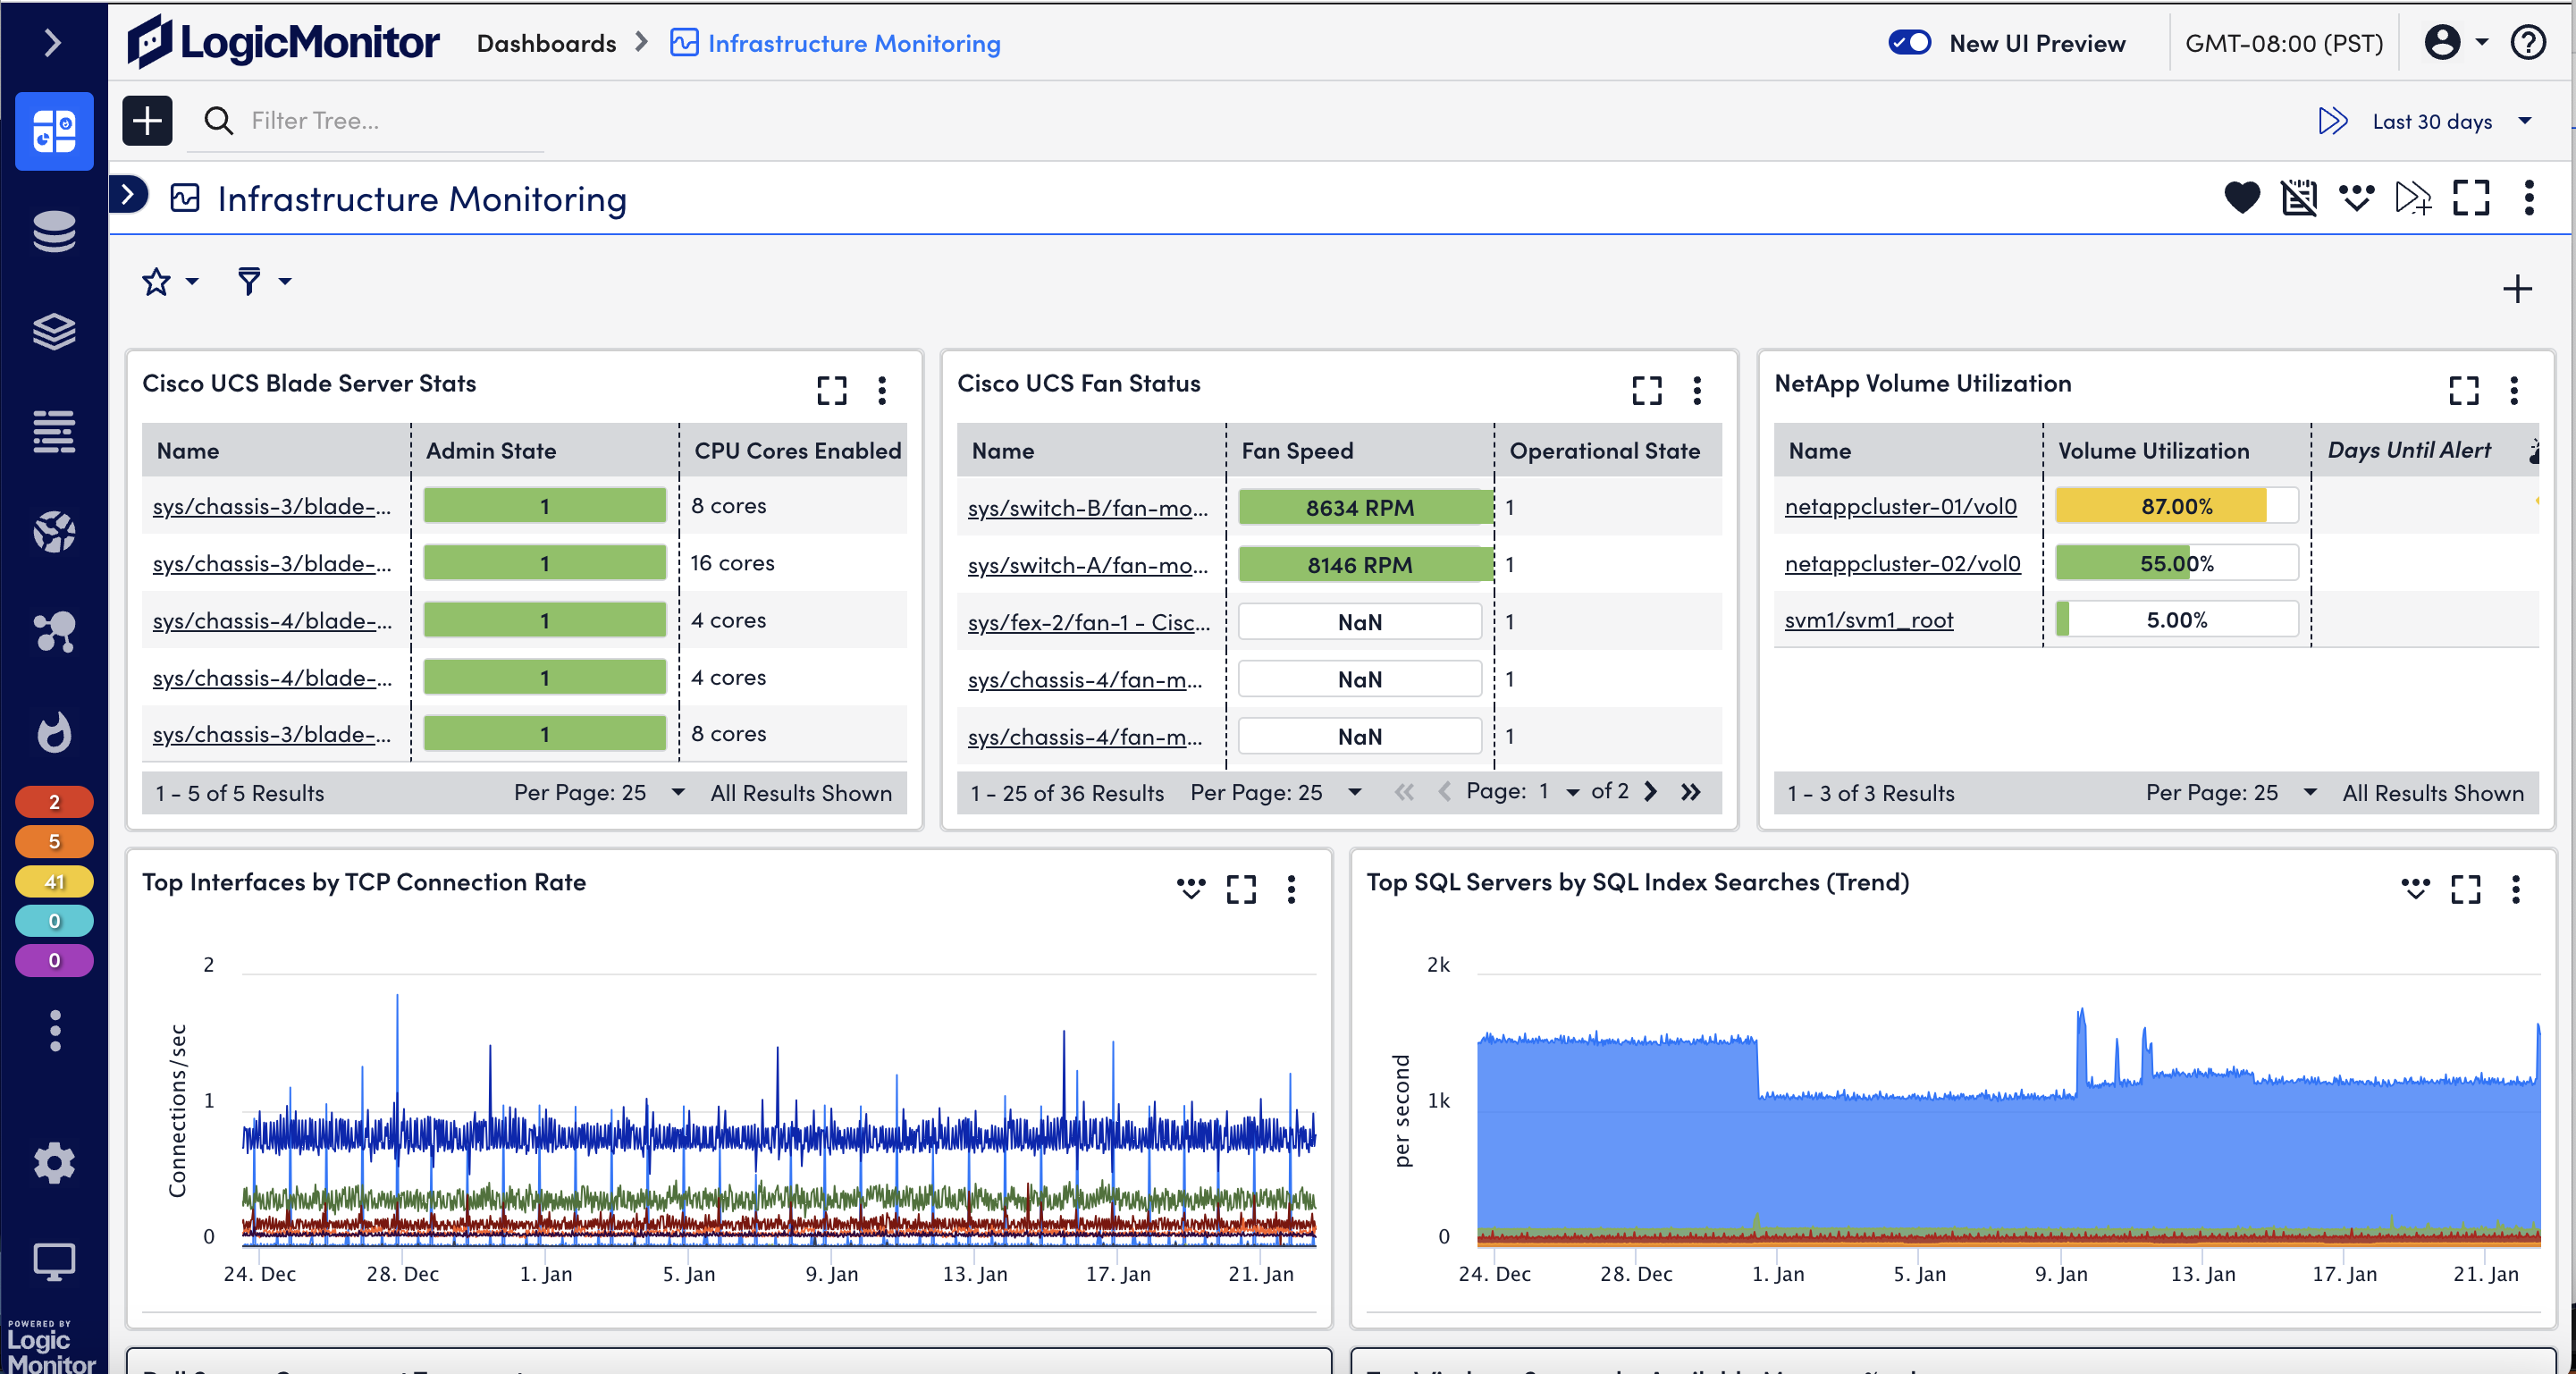
Modern monitoring at any scale

LogicMonitor pricing

LogicMonitor’s pricing is simple, predictable and connected to business value for modern monitoring at any scale. Extend visibility and availability across your hybrid and multi cloud environment with LogicMonitor.

Hybrid coverage

Comprehensive hybrid infrastructure monitoring that eliminates blind spots

Infrastructure monitoring

Experience predictive insights and intelligent troubleshooting

List price

$22

USD

Per resource/month*

  • Server
  • Virtual machine
  • SD-WAN
  • Storage
  • Network

Cloud IaaS monitoring

Gain more control and predictability over your cloud resources

List price

$22

USD

Per resource/month*

  • AWS EC2
  • Azure VM
  • Azure Scale Sets VM
  • GCP Compute Engine

Wireless Access Points

Monitor and alert on vital wireless health and performance metrics

List price

$4

USD

Per resource/month*

  • Juniper Mist
  • Cisco Meraki
  • Cisco Catalyst Center
  • Cisco Meraki Smart Cameras (Meraki MV Series)
  • Cisco Meraki Environmental Sensors (MT Series)

Cloud PaaS & container monitoring

See cloud provider metrics for compute-based workloads alongside your hybrid environment

List price

$3

USD

Per resource/month*

  • AWS
  • Azure
  • GCP
  • Kubernetes
  • MongoDB Atlas Databases
  • Docker

Layered AI

Troubleshoot faster with AI-powered anomaly detection, log analysis and event correlation

Log intelligence

Powerful insights and context alongside infrastructure metrics for rapid troubleshooting

List price

$4

USD

Per GB/month for 30 day retention*

$7

USD

Per GB/month for yearly retention*

$14

USD

Per GB/month for unlimited retention*

Dexda event correlation

Put AI to work and supercharge productivity with AIOps personalized to your business’s unique needs

List price

$120

USD

Per 1000 events per month*

  • Actionable insights
  • Auto tags and summarization
  • Natural language processing
  • Adaptive correlation

*Billed annually. U.S. prices only. Prices shown are list prices as of February 2024. Volume discounts are available across all our products

CONTACT SALES

Additional products

Including capabilities like synthetic monitoring, traces, and SaaS monitoring

Synthetic monitoring

Record automated browser tests, upload multi-step synthetic transactions of critical user workflows, and run at set intervals.

Application
traces

Collect, visualize, and analyze OpenTelemetry-based application data

SaaS monitoring

Monitor commonly used workforce productivity services such as Salesforce, Zoom, Slack, and more

Award winning customer service

Professional services

Maximize time-to-value with custom LM Professional Services engagement

Customer
training

Get the most out of LogicMonitor with group or private training sessions

Frequently asked questions

Can I try LogicMonitor before I buy?

Yes, customers can take advantage of a free trial before committing to buy.

Are volume discounts available?

Yes, volume discounts are available. Please contact sales!

What happens if a customer exceeds their committed entitlement quota?

Customers who exceed their committed entitlement are charged 1.5x their contracted price.

What is an infrastructure resource for billing purposes?

Resources are the components that make up your on-premises infrastructure, such as servers (physical or virtual), storage, and networks. In the LogicMonitor platform, each resource is represented by a single management IP address (or by DNS name). Your resources can be in multiple physical locations as well as in the cloud.

What is a cloud resource for billing purposes?

LogicMonitor makes cloud pricing easier and more predictable by counting only compute resources.

For billing purposes, LogicMonitor counts the compute-driven portions of your workloads. Compute resources are most likely to be known and intentionally deployed. These include IaaS units such as AWS EC2 instances, Azure VM, Azure ScaleSet VM, and GCP Compute Engine. The cloud IaaS unit includes monitoring for up to 10 non-compute cloud services, such as storage, network, firewall, load balancing services and more.

Supporting non-compute resources are more difficult to predict, which is why they are included in the compute license.

PaaS compute services will be counted for billing purposes. These include common CSP services such as ECS Cluster, AWS Lambda, Azure Virtual Desktop, GCP App Engine, Kubernetes Pods, and more.

A full list of cloud resources and billing designations can be found here.

Can customers add additional cloud monitoring coverage as their business scales?

Yes. Monitoring coverage for 10 cloud non-compute IaaS services is included with the purchase of each Cloud IaaS unit. To monitor an additional block of up to 10 non-compute services, you would purchase an additional Cloud IaaS unit.

Can customers monitor more than one cloud provider simultaneously at LogicMonitor?

Companies often use multi cloud environments to distribute computing resources and minimize the risk of downtime and data loss. The LogicMonitor platform applies a comprehensive monitoring strategy to overall cloud performance. It gives users real-time, data-driven insight into every potentially impactful component of their cloud deployment through three fundamental elements: cloud provider monitoring, resource performance monitoring, and detailed ROI analysis.

What cloud providers does LogicMonitor monitor?

The LogicMonitor platform’s three-component strategy (resource monitoring, cloud provider availability monitoring, and ROI monitoring) does not depend on the cloud provider. Currently, supported cloud services include Amazon Web Services, Microsoft Azure, and Google Cloud Platform. Additionally, LogicMonitor’s SaaS Monitoring feature offers in-depth monitoring of SaaS apps such as Office 365, Salesforce, Zoom, Slack, and more.

What is a SaaS resource for billing purposes?

SaaS monitoring coverage scales with the size of your company and is based on the number of users for a given SaaS service. For example, Microsoft Office 365 monitoring coverage is billed based on the number of M365 users in a business. Pricing is based per-user, per year.

APM traces are measured in spans. What is a span?

A span refers to an individual, transactional unit of work completed with a system with a start and end time. These can include functions, database calls, start-up scripts, etc. Multiple spans with parent-child relationships are linked together to constitute a trace.

APM synthetics are measured in invocations. What is a synthetic invocation?

A synthetic invocation refers to an individual execution of a selenium-scripted synthetic test. Users can create and upload their synthetic test and set a specific polling interval. Synthetic tests may be run simultaneously from multiple locations and/or browsers, creating additional invocations.

What counts toward the Cloud PaaS SKU?

The LM Cloud PaaS SKU is a part of LogicMonitor’s cloud monitoring solution. LM Cloud enables deeper visibility into cloud workloads through auto-discovery, pre-configured metrics collection, out-of-the-box alert thresholds and dashboards, and other enterprise-ready platform features like RBAC, alert routing, etc. With the PaaS SKU, you get cloud provider metrics with the above benefits for your PaaS cloud workloads alongside the rest of your monitored environment in LogicMonitor. Cloud PaaS resources include:

  • AWS
    • ECS Cluster
    • Lambda
    • AppStream
    • Cloudsearch
    • DocumentDB
    • ElastiCache
    • Glue
    • MSK (Brokers)
    • MQ
    • OpenSearch (FKA ElasticSearch)
    • Redshift
    • RDS
  • Azure
    • App Service
    • Analysis Services
    • Data Factory
    • HDInsight
    • Function
    • MariaDB Database Server
    • MySQL Database Server
    • MySQL Database Flexible Server
    • PostgreSQL Database Server
    • PostgreSQL Database Flexible Server
    • Redis Cache
    • SQL Managed Instances
    • Virtual Desktop
  • GCP
    • App Engine
    • Cloud Composer
    • Cloud Dataflow
    • Cloud Dataproc
    • Cloud Function
    • Cloud Redis
    • Cloud Run
    • Cloud SQL
  • Other
    • Kubernetes Pods
    • MongoDB Atlas Databases

What counts toward the Cloud IaaS SKU?

The LM Cloud IaaS SKU is part of LogicMonitor’s cloud monitoring solution. LM Cloud enables deeper visibility into cloud workloads through auto-discovery, pre-configured metrics collection, out-of-the-box alert thresholds and dashboards, and other enterprise-ready platform features like RBAC, alert routing, etc. With the IaaS SKU, you can monitor cloud workloads with an LM local collector and get visibility beyond what is available from the cloud providers (e.g. OS and application level metrics).

Cloud IaaS resources include all supported cloud VMs (AWS EC2, Azure VM, Azure ScaleSetVM, GCP Compute Engine instances), and any other cloud resources monitored via an LM local collector. With each IaaS SKU unit purchased, you are additionally entitled to 10 monitored PaaS non-billable resources.