Aruba Networks
Monitoring Aruba wireless controllers has never been faster, more automated and as effortless as it is with LogicMonitor.
You’ll get immediate graphing, alerting and data for the entire Aruba product series with LogicMonitor’s ActiveDiscovery process. LogicMonitor has default configurations for graphing and alerts to make your job easier. Out of the box you’ll be able to access data on all of the following, and more:
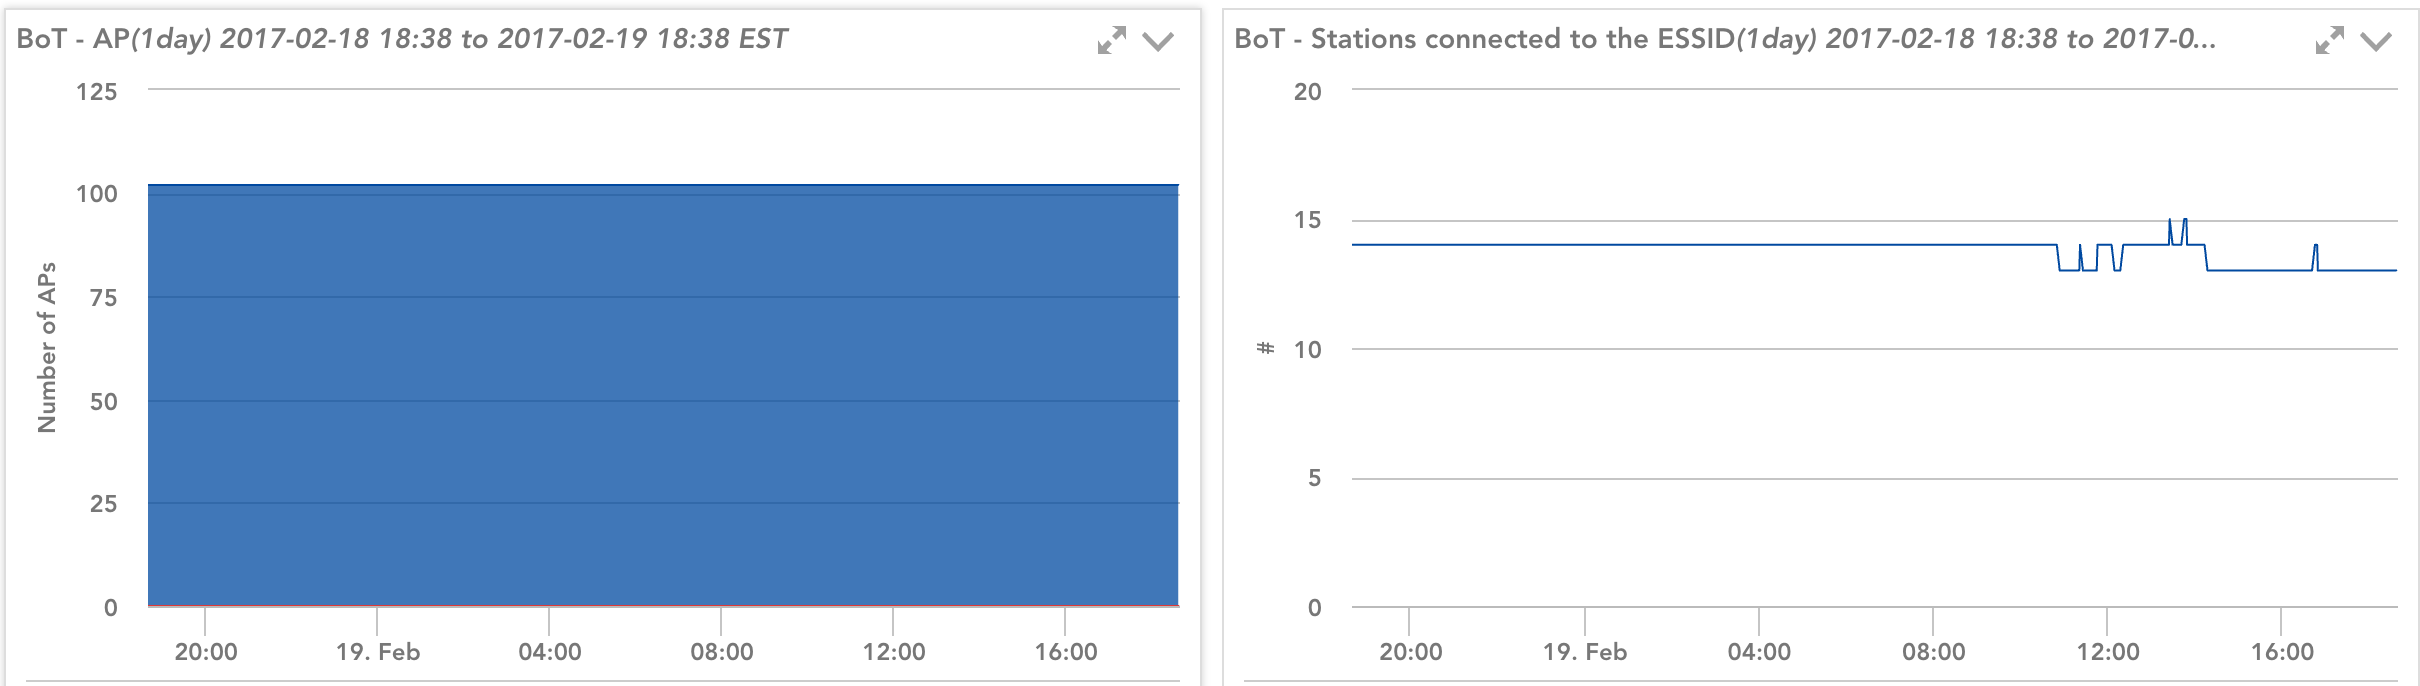
- Total Access Points in use
- Number of concurrent users
- Spike activity
- Speed of each Access Point
- Device temperature
- User type
- Access points per switch
- Uptime
- Total user count
- User count per AP
ActiveDiscovery will add or remove Access Points from monitoring as you update your infrastructure, automatically.

AccessPoint Radio utilization
Get detailed information about AP utilization over time, and view the top 10 managed access points to stay ahead of hot spot congestion
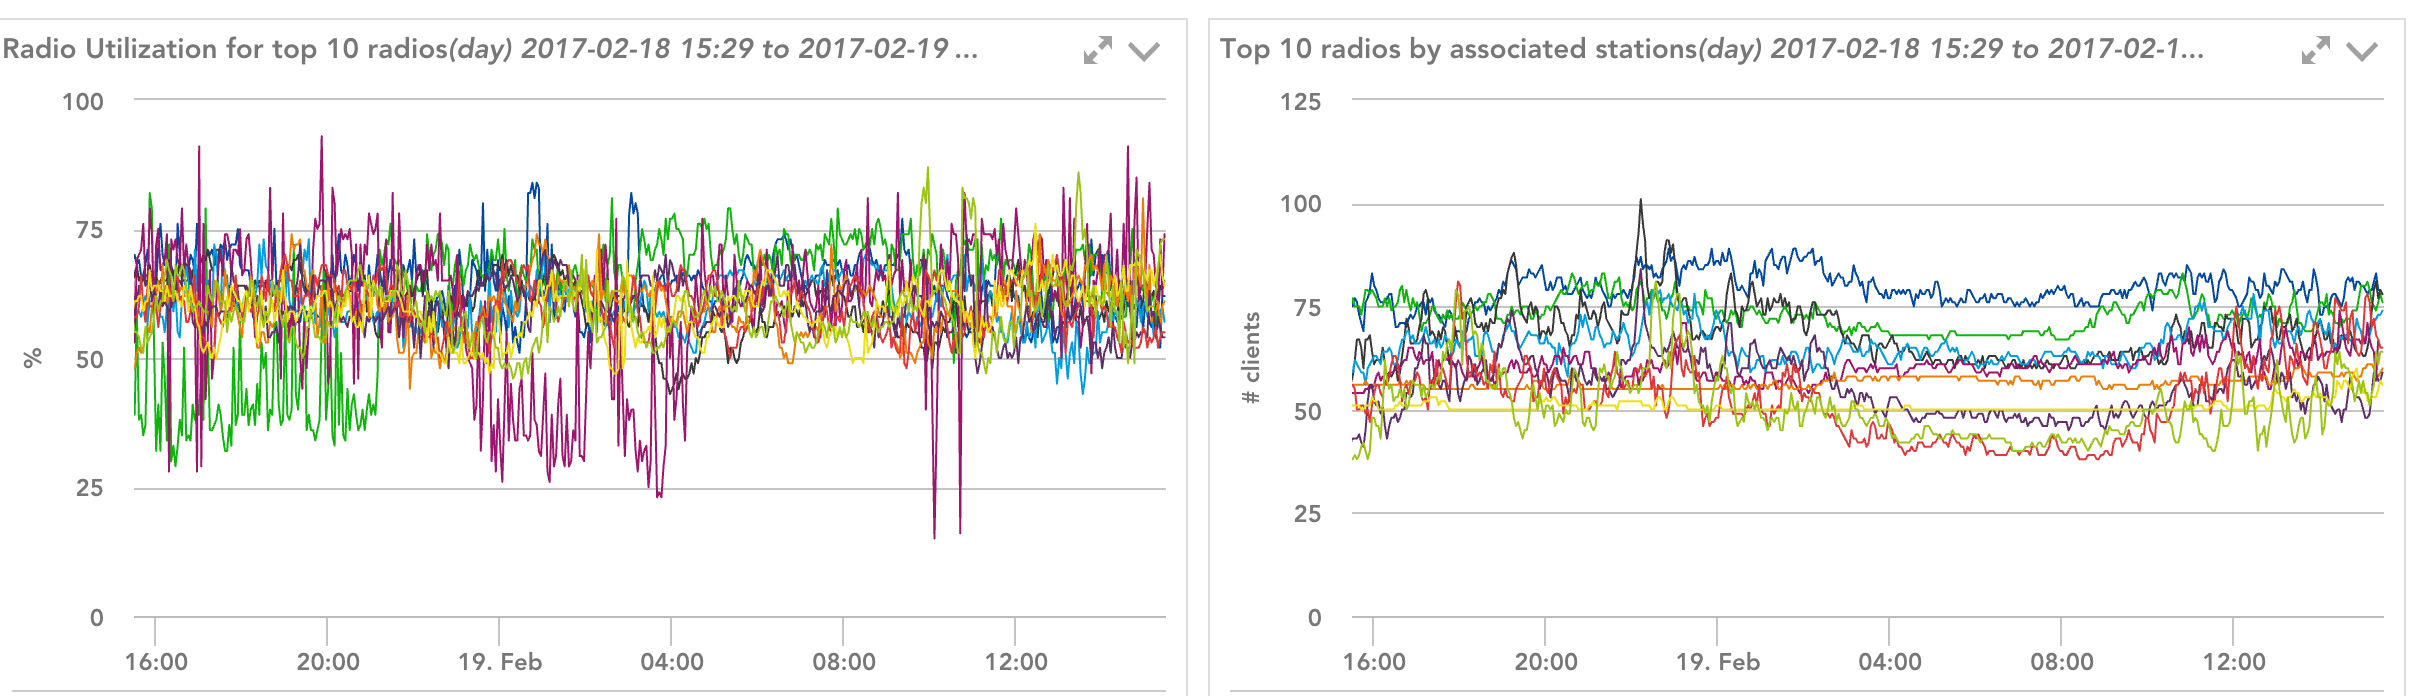
ESSID utilization
Automatically discover all ESSIDs, and get detailed information about associated access points and stations
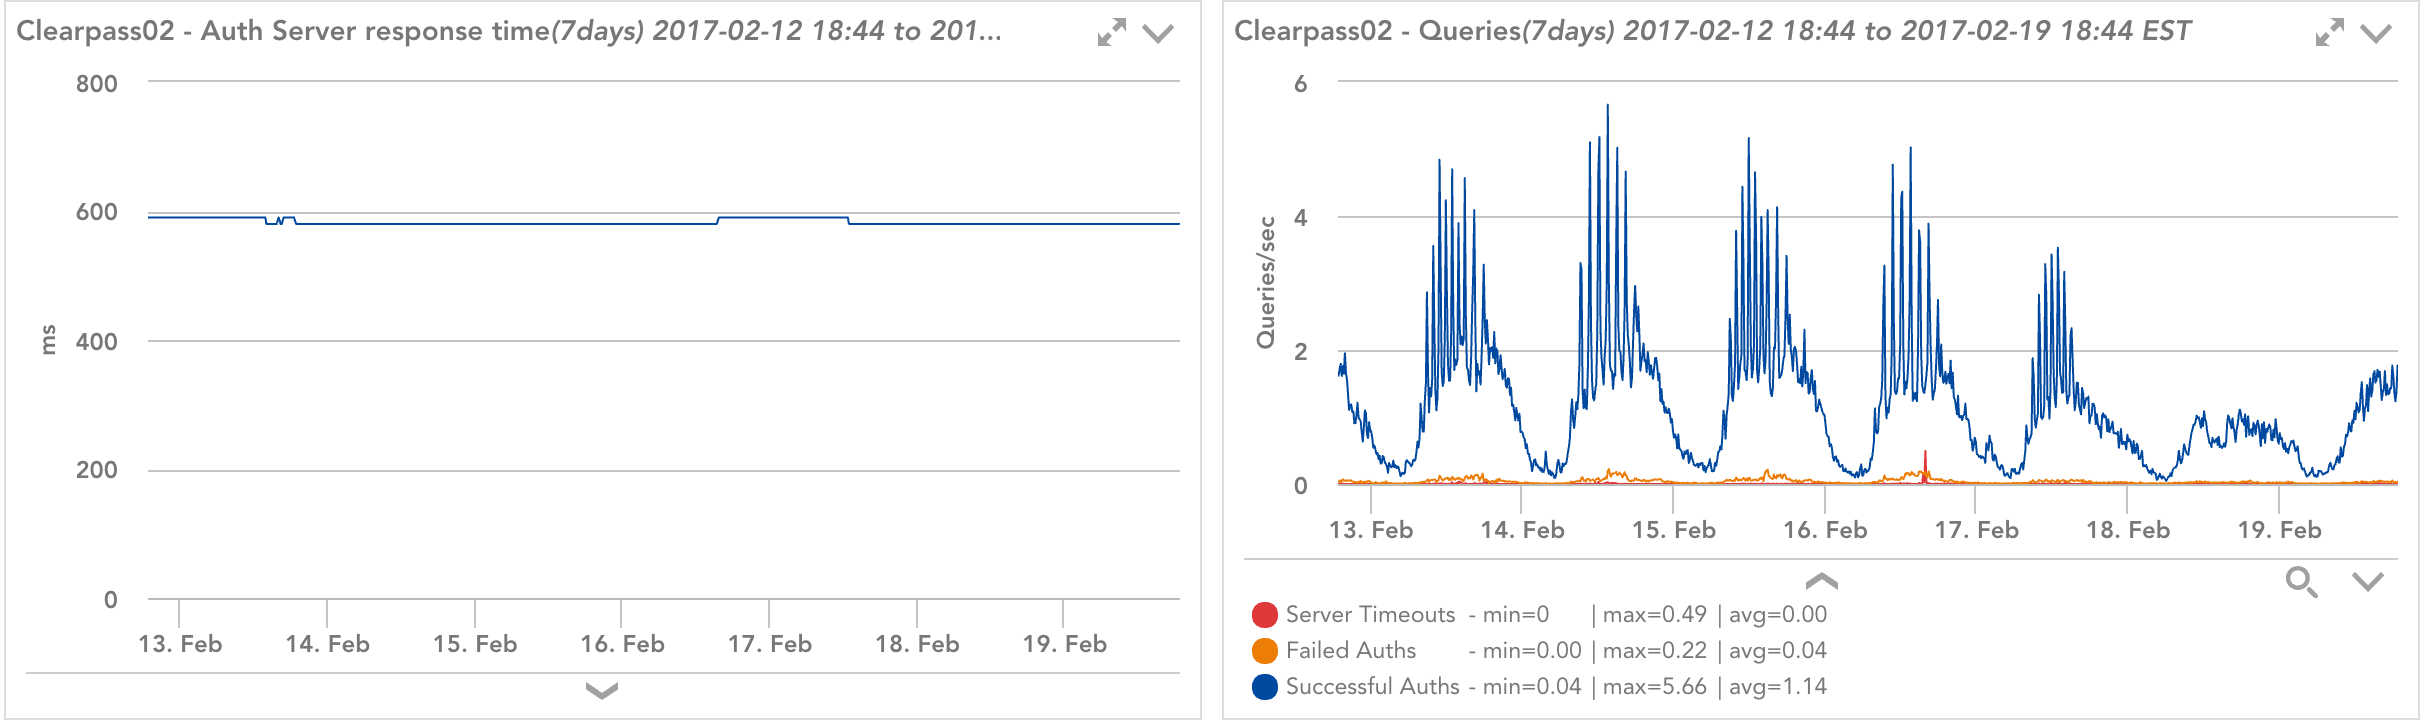
Aruba authentication server monitoring
Automatically discover all authentication servers, and trend response time and query activity
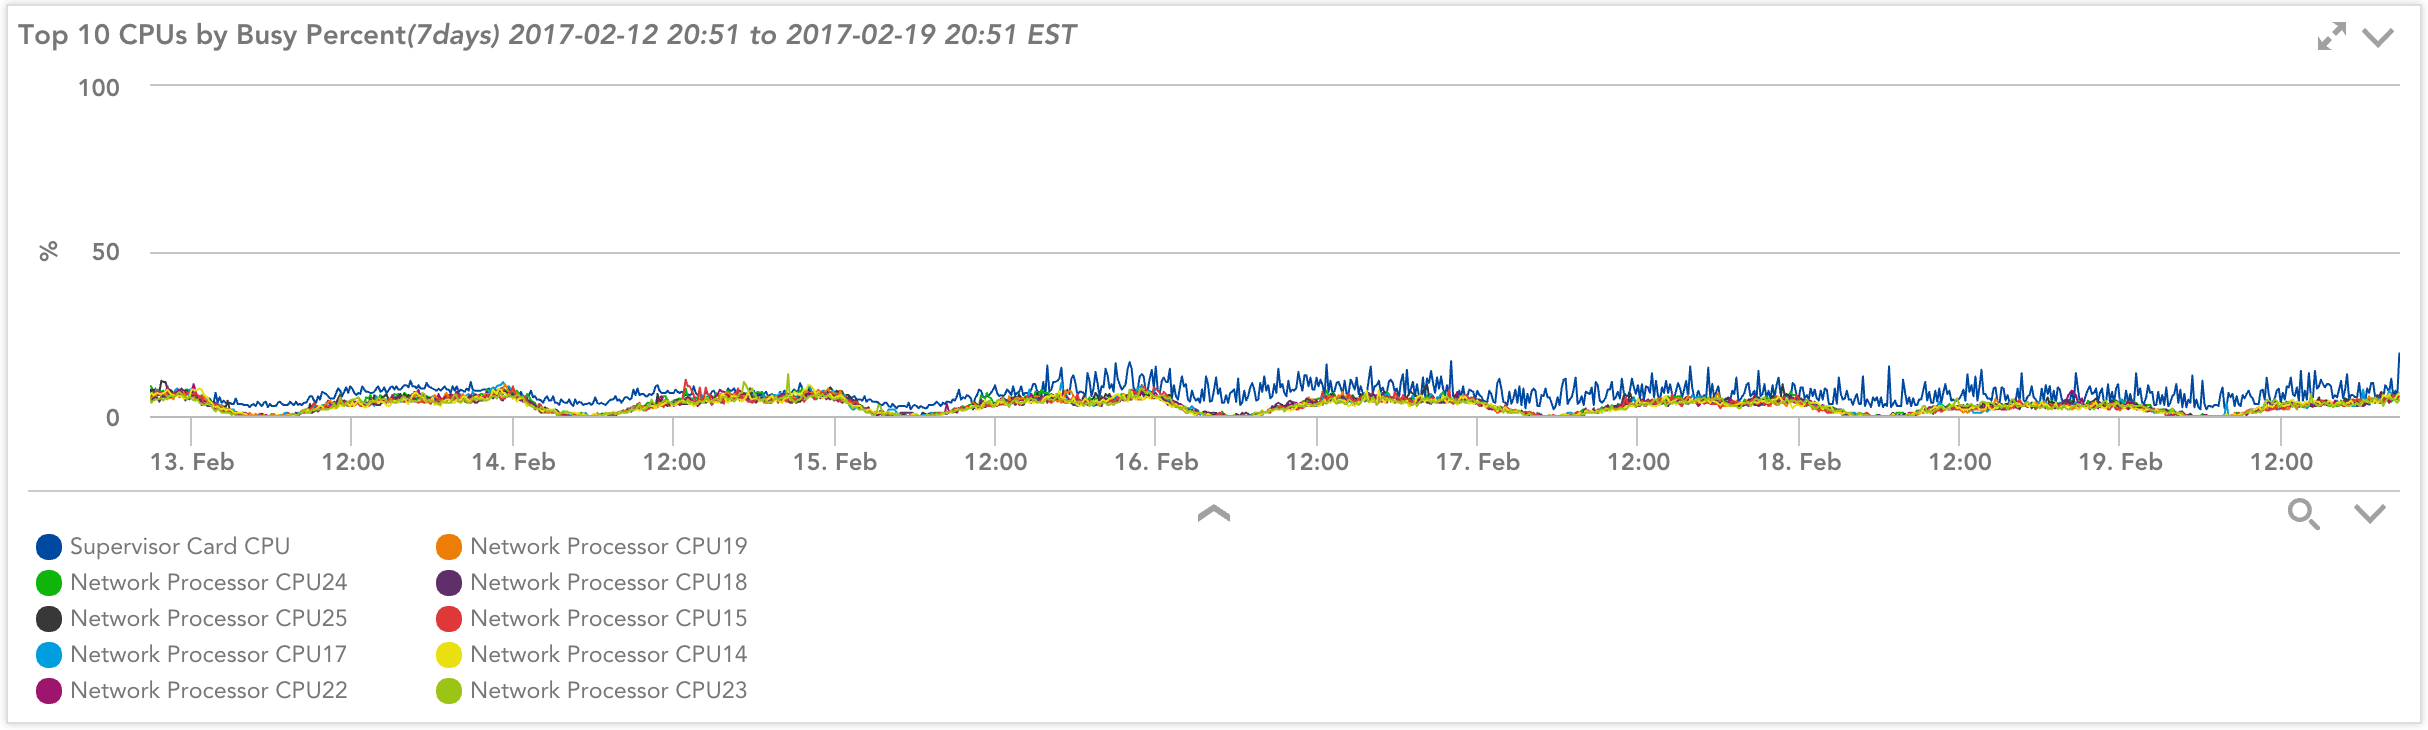
Aruba CPU, memory, and hardware health monitoring
Monitor the health of all your Aruba infrastructure – from all the CPUs, to fans, memory, flash storage and power supplies, getting proactive alerts in event of issues.