Nimble
If you need to ensure all your storage systems are working at their peak – you need LogicMonitor.
Simply tell LogicMonitor to monitor your Nimble cluster, and LogicMonitor will do the rest. LogicMonitor will automatically detect and monitor all:
- Members of the array group
- Hard disks and SSDs
- Volume latency
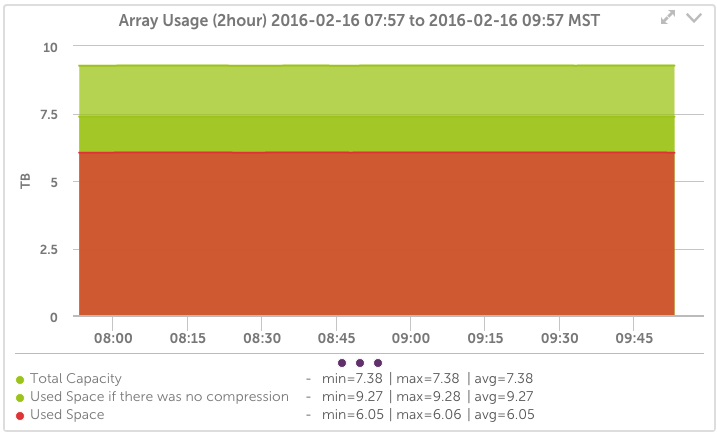
- Volume Usage and connections
- Snapshot usage and compression space saved
- and more
with best practices alerts and thresholds pre-defined. You’ll get graphical trends of performance going back for a year, and alerts informing you of issues that need your attention. Automatically.
Just a few of the critical Nimble metrics we monitor:
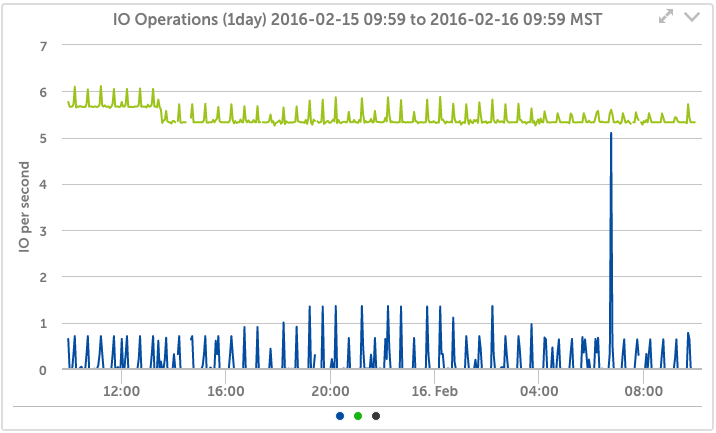
Nimble Cluster Metrics
Track the array health, throughput, CPU load, Operations, and more – automatically. You’ll know when you are reaching the limits of CPU or disk performance, and how much throughput you are getting from your cluster.
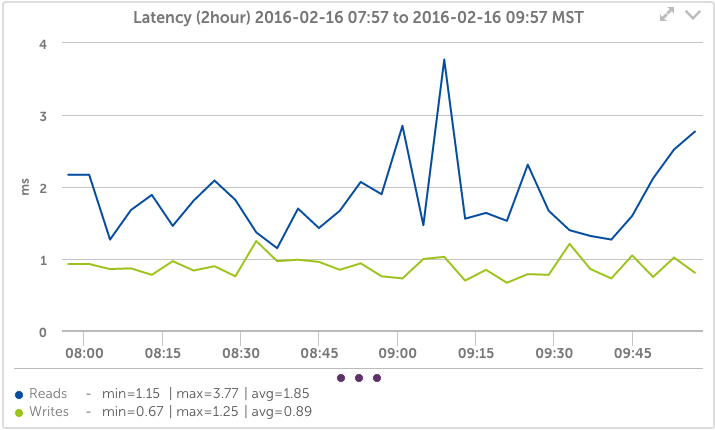
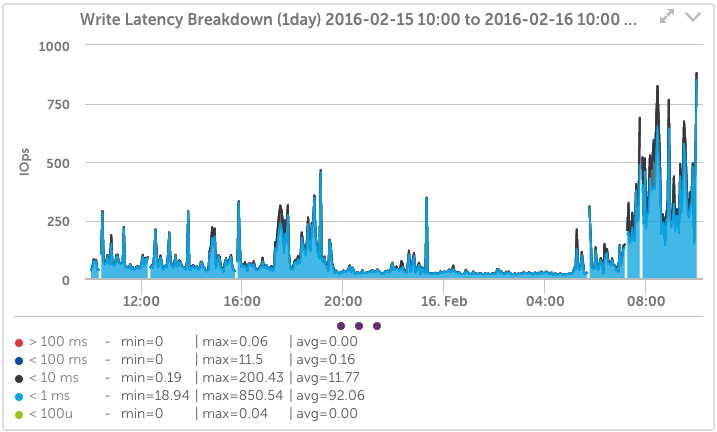
Nimble Volume Latency
Automatically detect each volume, and easily see the latency, IOps, and latency breakdown; trend the usage over time for the last year – while zooming in to any period for more detail.
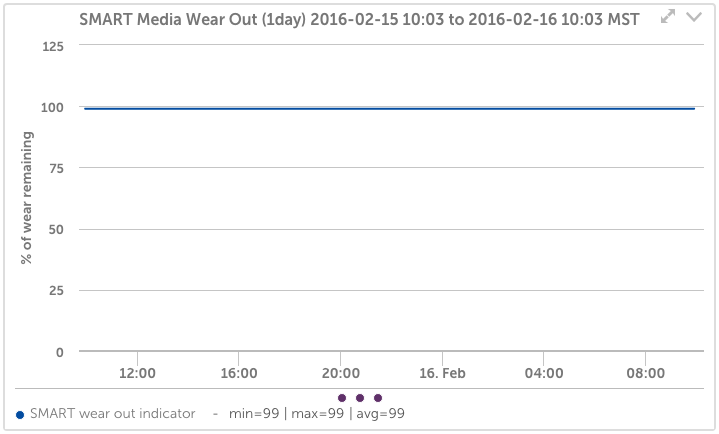
Nimble Health Monitoring
Automatically monitor all drives for SMART errors, failures, and media wear indicator (for SSD drives). Escalate alerts to the right people, at the right time, to ensure your systems are up.