WatchGuard
With LogicMonitor’s automated monitoring of WatchGuard firewalls, monitoring becomes simple. Add your firewall’s hostname or IP address, and you’re done. Or, if you wish, you can also have LogicMonitor scan, detect and add your firewalls automatically. LogicMonitor’s ActiveDiscovery will identify the device as a WatchGuard firewall and apply the appropriate monitoring.

LogicMonitor’s ActiveDiscovery will find and monitor:
- CPU, memory, sessions and failures
- All VPN tunnels, and the throughput, packets on each
- Overview graphs showing the performance of every tunnel on one graph, speeding troubleshooting
- Per policy traffic, tracking sessions, bytes and packets for each rule
- Total Connections in Use
- All physical interfaces on the firewall, and their throughput, packets and errors, as well as subinterfaces and flow statistics
- Uptime
You will immediately have appropriate alerts defined- all with no configuration required.
Just a few of the critical WatchGuard metrics we monitor:
WatchGuard VPN Usage
LogicMonitor automatically detects each VPN tunnel and graphs the throughput and packets for each one. If you add or remove tunnels, ActiveDiscovery detects this and adjusts monitoring for you.
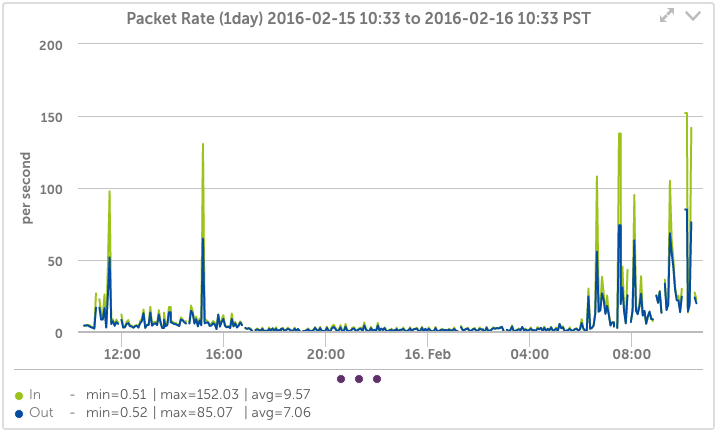
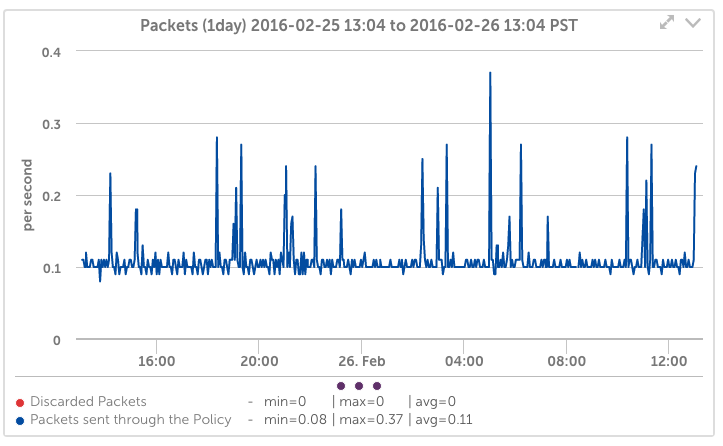
WatchGuard Policy/Rule Usage
LogicMonitor detects each configured rule automatically and graphs the throughput and packets that each rule forwards. If you add or remove rules, ActiveDiscovery detects this and adjusts monitoring for you.
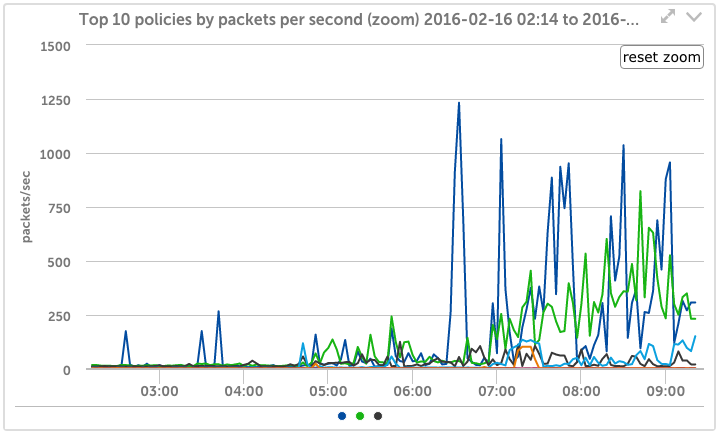
WatchGuard Rule Overviews
If you do find your firewall being overloaded, or under unusual load – LogicMonitor’s automatic top 10 graphs make troubleshooting a breeze, instantly highlighting unusual traffic flows.