The quick download
Telemetry is the automated collection and transmission of data like metrics, events, logs, and traces from a system to a remote location for monitoring and analysis.
-
Telemetry is the raw data layer; monitoring checks it against known thresholds, and observability lets teams investigate what they didn’t already know to look for.
-
Telemetry data is commonly organized using the MELT framework (metrics, events, logs, traces) and by source, including user, network, application, and cloud telemetry.
-
The biggest implementation challenges are privacy, data volume, format consistency across tools, latency, and data integrity.
-
LogicMonitor unifies telemetry across infrastructure, cloud, and the Internet into a single platform, using Edwin AI to correlate signals and guide the response.
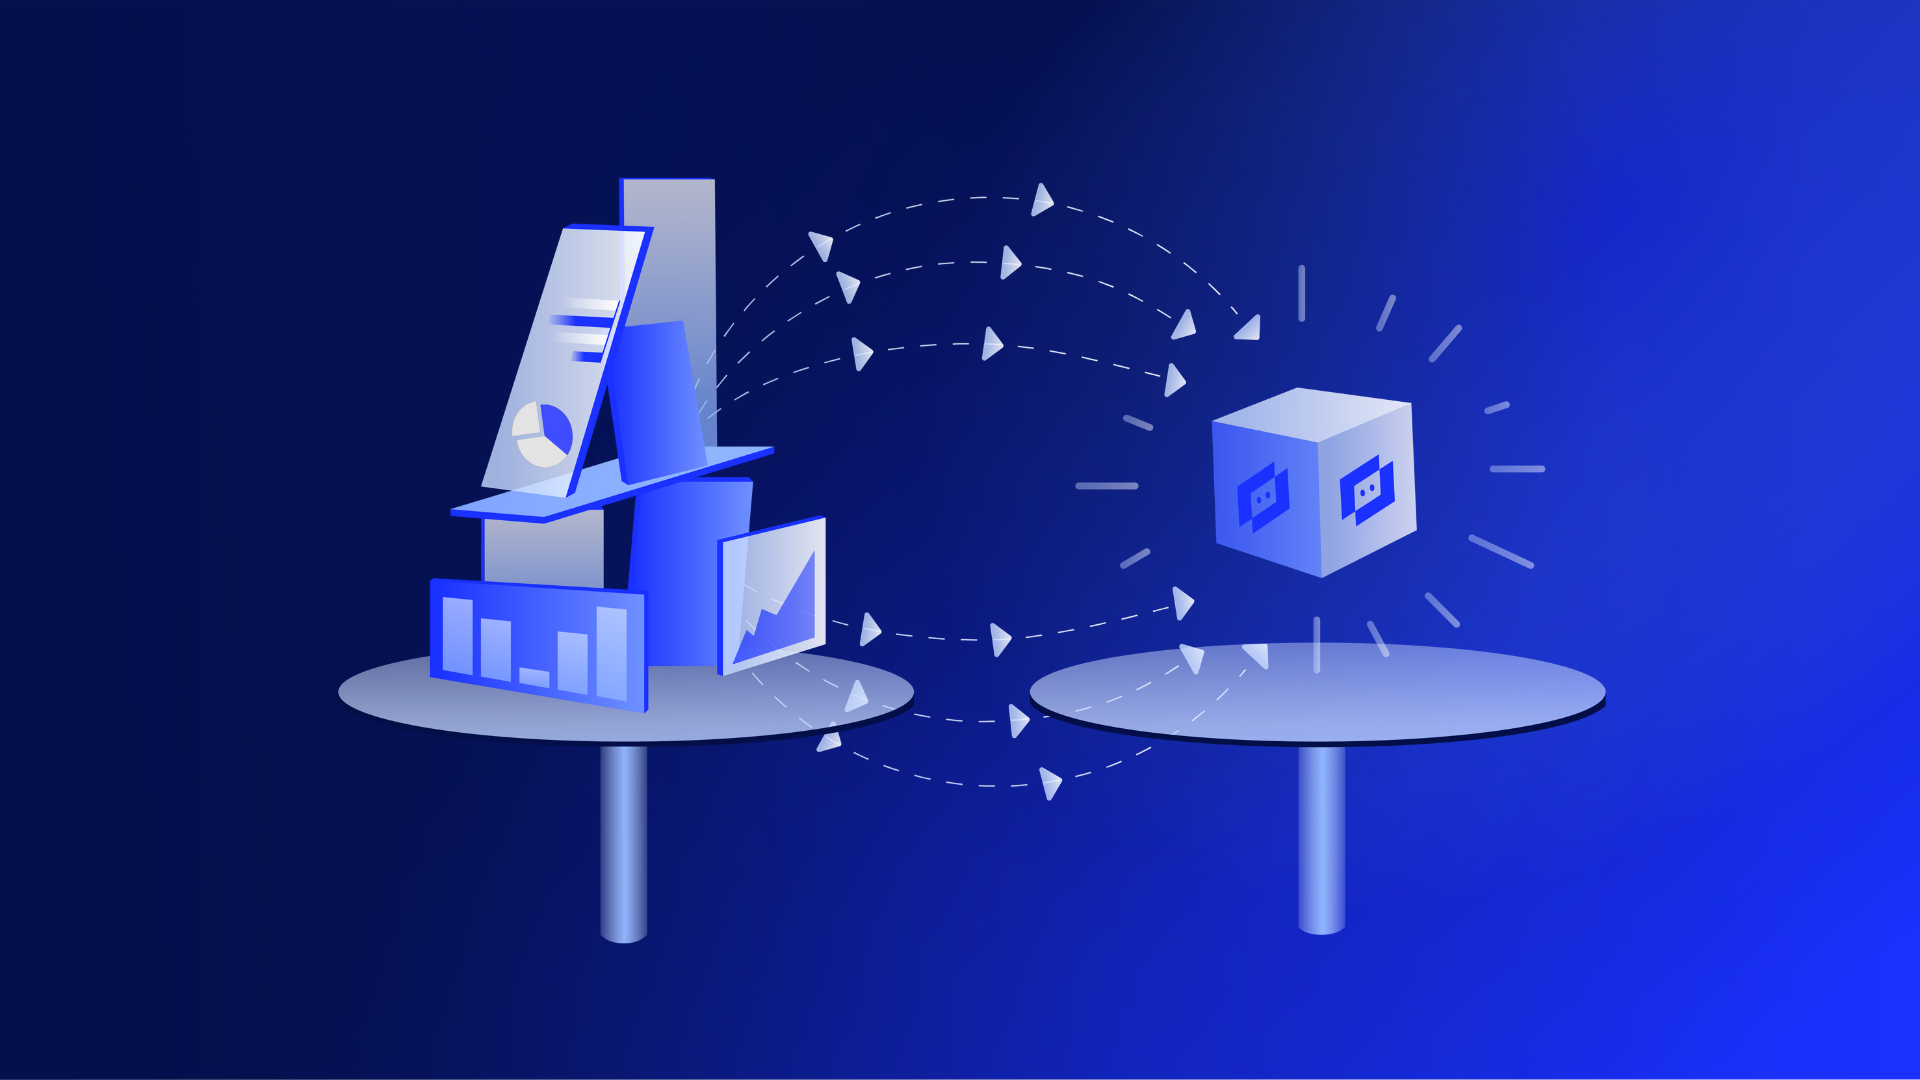
Telemetry is the automated collection of data from a remote system and its transmission to another receiving system for monitoring and analysis.
In IT and software, that data typically includes metrics, events, logs, and traces pulled from servers, applications, networks, and cloud services. Telemetry is what makes it possible to know how a system is behaving without being physically present at that system.
The word comes from Greek roots: tele (“remote”) and metron (“measure”). That origin still describes the core idea well: measuring something from a distance and sending the result somewhere it can be used.
What Does Telemetry Mean for IT and Software Monitoring?
For IT teams, telemetry is the process of collecting and transmitting data about a system’s activity so that dashboards, alerts, and root cause analysis have something to work with. Without it, there’s nothing for those tools to show or analyze.
A distributed system spanning on-prem servers, cloud infrastructure, containers, and third-party APIs generates activity constantly. Telemetry is the mechanism that captures that activity and gets it somewhere a person or a system can use it.
That’s important because most incidents do not originate in a single, obvious place. A checkout page slowing down might trace back to a database query, a misconfigured load balancer, a third-party payment API, or a DNS issue somewhere else in the network entirely.
Teams can only diagnose problems like this if they have telemetry flowing continuously from the stack, not just from the application itself.
Software teams also rely on telemetry outside of incident response. Product and engineering teams instrument applications to see which features get used, how long a session lasts before a user drops off, or how often a specific error occurs across a fleet of devices — data that helps teams decide what to build or fix next, independent of whether anything is currently broken.
How Does Telemetry Work?
Telemetry passes through three stages: instrumentation captures the data, transmission moves it, and storage and analysis make it usable. Each of these relies on specific technologies, and understanding what those technologies do makes it easier to evaluate or troubleshoot a telemetry pipeline.
Instrumentation: Sensors, Agents, SDKs, and APIs
Instrumentation is the process of enabling an application to collect telemetry by adding code, libraries, or software agents. These components capture information such as metrics, logs, and traces, providing a continuous view of how the application behaves during normal operation.
In physical systems, this means sensors that measure properties such as temperature, pressure, or voltage. In software systems, instrumentation usually takes the form of software agents installed on a host, SDKs embedded in application code, or APIs that expose internal state to an external collector.
For example, a Linux server might run a collector agent that reports CPU and memory usage every 60 seconds. At the same time, an application might use an SDK to emit a trace every time a user completes a checkout flow. Both are instrumentation; they just operate at different layers of the stack.
Transmission: Getting Data From Source to Destination
Once data is captured, it has to travel from the source system to wherever it will be stored and analyzed. Transmission happens over a range of protocols and transport methods, including Wi-Fi, cellular, satellite, and wired connections for physical devices, and message queues or streaming platforms like Kafka for high-volume software telemetry.
OpenTelemetry (OTel) has become the closest the industry has to a shared standard for collecting and transmitting telemetry data. It is a vendor-neutral framework for instrumenting, generating, and transmitting telemetry data, which means a team can switch analysis platforms without re-instrumenting every application from scratch.
Prometheus, by contrast, focuses more narrowly on metrics collection and includes its own storage and basic visualization, which makes it a common choice for teams that primarily need numeric time-series data rather than full traces and logs.
Storage and Analysis: Where Telemetry Data Lives
After transmission, telemetry data needs somewhere to reside and a way to interpret it. Time-series databases store metrics efficiently for trend analysis over time. Data lakes and data warehouses hold larger, more varied datasets, including raw logs and traces, for deeper or longer-term analysis.
Observability platforms typically read from these storage systems, applying correlation, dashboards, and alerting to turn stored telemetry into something a team can act on.
This is also where AI and machine learning get involved. Once telemetry is centralized, models can be trained on historical patterns to flag anomalies or forecast capacity issues.

What Is Telemetry Data?
Telemetry data is the output of that collection and transmission process: the actual measurements and events a system reports about its own state or behavior. In IT and software specifically, that data is commonly organized two ways:
- by data type, using the MELT framework
- by where it originates, such as user, network, application, or cloud telemetry.
The MELT Framework: Metrics, Events, Logs, and Traces
MELT is shorthand for the four core types of telemetry data used in modern observability:
| Type | What it captures | Example |
|---|---|---|
| Metrics | Numeric measurements over time | CPU utilization, request latency, error rate |
| Events | Discrete occurrences at a point in time | A deployment, a configuration change, a service restart |
| Logs | Timestamped, unstructured or semi-structured records | An application error message with a stack trace |
| Traces | The path a single request takes across services | A checkout request moving through the API gateway, inventory service, and payment service |
Distributed tracing is the practice behind the “traces” part of MELT, and it’s especially useful when an app is built from many small services instead of one big one.
A single user action might pass through a dozen different services, and a trace follows that action step by step, showing how long each step took. Without a trace, a team can see that a request was slow, but not which one of the dozen services actually caused the delay.
Telemetry Data by Source: User, Network, Application, and Cloud Telemetry
MELT describes the format of telemetry data. It is also useful to group telemetry by source, since different sources require different collection methods and have different purposes.
- User telemetry captures how people interact with an application: clicks, session duration, feature usage, and error encounters. This is what powers real user monitoring (RUM) and session replay.
- Network telemetry covers traffic flow, bandwidth usage, and routing behavior, including data like BGP routing changes that can explain why an entire region appears to be down even though internal systems are healthy.
- Application telemetry includes response times, throughput, and error rates at the code level, typically collected through Application Performance Monitoring (APM) instrumentation.
- Cloud telemetry tracks activity specific to cloud environments: auto-scaling events, configuration changes, security-group modifications, and API calls to cloud provider services.
Cloud Telemetry: A Closer Look
Cloud environments generate operational data that don’t exist in traditional on-prem infrastructure. A misconfigured security group, an unexpected auto-scaling event triggered by a traffic spike, or a change to an IAM policy can all cause outages or security incidents that never show up in server-level metrics alone.
Teams running multi-cloud or hybrid environments generally need telemetry that spans cloud-native services (like managed databases or serverless functions) as well as the underlying infrastructure, since either environment can be the source of a problem.
Telemetry Data by Physical Property
Telemetry data can also be described by what physical or operational property it measures, a framing more common in hardware, industrial, and IoT contexts:
- Environmental data: Temperature, humidity, and air pressure, for example, tracking data center temperature to catch cooling failures before equipment is damaged.
- Performance data: CPU usage, memory utilization, and network throughput — the numbers that show whether a system is keeping up with demand.
- Operational data: Uptime, error rates, and transaction volume — the metrics tied most directly to whether a service is meeting its SLAs.
This framing and the MELT/source-based framing above are not competing systems. A CPU usage metric, for example, is both “performance data” and a “metric” under MELT. Most teams use whichever framing fits the conversation: MELT for observability tooling discussions, and environmental/performance/operational for broader system-health reporting.
Telemetry vs. Monitoring vs. Observability: What’s the Difference?
The three terms describe different functions of the same stack:
- Telemetry is the data.
- Monitoring is what checks that data against known conditions.
- Observability is what a team uses to investigate conditions they didn’t already know to check for.
Confusing them is one of the most common sources of miscommunication between IT teams and the vendors selling to them.
| Capability | What it is | What it answers |
|---|---|---|
| Telemetry | The raw data collected from a system: metrics, events, logs, traces | “What is the system doing right now?” |
| Monitoring | Active checking of telemetry against thresholds or known failure conditions, producing dashboards and alerts | “Is there something wrong that I already know to look for?” |
| Observability | The ability to infer a system’s internal state from its telemetry, including conditions no one predicted in advance | “Why is this happening, and what else does it affect?” |
Monitoring can catch a server that hits 90% memory usage, because someone set that threshold in advance. It can’t explain why response times slowly got worse over three weeks without a single alert ever firing — that takes observability, which pulls metrics, logs, and traces together to find a pattern no one thought to check for.
A team can have good monitoring and still lack observability if their telemetry only covers known conditions they already thought to look for. The reverse happens too: a team can collect plenty of telemetry but still lack monitoring if no one has set up meaningful alerts on it. Either way, both depend on having good telemetry in the first place.
What Are the Benefits of Telemetry?
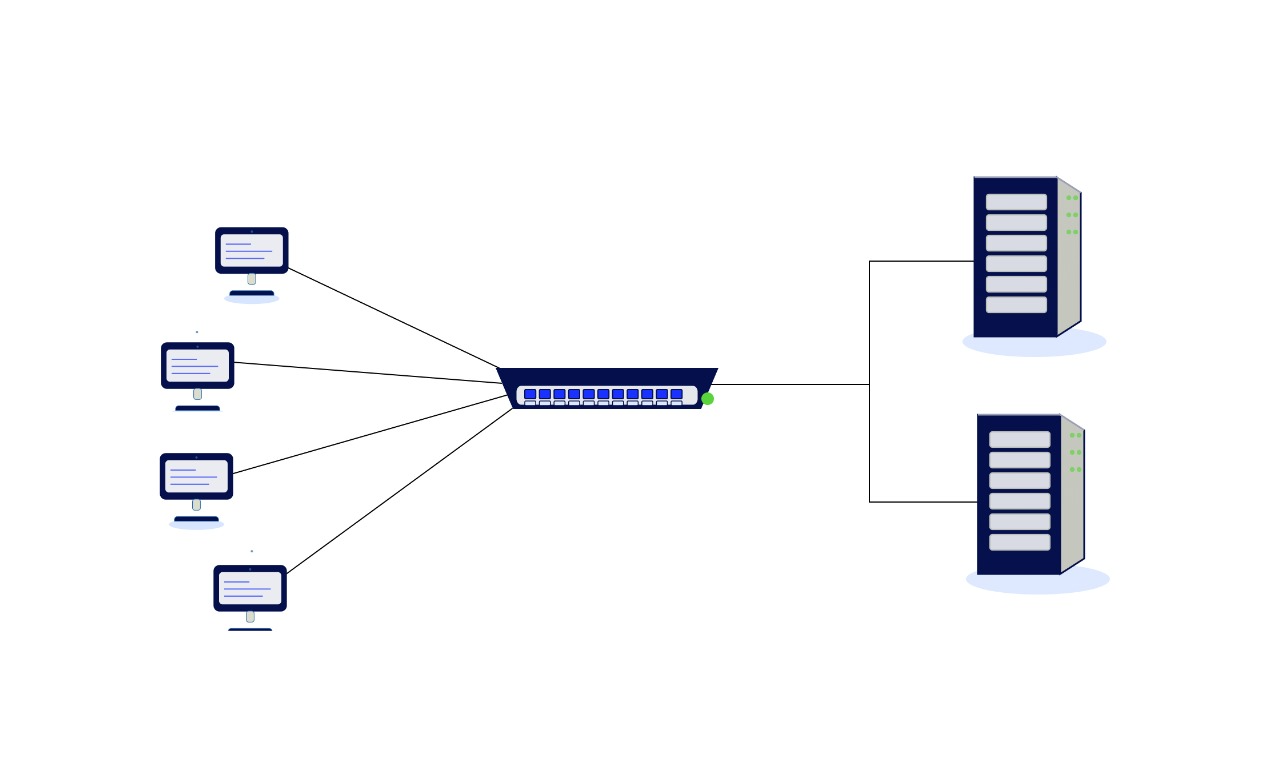
Telemetry gives distributed teams a way to understand system and product behavior without needing physical access to every device or server. For an application running across thousands of endpoints in dozens of countries, telemetry is often the only practical way to know how it’s performing.
- Real-time visibility: Monitor infrastructure health, resource utilization, and application performance as conditions change.
- Faster problem detection and resolution: Telemetry reports crashes, errors, and performance degradation as they happen, along with context like which other processes were running at the time. That context shortens the time between a failure occurring and a team understanding what caused it.
- Product and feature insight: Usage telemetry shows which features get adopted and which get ignored, informing what a team builds next instead of relying on guesswork or infrequent user surveys.
- Personalization at scale: Data on device type, screen configuration, and settings usage lets teams tailor default experiences to what most users actually prefer, rather than applying the same defaults to every user regardless of context.
- A foundation for automation: Once telemetry is flowing reliably, teams can build automated responses on top of it — restarting a failed service, scaling a resource, or routing an alert to the right team — without a person manually watching a dashboard.
- Improved security with threat detection: Detects unusual activity and suspicious network behavior that may indicate a security incident.
What Challenges Come With Implementing Telemetry?
Telemetry challenges are less about collecting data and more about the design decisions that come with collecting it responsibly and sustainably. Five considerations tend to matter most.
- Privacy is a design decision, not a compliance checkbox: The question isn’t only “are we GDPR-compliant” — it’s what gets collected in the first place, how much of it is anonymized or aggregated before storage, and whether users are opted in or opted out by default. Collecting less identifiable data up front is often a stronger privacy strategy than collecting everything and restricting access to it later.
- Volume is a sampling, filtering, and retention problem: High-traffic systems can generate more telemetry data than is practical or affordable to store in full. Teams manage this through sampling (keeping a representative subset of traces rather than every single one), filtering (dropping low-value data like routine health checks before it’s stored), and tiered retention (keeping recent data at full resolution and aging older data down to summaries). Treating volume as “just use more cloud storage” tends to produce ballooning costs without improving usefulness.
- Interoperability is a schema problem: Different tools and vendors format telemetry data differently like timestamps, field names, and severity levels are rarely consistent out of the box. When telemetry from multiple sources is combined without normalization, the result is data that looks complete but is actually misleading, since a “critical” severity in one tool might map to a “warning” in another.
Standards like OpenTelemetry reduce this problem by giving multiple tools a common format to emit data in, but teams pulling from legacy or proprietary sources still need a normalization step.
- Latency affects whether telemetry is actually useful: A metric that takes 10 minutes to reach a dashboard isn’t much help for an alert that should fire in under a minute. Latency is an architectural constraint. It is a function of transmission method, network conditions, and processing overhead, not just a performance nuisance. Systems that depend on fast detection, like fraud monitoring or safety-critical automotive telemetry, are designed around minimizing this delay specifically.
- Data integrity is a distinct problem from volume or privacy: Sensor drift, transmission errors, and inconsistent readings can all produce telemetry that looks valid but isn’t accurate. Regular calibration, validation rules, and redundancy checks catch this before it leads to a false alert or, worse, a missed one.
- The long-term cost of running a telemetry pipeline is often underestimated. Storage, tooling licenses, and the ongoing work of tuning what gets collected and retained add up over time, even after the initial setup is done. Teams that treat telemetry as a one-time implementation rather than an ongoing operational responsibility tend to be the ones surprised by both the bill and the noise a year later.
What Are Advanced Uses of Telemetry?
Beyond real-time monitoring, telemetry feeds predictive and automated systems that act on patterns in the data rather than just reporting them.
Predictive Maintenance
By analyzing historical telemetry such as vibration patterns in industrial equipment, error rate trends in software, and temperature fluctuations in a data center, organizations can identify signs that a failure is likely before it happens.
That means maintenance can happen based on the actual condition of the equipment instead of a fixed schedule, which cuts down on both unnecessary
AIOps and Machine Learning
AIOps platforms apply machine learning to telemetry data to detect anomalies, correlate related signals across systems, and reduce the number of individual alerts a team has to review.
A model trained on months of telemetry can learn what “normal” looks like for a specific environment and flag deviations that a static threshold would either miss or over-alert on.
Over time, these models improve as they process more telemetry, which is why the completeness and quality of the underlying data pipeline directly determines how useful the AI layer on top of it can be.
How Is Telemetry Used Across Industries?
Here’s how:
- IT and software: Cloud service providers rely on telemetry to track server uptime, CPU usage, and network latency across thousands of hosts. Combined with application performance monitoring (APM), this telemetry lets teams predict failures and auto-scale resources ahead of demand rather than reacting once a service is already degraded.
- Healthcare: Wearable and remote monitoring devices transmit vital signs like heart rate, blood pressure, and oxygen saturation to care providers in real time. This allows clinicians to intervene when a reading trends toward abnormal, rather than waiting for a scheduled appointment to catch it.
- Automotive: Vehicle telemetry systems measure torque, stress, and temperature on components like driveshafts and brakes during testing and operation. Accumetrics, for example, uses driveline torque telemetry to help engineers evaluate performance and safety margins under high-stress conditions such as racing or heavy-load transport.
- Aerospace: Aircraft and spacecraft telemetry tracks engine temperature, vibration, and structural stress to catch developing issues before they become in-flight failures. NASA has used rotor blade telemetry on helicopter test programs to study flight dynamics and improve safety margins.
What’s Next for Telemetry?
A few trends are changing how telemetry is collected and used going forward:
- IoT growth is multiplying the number of connected devices generating telemetry, particularly in smart buildings, industrial automation, and connected vehicles.
- Edge computing processes telemetry closer to where it’s generated, reducing the delay between an event occurring and a system responding to it — important for latency-sensitive use cases like autonomous vehicles.
- Tighter security standards are becoming standard practice as more sensitive telemetry, especially in finance and healthcare, moves across networks, with stronger encryption applied both in transit and at rest.
- AI-driven telemetry pipelines are designed with machine learning in mind from the start, rather than bolting AI analysis onto a pipeline that was originally built only for dashboards.
Telemetry Is the Foundation
Telemetry answers “what is happening.” On its own, it doesn’t answer “what should we do about it” — that requires monitoring, observability, and AI built on top of a telemetry pipeline that’s complete enough to trust.
That’s the layer LogicMonitor is built for. LM Envision unifies telemetry across infrastructure, cloud, and edge into a single foundation; Catchpoint extends that visibility to Internet performance and real user experience.
And Edwin AI uses that combined telemetry to correlate signals, prioritize what matters, and guide or execute the response — all within defined guardrails. The result is a shorter path from “here’s what the telemetry shows” to “here’s what’s already been done about it.”
See what your telemetry has been trying to tell you
Most teams are already collecting more data than they’re using. Let’s put yours to work.
FAQs
1. What is the difference between push-based and pull-based telemetry?
In a push-based model, the source sends telemetry to a collector at scheduled intervals or when an event occurs. In a pull-based model, the collector requests data from the source. Push models work well for temporary workloads, while pull models give the collector more control over collection frequency.
2. What is telemetry sampling?
Telemetry sampling means collecting or retaining only part of the available data. Head-based sampling decides whether to keep a trace when it begins. Tail-based sampling decides after the trace completes, allowing the system to retain slow or failed requests while dropping routine ones.
3. What are semantic conventions in telemetry?
Semantic conventions are shared rules for naming and describing telemetry fields. For example, different applications may use the same standard field name for an HTTP response status. Consistent conventions make data easier to search, compare, and combine across services.
4. What are the platforms I can use to implement telemetry?
Popular options include OpenTelemetry, LogicMonitor, Prometheus, and cloud-native tools like AWS CloudWatch or Azure Monitor. These help collect, process, and visualize telemetry data with minimal setup.
5. Does telemetry always involve the internet?
No. Telemetry can transmit over Wi-Fi, cellular, satellite, or wired connections, and in some cases moves over a local network rather than the public internet — for example, industrial equipment reporting to an on-site control system.
6. What’s the best way to handle telemetry data from thousands of devices or users?
Use scalable infrastructure like cloud storage and streaming platforms (e.g., Kafka, AWS Kinesis), compress data where possible, and process it in batches or streams to avoid bottlenecks.