Application Performance Management vs Application Performance Monitoring: Key Differences & Best Practices
Discover key differences between Application Performance Monitoring and Application Performance Management. Understand their unique roles in optimizing your software environment for improved user experience.
Application performance monitoring helps you troubleshoot faster, while application performance management helps organizations improve long-term application reliability and operational efficiency.
Application performance monitoring focuses on real-time visibility into application health, latency, dependencies, and user experience to detect and resolve issues before they impact users.
Application performance management takes a broader operational approach by aligning performance optimization, SLA goals, resource planning, and service reliability with business outcomes.
While monitoring helps you diagnose technical issues, management improves application reliability, scalability, and service delivery over time.
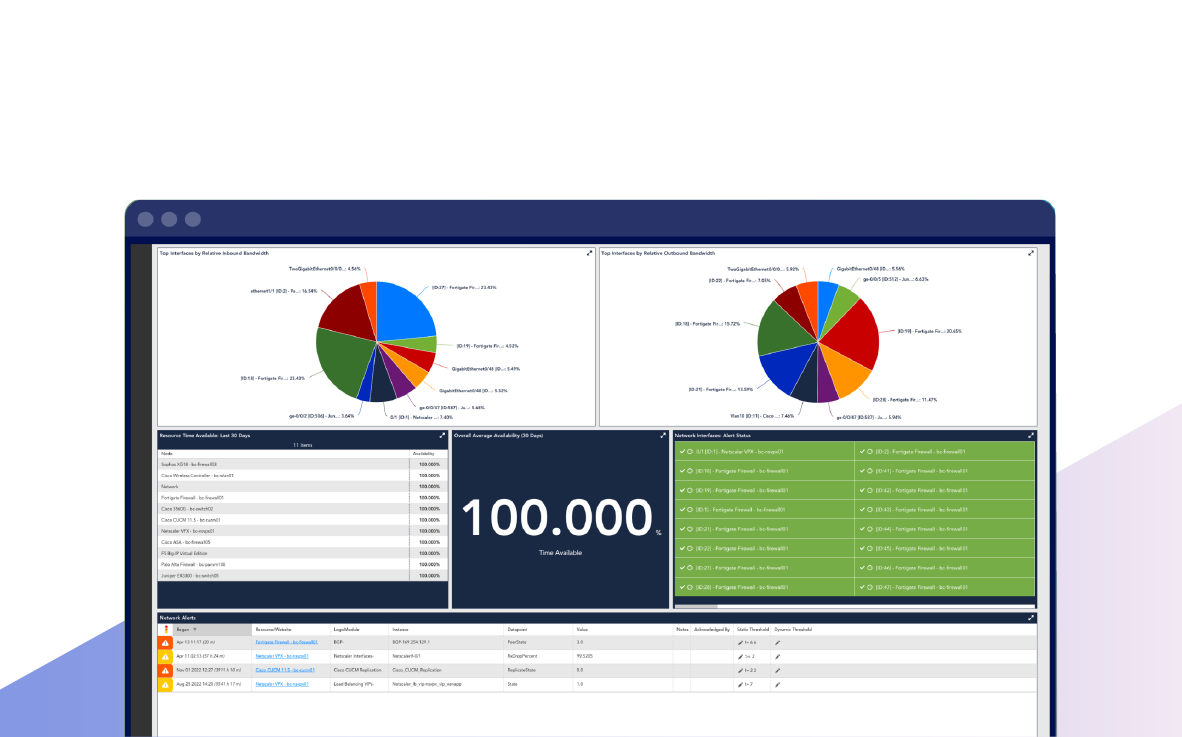
LogicMonitor APM helps ITOps, DevOps, and SRE teams correlate telemetry, reduce alert noise, and deliver more reliable digital experiences across hybrid environments.
Application performance monitoring is no longer limited to tracking uptime and response times.
In distributed environments, organizations need visibility across microservices, containers, APIs, infrastructure, and user experience to maintain reliable digital services.
Understanding application performance monitoring vs application performance management is critical because while monitoring helps you detect and troubleshoot issues in real time, management focuses on improving long-term application reliability, scalability, and operational efficiency.
Together, these practices help ITOps, DevOps, and SRE teams reduce downtime, accelerate root cause analysis, and deliver better application experiences across cloud-native environments.
What is Application Performance Management?
Application performance management (APM) is the combination of tools, analytics, and operational practices used to optimize the performance, availability, and user experience of software applications. More than monitoring metrics, application performance management detects, diagnoses, and resolves performance issues before they impact users or business operations.
Modern app performance management gives you visibility into response times, error rates, resource utilization, dependencies, and user activity across distributed and cloud-native environments.
By correlating monitoring data with broader operational insights, you can identify bottlenecks faster, automate root cause analysis, and prioritize improvements that support both reliability and business goals.
Today’s APM platforms have also evolved alongside observability practices, helping organizations move beyond simple monitoring toward a deeper understanding of system behavior and user experience.
A strong Digital Experience Monitoring (DEM) enabled application performance management solution reduces latency, improves scalability, and delivers more consistent digital experiences across applications.
What is APM (Application Performance Monitoring?
Application Performance Monitoring (APM) is the practice of collecting and analyzing telemetry data to track application health, availability, response times, and user experience in real time.
An application performance monitor gives you end-to-end visibility across applications, infrastructure, services, and dependencies to detect and resolve issues before users are impacted.
Think of it like a live performance dashboard for your applications.
Instead of waiting for customer complaints, you can proactively identify latency spikes, failed transactions, resource bottlenecks, or service degradation across distributed and cloud-native environments.
Modern APM tools go beyond basic uptime checks by correlating metrics, traces, logs, and user activity to uncover the root cause of problems faster and reduce mean time to resolution (MTTR).
This visibility is especially important for microservices-based and business application monitoring strategies where performance issues can originate across multiple interconnected services.
LogicMonitor APM helps you correlate metrics, logs, traces, and synthetics to troubleshoot faster, reduce downtime, and deliver better digital experiences.
Why Do We Need Application Performance Management?
Application performance management helps organizations align application reliability, operational priorities, and business expectations as environments scale. Beyond technical troubleshooting, it creates a structured approach for improving long-term application efficiency, governance, and service delivery.
It also helps:
Standardize performance practices across team members and environments
Prioritize optimization efforts based on business-critical services
Improve operational planning for scaling and infrastructure investments
Support SLA reporting and service accountability
Reduce operational silos between engineering and business stakeholders
Improve resource efficiency and cost management
Strengthen change management and release governance
Build a more proactive performance culture instead of reactive firefighting
Why Do We Need Application Performance Monitoring?
Modern applications are distributed across cloud services, containers, APIs, and third-party dependencies, making performance issues harder to isolate manually.
Application performance monitoring helps you maintain operational stability by continuously validating that services, transactions, and dependencies are functioning as expected.
It also helps:
Detect hidden service dependencies before failures cascade
Validate deployment health after releases or infrastructure changes
Monitor customer-facing transaction flows in real time
Reduce troubleshooting time during incidents and outages
Improve collaboration between DevOps, SRE, and ITOps
Identify recurring performance patterns and operational risks
Support faster release cycles with greater confidence
Maintain consistent application behavior across hybrid and multi-cloud environments
Application Performance Monitoring Features vs Application Performance Management Features
While application monitoring and management are closely related, they focus on different operational goals.
Application performance monitoring features provide real-time visibility into application health and performance, while application performance management focuses on the broader processes, optimization strategies, and business outcomes tied to application reliability and user experience.
Application Performance Monitoring Features
Its core features include:
Real-time monitoring of response times, latency, and error rates
Distributed tracing across microservices and cloud-native environments
Infrastructure and dependency visibility
Alerting, anomaly detection, and root cause analysis
User experience monitoring and synthetic testing
Telemetry correlation across metrics, logs, and traces
Historical trend analysis for APM performance optimization
Application Performance Management Features
Its primary features include:
SLA tracking and service performance governance
Resource allocation and capacity planning
Performance optimization workflows and automation
Cross-team visibility for DevOps, ITOps, and SRE collaboration
Business impact analysis tied to application availability
Application monitoring strategy alignment with operational goals
Process management for continuous application improvement
The key difference is that monitoring identifies and diagnoses performance issues, while management focuses on improving long-term application reliability, scalability, and operational efficiency.
Application Performance Management Use Cases
Organizations use application performance management to improve application reliability, operational efficiency, and long-term service performance across complex environments.
By combining telemetry data with broader operational insights, you can better understand how application behavior impacts infrastructure, users, and business outcomes.
Common application performance management use cases include:
Business transaction analysis: Track end-to-end transaction flows across applications, services, APIs, and databases to identify bottlenecks affecting critical business operations.
Root cause analysis: Correlate logs, metrics, traces, and dependency data to quickly isolate the source of performance degradation or application failures.
Resource optimization and cost management: Improve resource allocation across cloud, on-premises, and hybrid environments to reduce waste and support scalability initiatives.
Compliance and audit reporting: Maintain visibility into application performance metrics and operational activity to support regulatory, audit, and governance requirements.
SLA management: Monitor uptime, latency, and service performance against defined SLA targets and generate reporting for operational and business stakeholders.
Cross-team operational visibility: Give ITOps, DevOps, and SRE shared insights into application health, dependencies, and operational risks.
Application Performance Monitoring Use Cases
Application performance monitoring detects, diagnoses, and resolves performance issues across distributed applications and infrastructure in real time.
By continuously analyzing telemetry data, you gain visibility into application behavior, service dependencies, and user experience.
Common application performance monitoring use cases include:
Proactive issue detection: Identify latency spikes, failed requests, abnormal error rates, and service degradation before users are impacted.
Capacity planning: Monitor CPU, memory, disk I/O, throughput, and infrastructure utilization trends to anticipate scaling requirements and prevent resource bottlenecks.
User experience monitoring: Track page load times, session performance, transaction completion, and digital experience metrics across applications and services.
Code-level performance analysis: Analyze application traces and code execution paths to identify inefficient queries, slow transactions, and performance bottlenecks within application code.
Cloud-native monitoring: Monitor Kubernetes workloads, containers, APIs, microservices, and ephemeral infrastructure components across distributed environments.
SLA monitoring and reporting: Continuously track uptime, latency, and response time performance against SLA commitments and operational targets.
By combining real-time telemetry, distributed tracing, and dependency visibility, application performance monitoring enables you to troubleshoot faster, reduce downtime, and maintain more reliable application experiences.
Key Differences Between Performance Monitoring vs Performance Management
Here’s a tabular comparison between both performance monitoring and performance management to help you understand their differences:
Area
Application Performance Monitoring
Application Performance Management
Primary focus
Detecting, diagnosing, and troubleshooting performance issues in real time
Improving long-term application reliability, scalability, and operational efficiency
Operational scope
Service-level and transaction-level visibility
Organization-wide performance governance and optimization
Time horizon
Immediate incident detection and response
Continuous performance improvement and strategic planning
Core users
DevOps engineers, SREs, support engineers
IT leadership, platform engineers, operations managers
Telemetry usage
Analyzes live metrics, traces, logs, and alerts
Uses historical trends, SLA data, operational insights, and business KPIs
Problem resolution approach
Identifies symptoms and technical root cause
Prioritizes remediation strategies and operational improvements
Cloud-native visibility
Tracks containers, Kubernetes workloads, APIs, and microservices in real time
Aligns resource planning and service reliability across distributed environments
Automation maturity
Alerting, anomaly detection, and incident workflows
Capacity planning, governance, optimization, and operational automation
Success measurement
MTTR reduction, uptime, latency, and service health
SLA achievement, operational efficiency, scalability, and user satisfaction
Business alignment
Supports application stability and troubleshooting
Connects application performance to business outcomes and service delivery goals
Application Performance Monitoring Tools vs Application Performance Management Tools
Application performance monitoring tools and application performance management tools often overlap, but they serve different operational needs.
Monitoring tools focus on real-time visibility and issue detection, while management platforms help you optimize performance, align operations, and improve long-term application reliability.
Application Performance Monitoring Tools
Application performance monitoring tools track application health, dependencies, and user experience across environments. Their common capabilities include:
Distributed tracing and telemetry correlation
Real-time alerting and anomaly detection
Cloud application performance monitoring for Kubernetes and microservices
Root cause analysis using logs, metrics, and traces
Synthetic and real-user monitoring
These tools help DevOps and SRE teams detect issues faster, reduce MTTR, and maintain application uptime.
Application performance management software takes a broader operational approach by combining monitoring data with optimization workflows, SLA management, capacity planning, and automation.
Many application performance management solutions also support business impact analysis and cross-team collaboration.
Platforms like LogicMonitor support both areas by combining observability, AI-driven insights, and unified telemetry correlation in a single platform.
Note: With LogicMonitor APM, teams gain end-to-end visibility across infrastructure, applications, and user experience to proactively improve performance and reduce operational complexity.
Application Performance Management and Monitoring in Cloud-Native Environments
Cloud-native architectures have fundamentally changed how you monitor and manage application performance.
Applications now run across Kubernetes clusters, containers, APIs, serverless functions, and distributed microservices, where a single user transaction may span dozens of interconnected services.
This added complexity makes visibility, dependency tracking, and rapid troubleshooting significantly more challenging.
Application Architecture Discovery and Dependency Mapping
Effective application performance management and monitoring start with understanding how services, infrastructure, and dependencies interact.
You need visibility into:
Microservices and container relationships
APIs and external service dependencies
Databases, virtual machines, and cloud infrastructure
Transaction flows across distributed systems
Dependency mapping helps you visualize service relationships, identify bottlenecks, and understand how failures propagate across environments.
Application Performance Management in Cloud-Native Setups
Application performance management focuses on optimizing application reliability, scalability, and operational efficiency across dynamic environments.
In cloud-native ecosystems, this includes:
Managing resource allocation across services and workloads
Supporting performance governance and SLA objectives
Coordinating performance visibility across DevOps, SRE, and ITOps
Monitoring serverless and autoscaling environments at scale
This broader operational perspective helps organizations maintain consistent digital experiences as architectures evolve.
Application Performance Monitoring in Cloud-Native Setups
Application performance monitoring provides granular visibility into the health and behavior of individual services, containers, and transactions.
Modern APM platforms helps:
Monitor latency, throughput, and error rates in real time
Trace requests across microservices and APIs
Detect performance degradation before users are impacted
Correlate metrics, logs, and traces for faster root cause analysis
Track Kubernetes workloads and ephemeral infrastructure components
This level of visibility is essential for troubleshooting distributed applications where issues may originate across multiple interconnected services.
Infrastructure Monitoring vs Application Monitoring
Application monitoring and infrastructure monitoring both support operational reliability, but they focus on different aspects of the technology stack.
Application monitoring focuses on application behavior and user experience, including:
Response times and transaction performance
Application errors and failed requests
Service dependencies and API performance
User sessions and digital experience metrics
Infrastructure monitoring focuses on the systems supporting those applications, including:
CPU, memory, and disk utilization
Network throughput and connectivity
Server, VM, and storage health
Cloud infrastructure and Kubernetes node performance
In modern environments, these disciplines work best together.
Correlating infrastructure metrics with application telemetry gives you the context needed to understand how infrastructure issues impact application performance, user experience, and business operations.
Note: Proactive monitoring and strategic management together create a holistic approach to application performance that aligns with both user needs and business goals.
Best Practices for Implementing Application Performance Management and Monitoring
To get the most out of application performance monitoring (APM) and application performance management, organizations need a strategy that balances real-time visibility, operational efficiency, and user experience.
Modern APM best practices focus on proactive detection, telemetry correlation, and cloud-native observability rather than relying on isolated monitoring tools.
1. Set dynamic thresholds and intelligent alerts
To build a more effective alerting strategy, focus on the following practices:
Establish adaptive baselines based on normal application behavior instead of static thresholds alone
Use AI-driven alerting to reduce noise, prioritize incidents, and avoid alert fatigue
Monitor critical indicators such as latency, throughput, error rates, and dependency health
2. Prioritize end-user experience
To gain better visibility into the quality of digital experiences, consider the following monitoring approaches:
Track user-facing metrics like page load time, transaction completion, and session reliability
Combine synthetic monitoring with real user monitoring (RUM) for better visibility into digital experiences
Use end-to-end application performance monitoring to understand how backend dependencies impact users
3. Align monitoring with business priorities
To connect monitoring activities to business objectives, focus on these key areas:
Define KPIs tied to uptime, customer experience, SLA performance, and operational risk
Ensure monitoring strategies support release velocity, scalability, and cost optimization goals
4. Use telemetry data for continuous optimization
To turn telemetry into actionable insights, incorporate the following practices into your performance strategy:
Correlate metrics, logs, and traces to identify recurring bottlenecks and hidden dependencies
Integrate observability insights into DevOps, SRE, and incident management workflows
Review historical trends regularly to improve performance planning and release validation
5. Incorporate AIOps and automation
To improve efficiency and accelerate incident response, consider the following automation capabilities:
Use AIOps to detect anomalies, automate root cause analysis, and accelerate remediation
Automate repetitive operational tasks to improve response times and reduce manual overhead
Leverage intelligent correlation to surface the most business-impacting issues first
6. Plan for cloud-native and distributed architectures
To effectively monitor modern application environments, ensure your strategy includes the following:
Adopt tools that support Kubernetes, microservices, APIs, and hybrid cloud environments
Monitor service interactions, ephemeral workloads, and infrastructure dependencies in real time
Ensure application performance monitoring (APM) strategies provide unified visibility across modern distributed systems
7. Document workflows and operational insights
To improve consistency and collaboration across teams, establish the following operational practices:
Standardize alerting policies, escalation paths, and remediation procedures
Share performance insights across DevOps, ITOps, engineering, and leadership teams
Maintain operational documentation to improve collaboration and incident response consistency
Drive Application Performance with LogicMonitor
Application performance monitoring and application performance management are most effective when you can connect application health, service dependencies, and user impact in one place.
As environments become more distributed across cloud services, APIs, containers, and microservices, disconnected monitoring tools create visibility gaps that slow troubleshooting and increase operational complexity.
LogicMonitor helps ITOps, DevOps, and SRE teams gain full visibility into application performance by correlating traces, metrics, and synthetics across hybrid environments.
With OpenTelemetry-powered tracing, teams can follow transactions across services, APIs, and distributed systems in real time, while auto-instrumentation for Java, .NET, and Python helps accelerate visibility without manual setup.
LM Envision also enables you to monitor business KPIs and technical metrics, simulate user journeys from global locations, and use AI-powered correlation to surface root causes faster.
Edwin AI automatically connects signals across services and dependencies to reduce alert noise and help focus on issues that impact users most.
By combining application telemetry, AI-assisted insights, and shared visibility in a single platform, LogicMonitor resolves issues faster, reduces downtime, and delivers more reliable digital experiences.
Get Full Visibility Into Application Performance
LogicMonitor helps ITOps, DevOps, and SRE teams correlate traces, metrics, logs, and synthetics to troubleshoot faster, reduce downtime, and deliver better digital experiences across distributed environments.
What is Application Performance Monitoring, and Why Does it Matter in Cloud-Native Environments?
It helps you track application health, dependencies, latency, and user experience across distributed systems in real time. In cloud-native environments, APM improves visibility across microservices, containers, APIs, and Kubernetes workloads to help you troubleshoot issues faster and reduce downtime.
How Does Application Performance Management Improve Operational Efficiency Beyond Monitoring?
Application performance management helps organizations improve scalability, reliability, SLA performance, and resource optimization over time.
Unlike monitoring alone, it aligns operational priorities and performance goals with business outcomes and long-term service delivery.
What is Performance Monitoring, and How is It Different From Observability?
Performance monitoring focuses on tracking predefined metrics like uptime, latency, and resource utilization. Observability extends beyond monitoring by correlating metrics, logs, traces, and dependencies to help you understand why issues occur in complex distributed systems.
What is Application Monitoring, and What Should You Monitor First?
It is the process of tracking application behavior, transaction performance, service dependencies, and user experience. You should prioritize monitoring critical services, APIs, latency-sensitive workloads, and customer-facing transaction flows first.
What is APM Software, and What Capabilities Should Modern Platforms Include?
Modern APM software helps you monitor and optimize application performance across distributed environments. Strong platforms should include distributed tracing, telemetry correlation, Kubernetes visibility, synthetic monitoring, AI-driven insights, and root cause analysis capabilities.