Managing application performance has evolved –requiring ITOps teams to become more involved in understanding application performance and users of APM solutions. Keeping an eye on what affects business outcomes has expanded outside the infrastructure to include the users dependent on applications. Modern ITOps teams can no longer ignore the application performance, status, user experience, and overall health of the application alongside the supporting infrastructure.
Whether you’re supporting a new cloud-native application or migrating a legacy application to the cloud, many organizations are now managing applications based on microservices architecture and using CI/CD processes. Microservices are cloud-based but still require underlying infrastructure; application ownership and focus on quality are not just app development responsibilities anymore. ITOps teams need visibility and the ability to monitor application performance as much as they do any other part of their company’s IT environment. This approach, of course, brings about its own challenges — like new complexity. But don’t be alarmed, microservices aren’t as scary as they look on the outside…I promise!
Modern applications
Application deployments are happening multiple times a week, so the ability to monitor microservices is essential since so much business performance rides on an independent piece of code. Cloud services and containers are now a standard part of modern applications, even during the “lift and shift” phase as you migrate from legacy applications to cloud-native.
Handling application dependencies means more complexity for the teams responsible for application ownership and performance. However, businesses still have flexibility in selecting what infrastructure makes sense for running their applications – based on operational processes, current environment, cloud strategy, or long-term scalability goals. Cloud services accelerate most application use cases in time to market and speed. Still, a fair amount of use cases (like any healthcare staffing demand forecast services) can only run on-premise because of various industry, bandwidth, or privacy needs. This Hybrid IT brings about more dependencies on the underlying infrastructure and raises operational complexity with modern applications.
Monitoring challenge
ITOps teams need to understand microservices performance as the functions impact overall IT usage –like surges in cloud-service billing and CPU spikes on servers. But DevOps and ITOps teams have different control over the application with limited insights across the application and the services affecting their team. Teams can’t focus on the application code without accounting for the underlying IT architecture. How do ITOps teams know if application changes affect the infrastructure or vice versa? How are recent deployments impacting business KPI or the number of Ops teams incidents? So the challenge is monitoring and practicing observability across teams to account for the complexities of modern applications.
Monitoring solutions should eliminate application and information silos
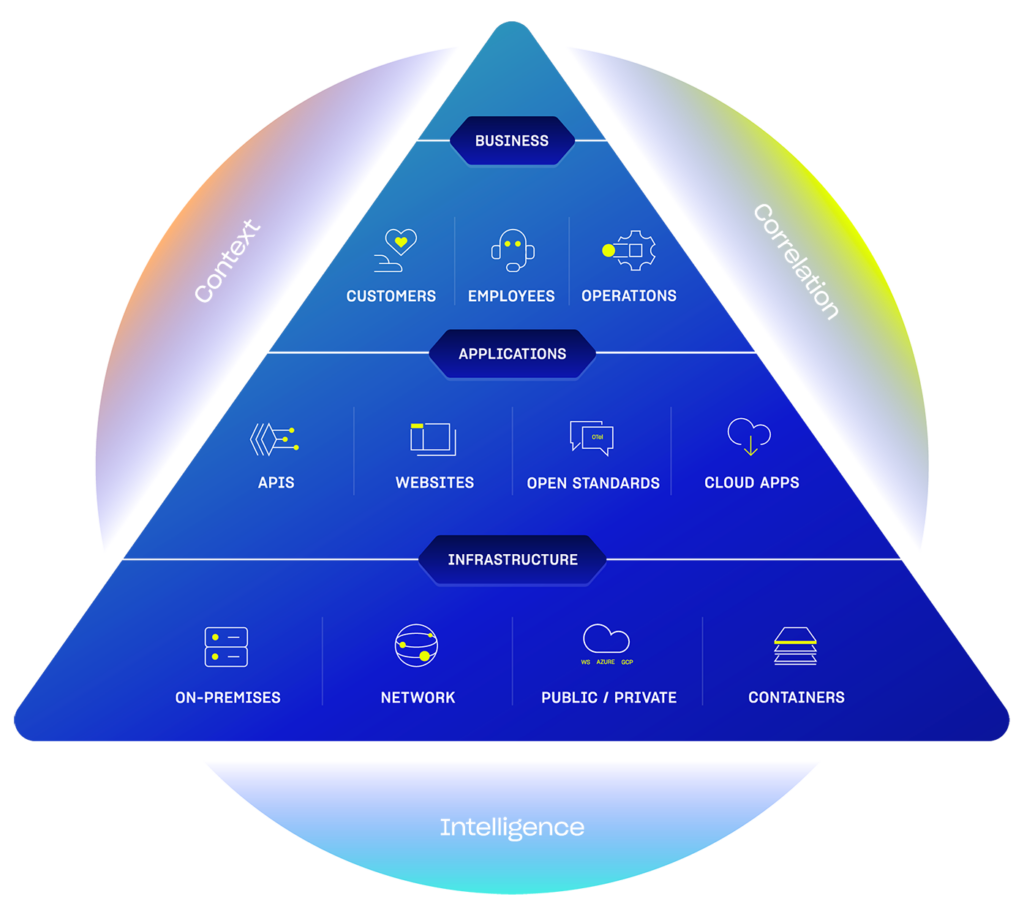
Selecting the right APM solution for your business is more than looking at a list of capabilities. The first decision should be how it compliments your existing monitoring solution. Adding another point product would only maintain operational silos. Teams need the full context and correlation within observability platforms to manage application performance across hybrid and multi-cloud environments. Look for an APM solution that provides access to the ITOps team to collaborate with DevOps for shared ownership of Application quality.
It all comes down to a stable and scalable infrastructure to maximize application service and deliver a great customer experience. Ops teams must be equipped to respond as the first line of defense and be alerted to unexpected application changes. Breaking down the silo in information and access between ITOps and DevOps allows for seemingly minor IT issues to prevent major business outages and impact the customer experience. A simple firewall patch incorrectly diverting traffic and causing a significant application outage could be sorted out with a modern monitoring solution, reducing MTTR and time wasted. Shared access to metrics, log, and trace data would allow both Ops teams to identify the root cause, triage, and test together.
Collaborating would help businesses de-risk operations by moving towards a multi-cloud strategy. Migrating specific services or applications across cloud service providers is a collaborative process across all Ops teams. ITOps and DevOps need to ensure billing is correct and safeguards and access are in place to the right users before optimizing performance to see the benefit. Collaboration between ITOps & DevOps ensures the IT investments help maximize application quality for all, with performance data-informed decisions to grow the business.
LM APM, a key part of LM Envision
Businesses don’t need to change how they develop or release application code; the solution is selecting an APM solution that works to bring Ops teams together. LM APM is built in response to the changing needs of our IT Ops and DevOps customers to scale and optimize the efficiency of modern applications – all in a cloud-based, unified observability platform, LM Envision.
LM Envision has supported Ops workflows with monitoring and troubleshooting via infrastructure & cloud monitoring and log data. Now LM APM helps track user performance, detect application latency, and identify bottlenecks within modern applications to resolve issues faster. LM APM eliminates application and information silos between ITOps & DevOps to prevent context switching with a single view of application services, performance, and infrastructure. LM APM helps achieve unified observability by offering a set of key capabilities:
Synthetic monitoring for customer experience to get ahead of potential problems
Broader integrations for importing metrics to visualize performance issues
Distributed traces for measuring applications services to identify RCA of performance problems
Synthetic Monitoring
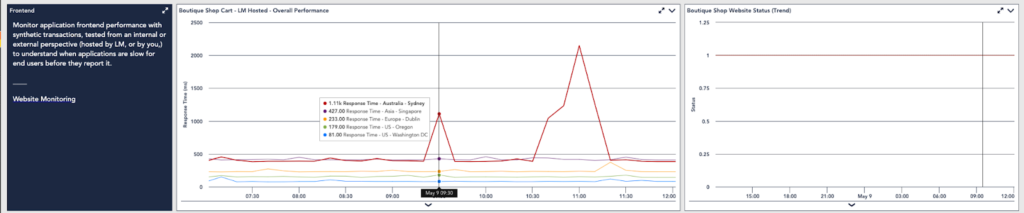
LM APM includes Synthetic Monitoring, built off the Selenium grid, to provide no-code access for Ops teams to simulate end-user traffic. Ops record automated browser tests instead of writing complex scripts to emulate recordings in critical application workflows and upload them to appear alongside other LM-monitored devices. Synthetic tests give early insight into the quality of the end-user experience by reporting metrics on availability and latency. For example, Ops teams would receive a critical alert saying people can not log in or if the response time for another execution is longer than expected. Ops teams can traverse alerts to the corresponding IT infrastructure resource or device to understand if the issue falls on the infrastructure or application. Synthetic monitoring helps Ops be proactive before any application performance issue affects the customer.
Performance Metrics
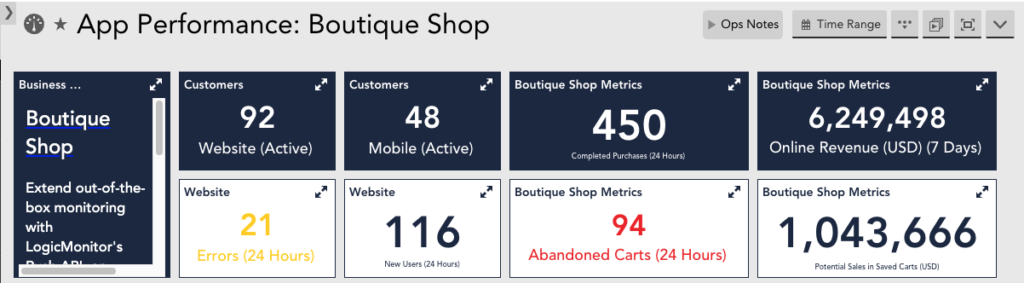
LM APM enhances the support for metrics within LM Envision with more ways to import performance metrics that show more than just the health of infrastructure devices. LM Envision dashboards now create full views of application performance with sections that should be relevant for Ops teams. For example- in an eCommerce application – Logging in, adding items to a cart, and checkout are key business metrics that each team should follow as an overall health indicator but are generally viewed outside your existing monitoring solution. LM APM allows you to import and visualize these KPIs in LM Envision in the same dashboard showing other team metrics around application services or network traffic. Ops can have insight with metric-based application alerts to see if early customer performance indicators might be rooted in the underlying IT infrastructure.
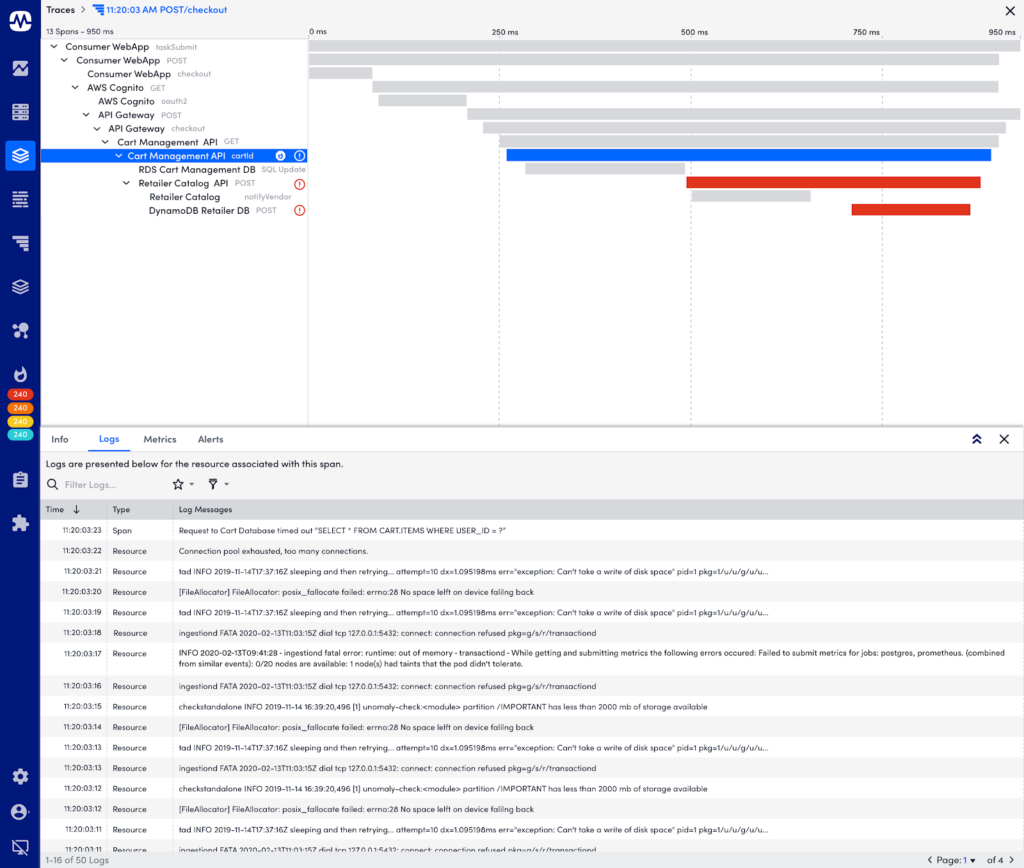
Distributed Traces
LM APM is built on open standards with OpenTelemetry integration for capturing distributed traces to monitor every step along the way as customers navigate modern applications. Each of the steps in your application, like logging in, might make over 15 unique requests, with some calls to the public cloud and others to your data center. Our APM traces record these entire transactions to know what happens along each step in case there are bottlenecks with a server or a host. Instrumenting traces usually fall on DevOps teams, but once they identify application latency or bottlenecks, the root cause may be the underlying Infrastructure IT. Traces are essential for shared application quality ownership.
The role of ITOps is changing as more applications migrate to cloud-native applications built around microservices. Ops teams require a strong understanding of application performance to connect your workflows of managing the underlying IT to the customer experience and overall business performance. Many APM point products offer insight into application performance but maintain the siloed information between IT Ops and DevOps, adding unnecessary challenges for modern applications. LM APM – a key part of the LM Envision observability platform – supports IT Ops teams in addressing new demands arising from changing ecosystems by collaborating on the drivers affecting both customer experience and business outcomes.
Disclaimer: The views expressed on this blog are those of the author and do not necessarily reflect the views of LogicMonitor or its affiliates.