
For ITOps Teams
Make Smarter, Faster Decisions with Unified Observability
Empower IT Operations with a single platform for monitoring, alerting, automation, and AIOps—across hybrid infrastructure, apps, and services.


For ITOps Teams
Empower IT Operations with a single platform for monitoring, alerting, automation, and AIOps—across hybrid infrastructure, apps, and services.
Industry trusted


WHY LOGICMONITOR
LogicMonitor helps ITOps reduce noise, resolve incidents faster, and gain proactive insights powered by AI.
Built for modern ITOps
Unify monitoring, alerting, and AI-driven insights across your tech stack.
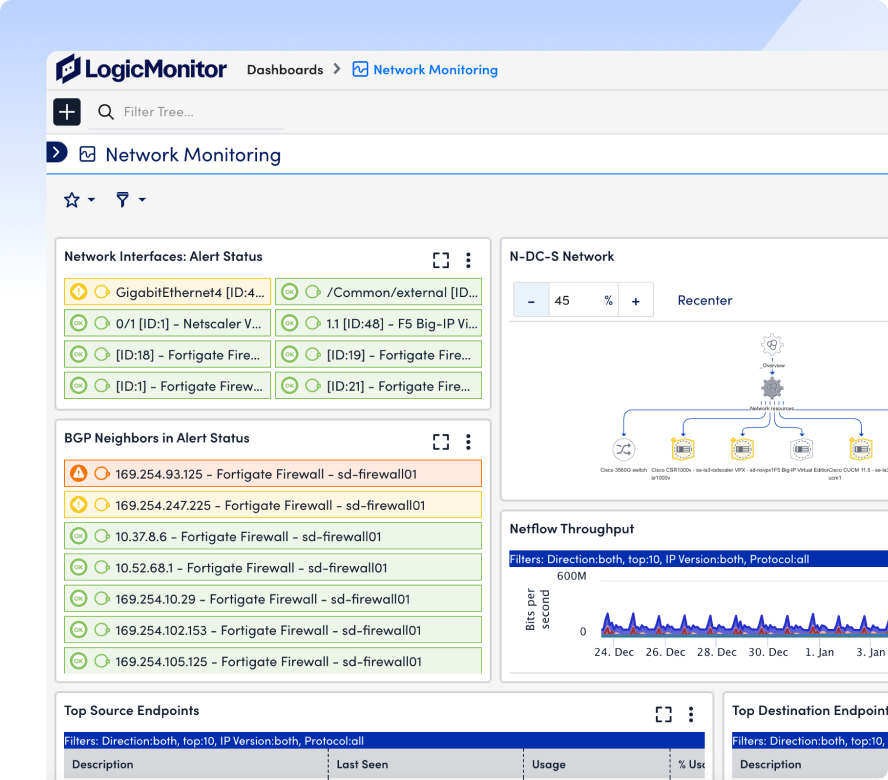
From on-prem to cloud to containers, LogicMonitor discovers and monitors every system—automatically.
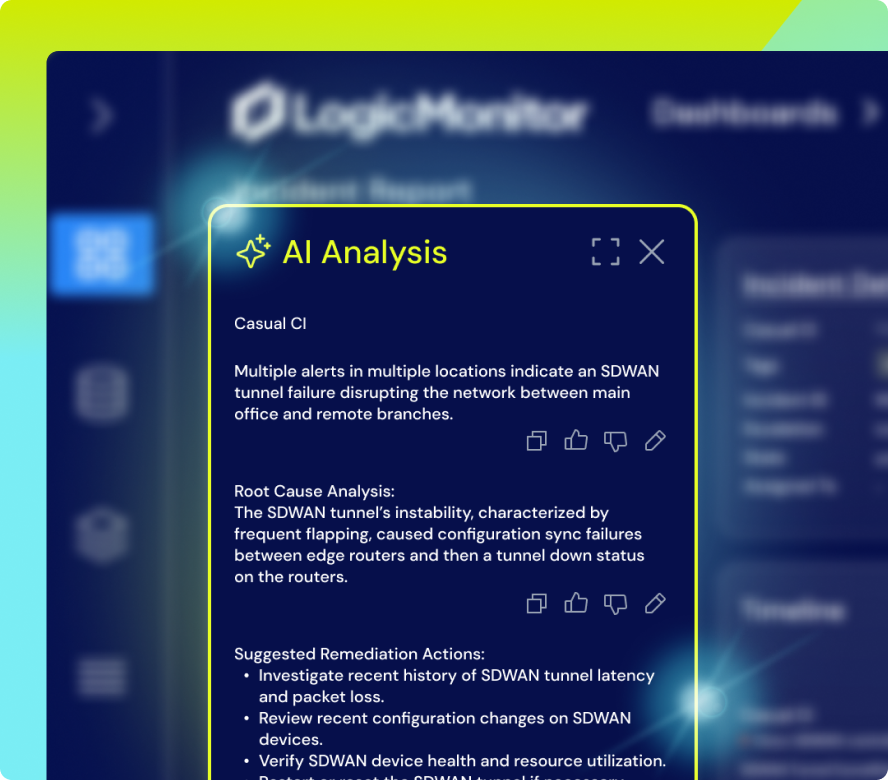
Built-in intelligence correlates alerts and surfaces what matters, so your team can act faster.
Identify the most likely cause of issues automatically with Edwin AI, your AI agent for ITOps.
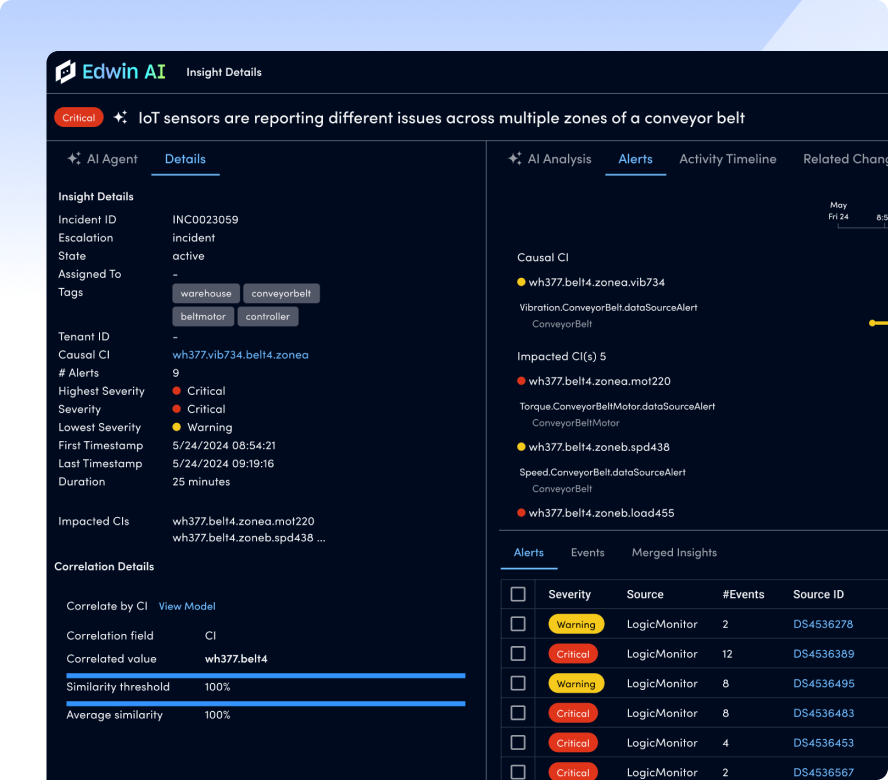
Correlate data across sources to get full-stack visibility and faster incident response.
Predict and prevent issues before they impact users with proactive insights and forecasting.
LOGICMONITOR BY THE NUMBERS
Get more from your team—and your data.
LM Envision Platform
Extend visibility and control across your infrastructure, applications, and services.
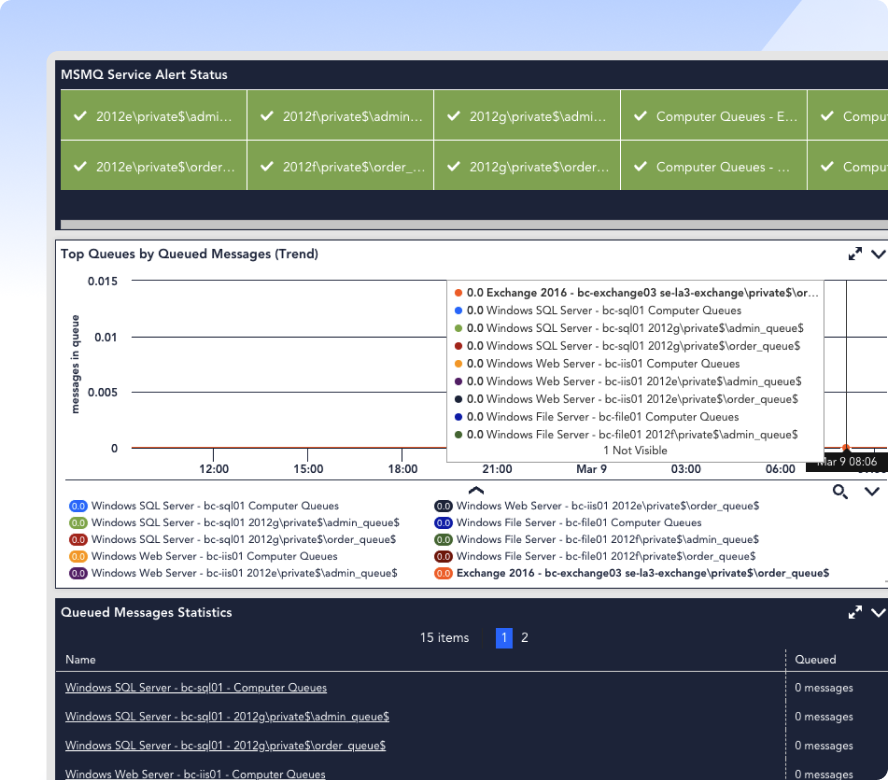
Auto-discover and monitor servers, networks, storage, and more.
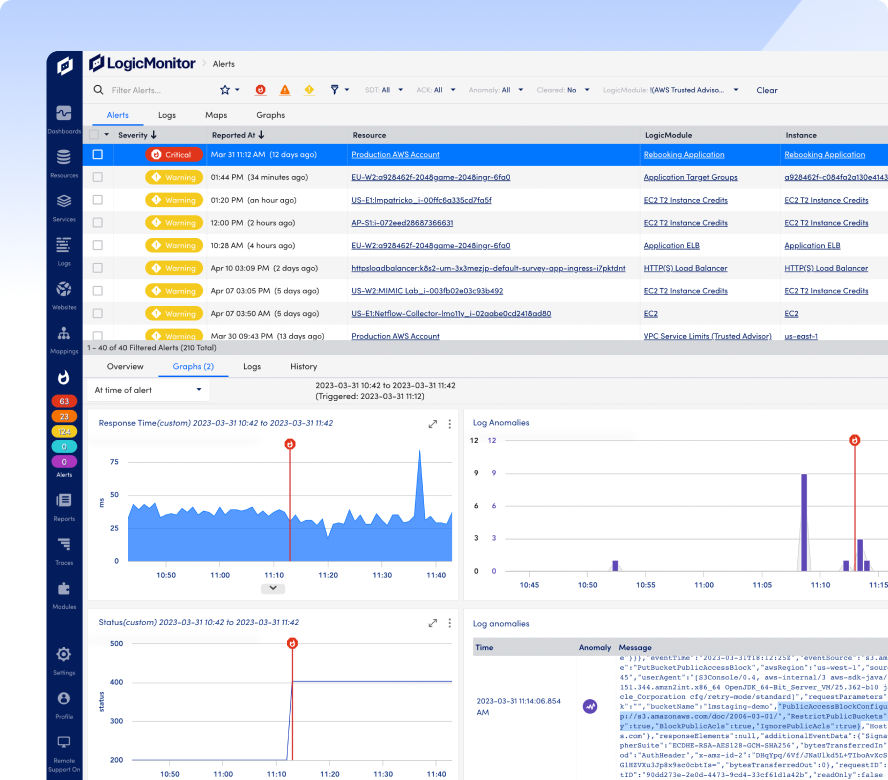
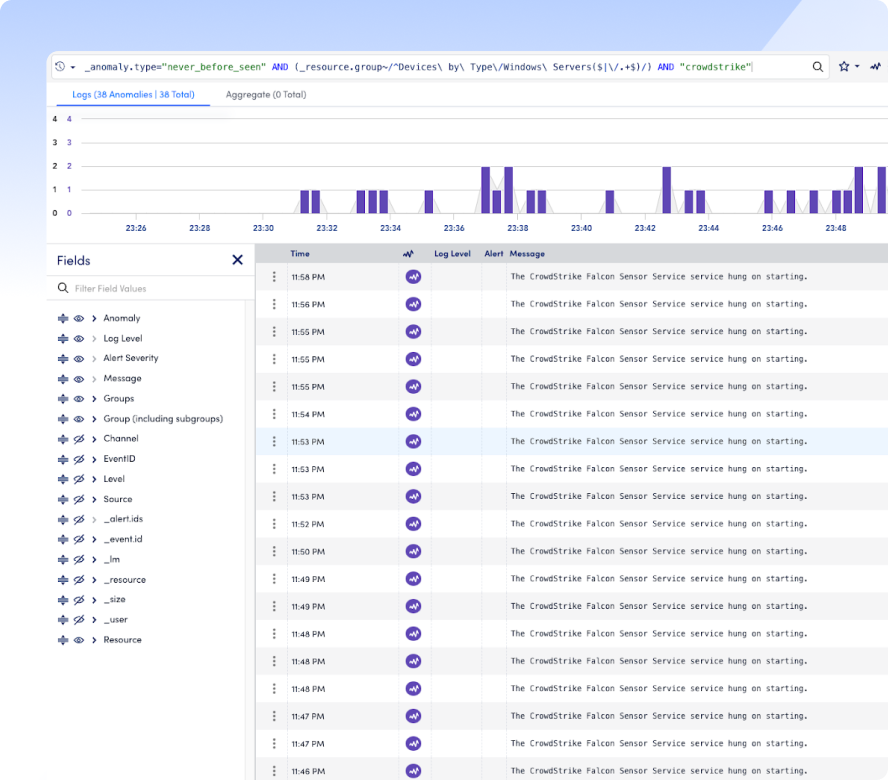
Correlate logs and metrics to accelerate troubleshooting.
Accelerate root cause analysis with agentic AIOps.
Complete observability for AWS, Azure, GCP, and Kubernetes.
Get Answers
Yes! Try LogicMonitor free for 30 days with personalized onboarding.
Start free trialWith 3000+ integrations, LM Envision monitors everything from legacy infrastructure to modern cloud-native stacks.
See supported integrations