For DevOps Teams
Improve Development Teams and Enable Fearless Deployments
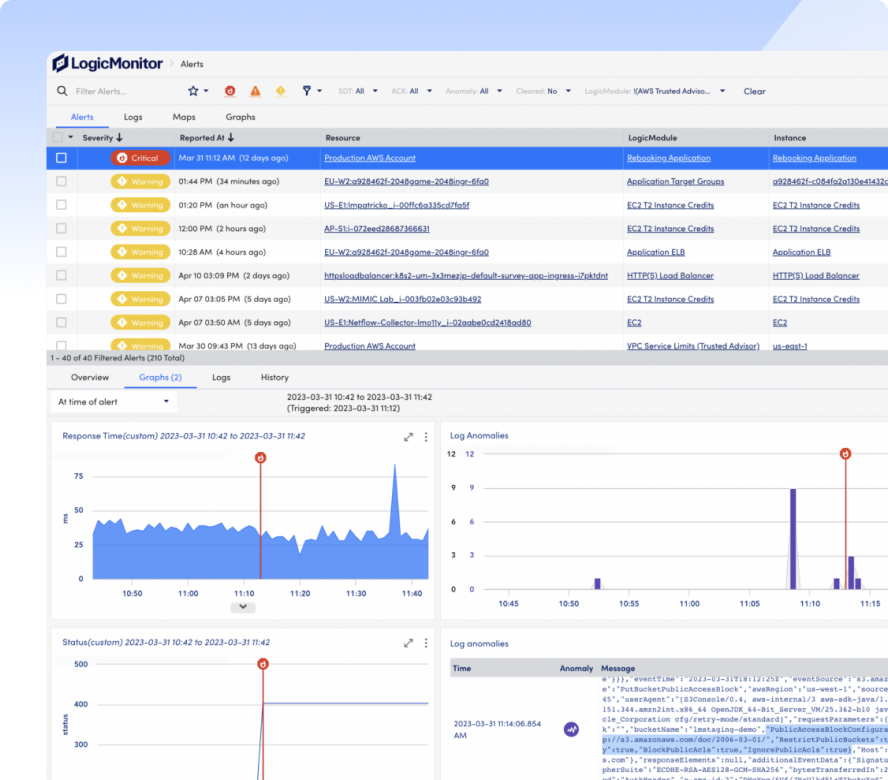
Go beyond traditional resource level performance and availability data. LogicMonitor provides visibility into all of the components that potentially impact the health of your AWS-backed infrastructure and services.