When an alert fires, your goal is clear: fix the problem—fast. But traditional troubleshooting rarely makes that easy. You’re immediately thrown into decision mode:
- Do I remote into the device? Reboot it? Restart services?
- Do I even have access?
- Are logs available in a tool or buried on the system?
- Do I know the query language?
- Do I log a ticket for another team to step in?
All the while, the clock is ticking. The longer you’re stuck guessing what to do next, the longer your downtime drags on, and the more non-value-added engineering time you burn.
LogicMonitor Logs changes this by automatically correlating your logs with the exact metrics, resources, and alerts that triggered the issue, so you’re not starting from scratch.
You’ll see the logs in context, right where the problem occurred, alongside performance trends and system behavior.
And instead of wading through noise, LM Logs surfaces what stands out: rare anomalies, sudden spikes, and machine-learned patterns that haven’t been seen before. It’s observability with built-in intelligence designed to show you why something happened, not just that it did.
Once you’ve got the right data in front of you, the next step is knowing what to do with it.
Let’s walk through a structured workflow designed to accelerate troubleshooting and improve Mean Time to Resolution (MTTR).
Step 1: Quickly Access the Situation in the Overview Tab
When an alert fires, your first task is to gather context fast. Start at the Overview tab in LogicMonitor to immediately grasp the key facts about what happened:
- Alert Summary: See exactly which resource triggered the alert, what metric crossed the threshold, and the severity (Warning, Error, Critical).
- Triggered Time: Note precisely when the issue started—critical for correlation with system changes or deployments.
- Current Status: Confirm quickly whether the issue is active, acknowledged by your team, or already cleared.
- Affected Resource: Identify immediately the specific device, service, or instance causing trouble.
- Thresholds & Values: Clearly view the actual values that exceeded normal limits to pinpoint the immediate problem.
- Escalation Chain & Notifications: Verify who’s aware of the issue, what’s already been done, and what escalation procedures are in place.
- Recent Alert History: Quickly spot recurring patterns or previous occurrences to understand the broader context of the issue.
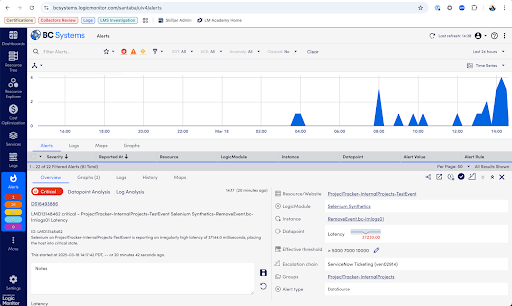
This overview equips you quickly with critical details, guiding your next troubleshooting steps.
Step 2: Explore Performance Trends and Metrics in the Graphs Tab
Now it’s time to dig deeper into how this alert fits into your performance history. Use the Graphs tab to visualize what’s going on:
- Time-Series Graphs: Check performance over time around the moment the alert was triggered. Was this a sudden spike or a gradual build-up?
- Threshold Indicators: Clearly see exactly where and when the thresholds were crossed, providing clarity around the event timeline.
- Zoom & Time Range Controls: Expand or narrow your time window to better spot trends or critical moments.
- Multiple Metric Overlays: Add related metrics to your graph view to see if there’s a correlated impact or cascading failure.
- Comparisons to Normal Behavior: Quickly determine if what you’re seeing is a unique event or part of an ongoing trend or pattern.
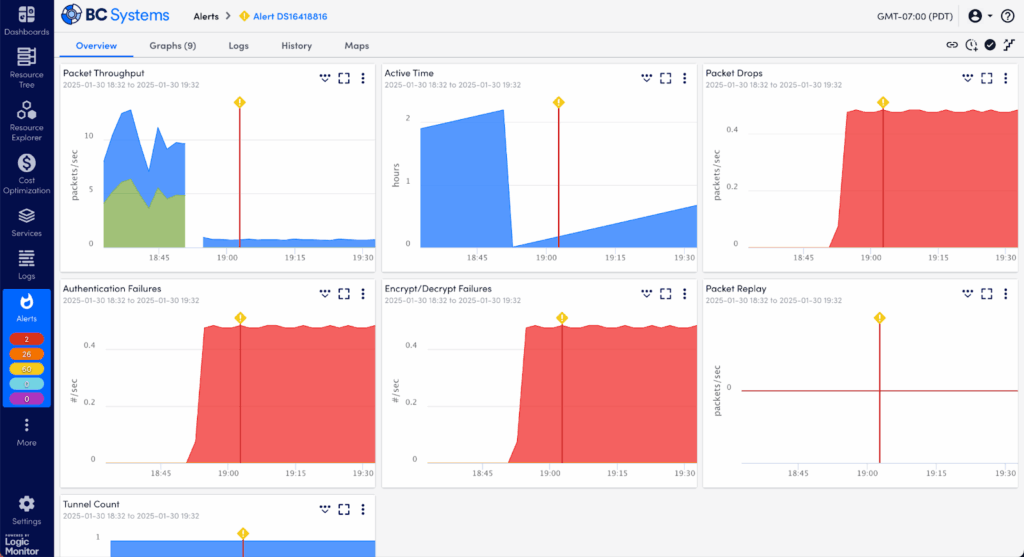
Graphs give visual context but may not fully explain why something occurred—that’s our next step.
Step 3: Identify Log Anomalies in the Graphs Tab – Log Anomalies Section
Logs often hold the clues to what metrics alone can’t reveal. Scroll to the Log Anomalies section at the bottom of the Graphs tab to investigate further:
- Purple Anomaly Columns: These visually highlight logs that LogicMonitor’s AI flags as unusual—events that the system hasn’t typically seen.
- Note the precise timing of these log spikes relative to your alert—do they align closely with the issue?
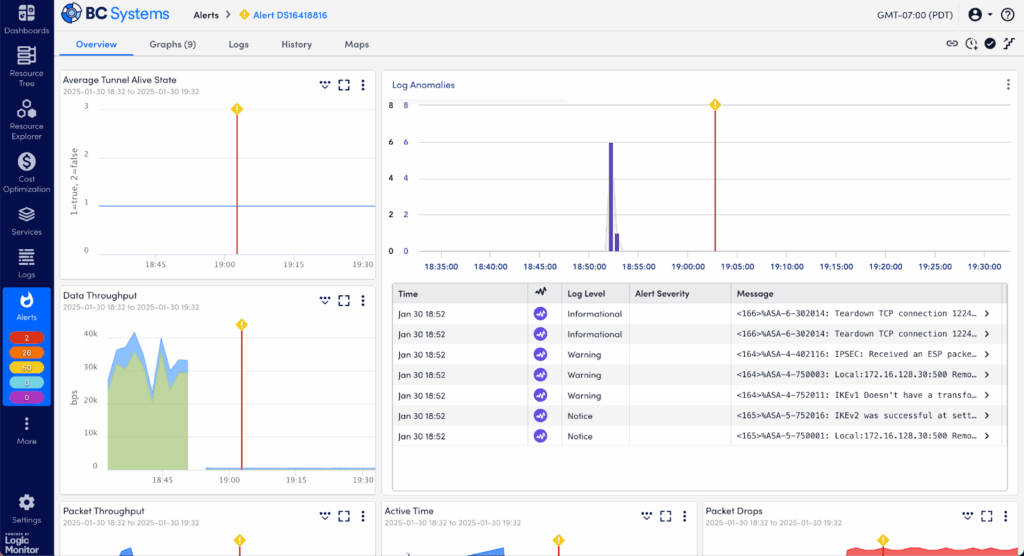
Log anomalies frequently uncover hidden or less obvious causes of performance problems, helping you narrow down quickly.
Step 4: Deep-Dive into Raw Logs in the Logs Tab
If anomalies are intriguing but you still need more details, dive into the full log data:
- Switch to the Logs tab and change the view from “Log Anomalies” to “All Logs.”
- Confirm you’re viewing logs within the exact timeframe of your alert.
- Use search and filtering options to sift through logs by keywords, severity (error, critical, warning), or timestamp to surface relevant entries quickly.
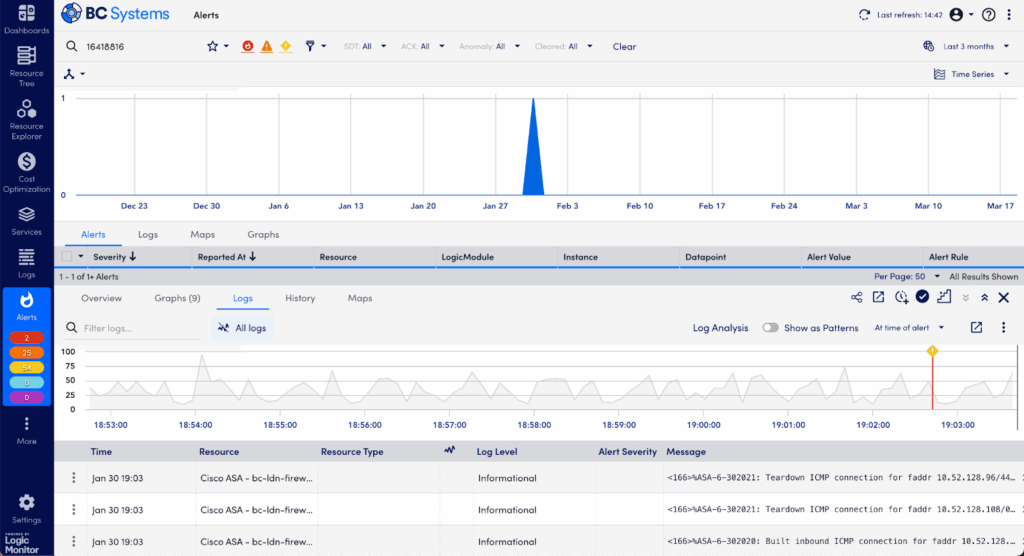
Raw logs often contain detailed error messages, stack traces, or specific configuration warnings that give clear indicators of the root cause.
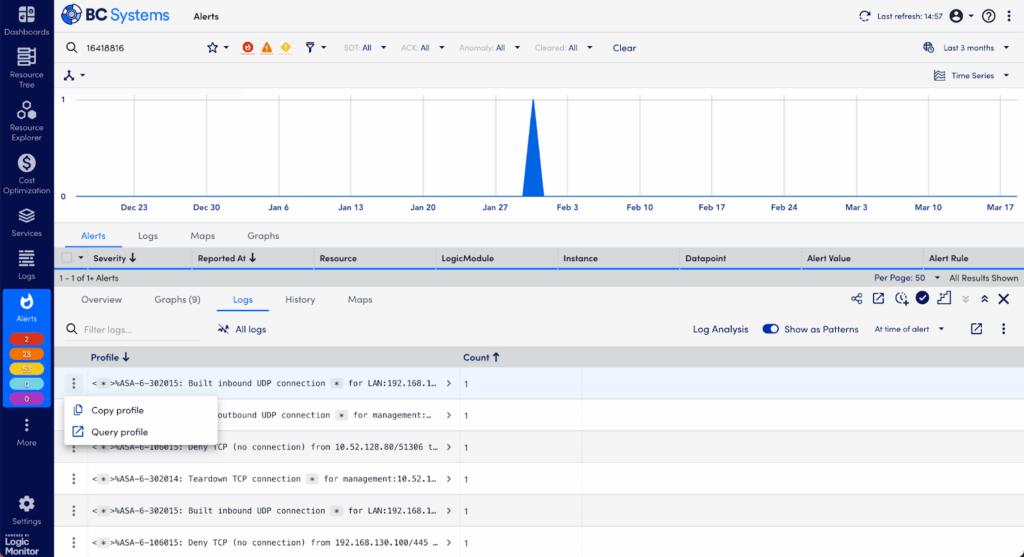
Step 5: Simplify Log Investigation with Log Patterns in the Logs Tab – Patterns View
Too many logs to read? LogicMonitor Envision helps by identifying recurring patterns automatically:
- Toggle “Show as Patterns” to group similar logs together—significantly simplifying the data.
- Sort patterns by lowest frequency—rare patterns often signal unique or highly specific issues. (Conversely, frequent logs often represent background “noise.”)
- Identify unusual log patterns or messages that occurred near the alert time, pointing you closer to root-cause identification.
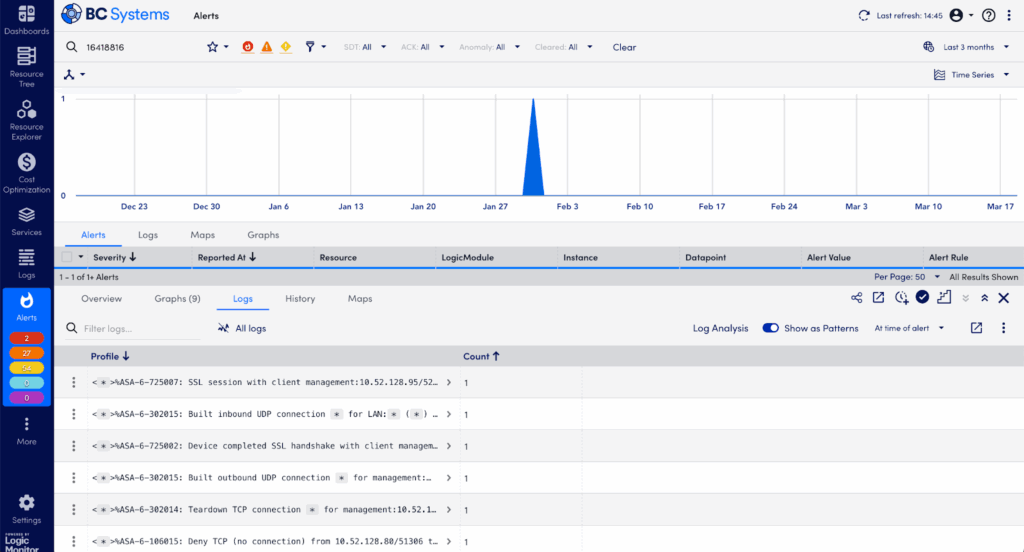
Using patterns efficiently cuts through noisy logs, quickly revealing meaningful insights.
Step 6: Deepen Your Insight with Automated Log Analysis
If you still need more clarity, LM Logs’ Log Analysis feature surfaces critical log insights instantly, without complex queries or deep log expertise:
- Click into Log Analysis within LM Logs to trigger automatic, AI-driven analysis.
- Review logs automatically ranked by “Sentiment Scores,” which quickly identifies logs most likely causing or related to your problem.
- Easily drill down into these high-sentiment logs, revealing clear, actionable insights without extensive manual effort.
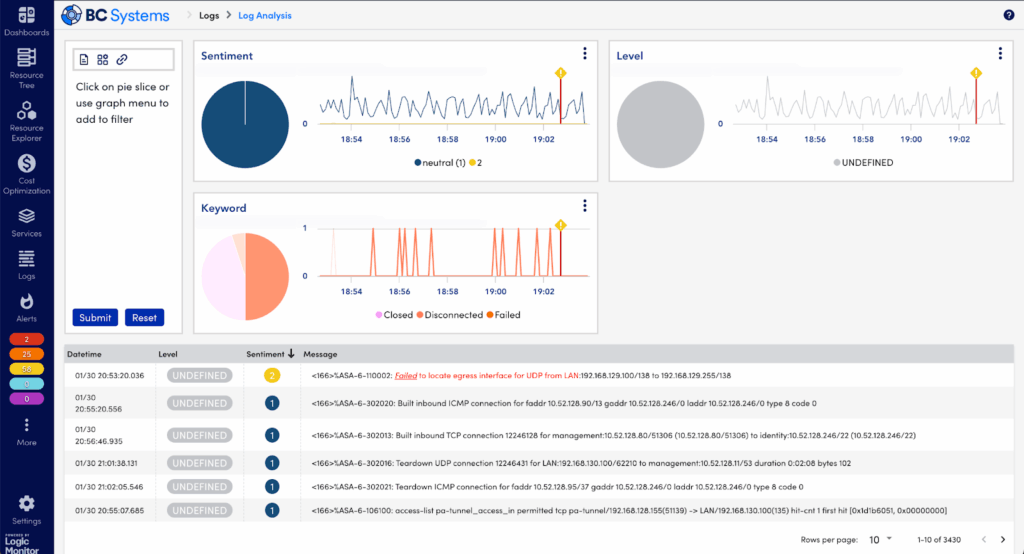
Log Analysis transforms traditional troubleshooting, eliminating guesswork and significantly speeding issue identification.
Step 7: If Necessary, Extend Your Investigation
Sometimes your issue may need a deeper investigation across broader logs or historical data:
- Click “Open Logs in new tab” directly from your current view. LM Logs automatically retains your alert’s timeframe and resource context—no wasted time re-entering filters.
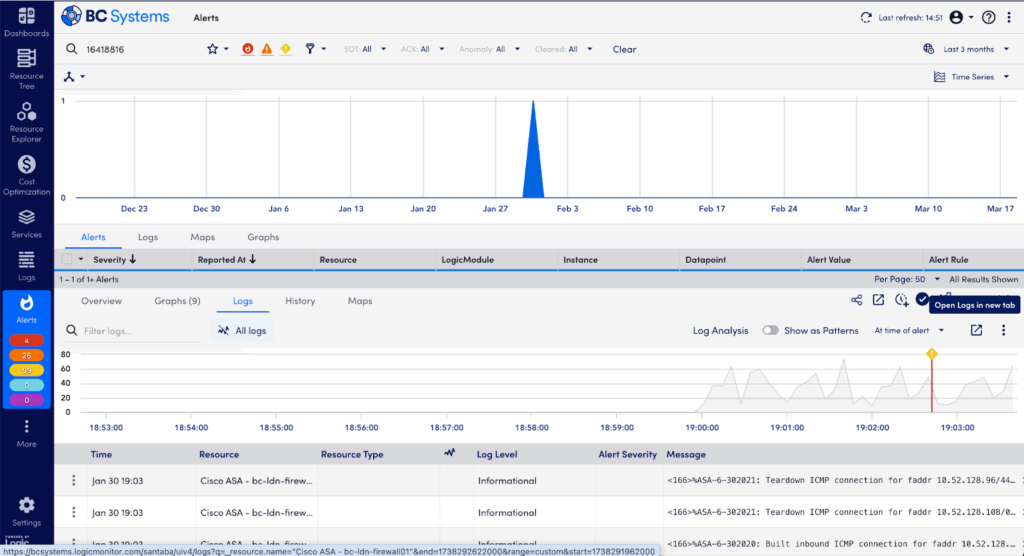
- Refine your search further with additional keywords, syntax, or extended date ranges for a more comprehensive analysis.
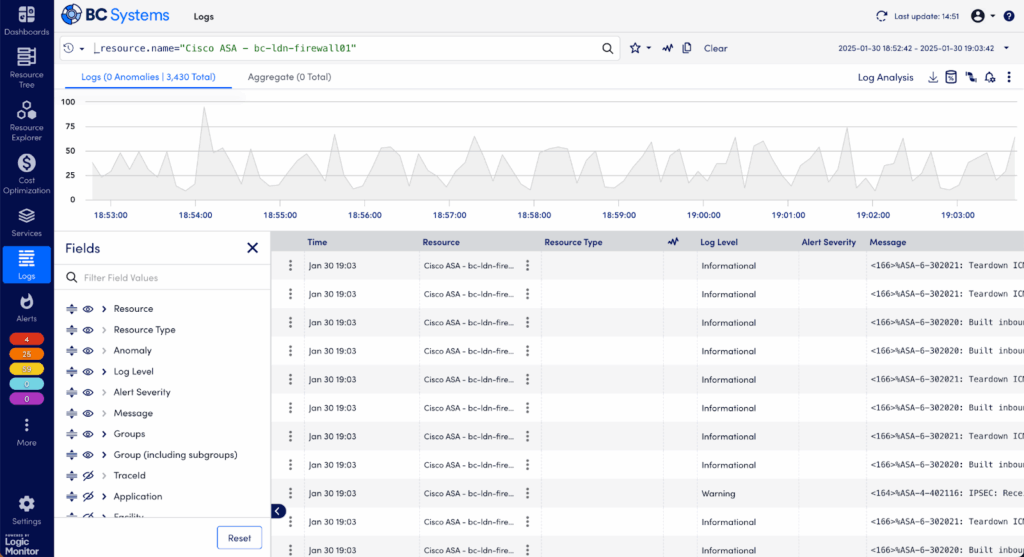
- Save helpful queries for faster troubleshooting next time this issue appears.
Troubleshooting with LM Logs: Reduce MTTR From Hours to Minutes
LogicMonitor’s structured workflow takes you far beyond traditional monitoring, enabling rapid, proactive troubleshooting. By seamlessly combining metrics, events, logs, and traces, LM Logs not only accelerates your response time but also gives your team the ability to understand why problems occur, so you can prevent them altogether.
Embrace this structured approach, and you’ll significantly cut downtime, enhance reliability, and confidently manage your complex environments with greater ease and precision.