
LogicMonitor vs. Virtana Service Observability
LogicMonitor helps IT teams turn hybrid observability into faster, clearer action. With Edwin AI, broad out-of-the-box coverage, transparent hybrid-resource packaging, and Internet Performance Monitoring, teams can reduce alert noise, keep monitoring coverage current, and trace issues beyond infrastructure into the external services, networks, and Internet paths that shape user experience.

Why IT teams choose LogicMonitor

LogicMonitor

LogicMonitor

Virtana
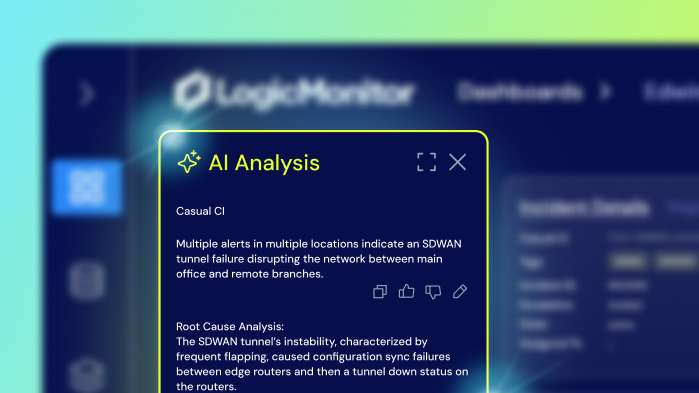
Edwin AI deduplicates, correlates, groups, and prioritizes events into contextual incidents, then adds investigation context and next-step guidance so teams can move from signal to response faster.
Virtana uses service modeling, dependency mapping, anomaly detection, and predictive analytics to identify affected services and support root-cause analysis.
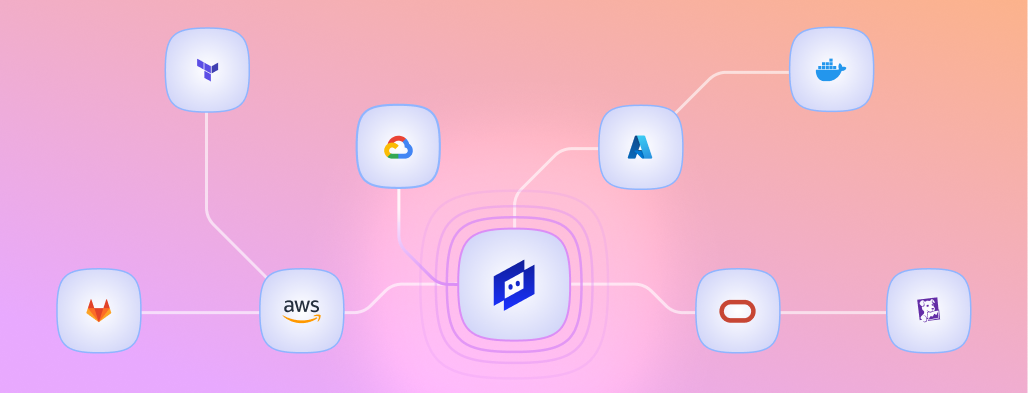
LogicMonitor’s LogicModule library accelerates coverage across hybrid infrastructure, cloud, network, storage, containers, applications, ITSM, workflows, and digital experience.
Virtana cites 400+ to 500+ integrations plus ZenPacks. Where coverage is not already available, public materials point to collectors, agents, APIs, SDK work, or Professional Services.
LogicMonitor extends observability beyond owned infrastructure into DNS, CDN, ISP, BGP, SaaS, cloud edge, and end-user experience from the world’s largest independent global observability network, with thousands of global vantage points.
Virtana documents service modeling, infrastructure monitoring, and synthetic transactions, but public materials do not show comparable Internet Stack visibility across global dependency paths.
LogicMonitor publishes platform packages, Hybrid Unit pricing, included capabilities, add-ons, and a 15-day trial so teams can plan coverage before a sales conversation.
Virtana routes buyers to request a demo. Zenoss Cloud documentation describes managed-resource tiers, datapoint rates, user limits, retention, and add-on subscriptions.
LogicMonitor unifies hybrid infrastructure, applications, services, workflows, and Internet Performance Monitoring so teams can troubleshoot across owned and external dependencies in one place.
Virtana offers Global View across multiple observability modules, including Service, Infrastructure, Application, Container, AI Factory, and Cloud Cost Management.
LogicMonitor Active Discovery helps keep monitoring current as infrastructure, cloud resources, interfaces, volumes, and services change.
Virtana builds real-time models through Collection Zones, connectors, ZenPacks, agents, streaming data, and APIs, which teams map by technology area.
See why teams choose LogicMonitor over Virtana
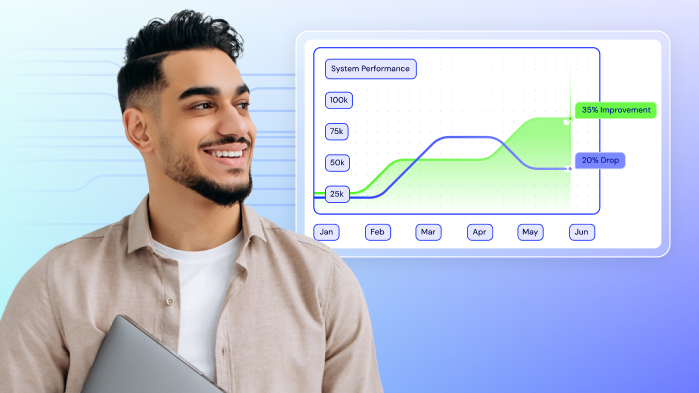



Trusted by IT teams Everywhere
Monitoring teams are moving away from legacy, manually tuned, and fragmented toolsets toward SaaS-based, AI-powered hybrid observability. LogicMonitor helps that shift by combining infrastructure, cloud, logs, services, workflows, and Internet Performance Monitoring in one platform, with Edwin AI adding correlation, noise reduction, and guided incident context.

Don’t just take our word for it
Hear from our customers
LogicMonitor customers reduce alert noise, speed up incident response, and simplify operations across complex hybrid environments.
“Edwin AI cut noise by 90% & ITSM incidents by 76%, enabling better customer service.”

“Edwin AI delivered value within an hour of implementation.”

“Edwin AI has given us hours back in the day so that we can concentrate more on meaningful work like future projects and improvements.”

FAQs
Still have questions? Our team is here to help you compare options, walk through a demo, or guide your transition from SolarWinds to LogicMonitor.
Is Virtana Service Observability the same as Zenoss?
Virtana acquired Zenoss in May 2025. Virtana documentation describes Virtana Service Observability as formerly Zenoss Cloud, while Zenoss Service Dynamics became Virtana Service Dynamics.
How does LogicMonitor help teams migrate from Virtana / Zenoss?
LogicMonitor gives teams automated discovery, collector-based data collection, more than 3,000 integrations, prebuilt dashboards, alerting workflows, and ServiceNow integration options. A migration should still map existing ZenPacks, service models, alert rules, and ITSM workflows before cutover.
How does LogicMonitor reduce observability complexity?
LogicMonitor combines SaaS delivery, lightweight collectors, automated discovery, broad prebuilt integrations, and transparent hybrid-resource packaging to help teams scale coverage without owning more monitoring infrastructure than necessary.
How is Edwin AI different from traditional AIOps?
Edwin AI is built for ITOps workflows: it correlates events, reduces noise, summarizes context, supports root-cause investigation, and guides incident response. LogicMonitor also publishes recent third-party and customer evidence showing measurable reductions in alert noise, incident volume, RCA effort, and MTTR.
Does LogicMonitor show Internet and external dependency issues?
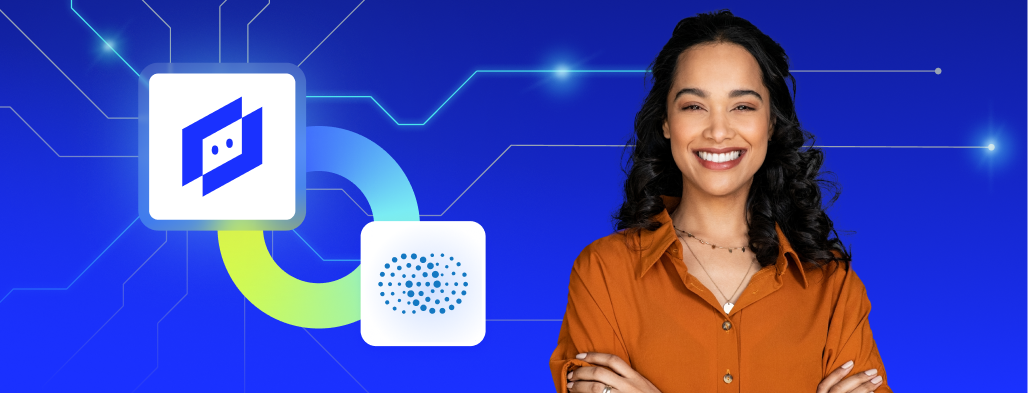
Yes. LogicMonitor Internet Performance Monitoring, powered by Catchpoint, extends visibility across DNS, CDN, BGP, SaaS, APIs, cloud, edge, network paths, and user experience so teams can identify whether an issue starts inside the environment or outside it.
Simple, transparent pricing that scales with your environment
LogicMonitor publishes platform packages and Hybrid Unit pricing so teams can plan observability coverage across infrastructure, cloud, containers, logs, services, workflows, and Internet Performance Monitoring with fewer surprises.

All third-party trademarks, product names, and company names are the property of their respective owners and are used for identification purposes only. No affiliation, sponsorship, endorsement, or approval by Virtana, Gartner, G2, or any other third party is implied.
