Picture this: Your dashboards are calm. CPU load is steady. Error rates are low. Everything looks fine. That is, until the alarms go off. Now what?
Metrics tell you something’s wrong, but not what, where, or why. They reveal symptoms, not root causes, and in high-stakes environments, that’s only half the story.
Say your API response times spike. Metrics raise the flag, but they don’t tell you if it’s a code deployment, a database hang, or a traffic surge.
That’s where logs step in. Logs provide the full context, including who triggered what, when it occurred, and how it unfolded. And by surfacing anomalies and patterns automatically, you zero in on the signal, not the noise, so you’re not chasing shadows or wasting time digging.
That’s real productivity gain right there: when the right data shows up at the right time, engineers troubleshoot faster, escalate less, and get to root cause without switching tools.
TL;DR: Metrics tell you what’s happening. Logs tell you why. You need both to troubleshoot faster and stay ahead of problems.
Metrics track system health at a glance: CPU spikes, error rates, latency trends.
Logs capture the full context behind every alert—events, errors, and behaviors in real time.
Together, they power faster root cause analysis, smarter incident response, and better uptime.
Centralized observability ties it all together, so you can troubleshoot in minutes, not hours.
The Smart Way to Use Logs and Metrics Together
Recognizing that logs and metrics both matter is just the start. The real advantage comes when you connect them in a single workflow.
When you do, you reduce risk by spotting issues before they escalate and boost productivity by minimizing busywork and manual effort during incident response.
Follow the Signals, Find the Story
When a metric crosses a threshold—say API latency spikes or CPU load surges—that’s your signal. A product like LM Logs automatically pulls in correlated logs from that moment. No searching, no query bar. Just instant visibility into the events and errors that explain what happened.
This isn’t just faster. It’s safer. You reduce the risk of prolonged outages or missed root causes because everything you need is right there, aligned, and in context.
Connect Events Across Complex Systems
In hybrid or microservice-heavy environments, issues rarely happen in isolation. One system hiccups, and five others feel it.
Metrics help you spot the surface-level impact. Logs reveal the deeper story, down to the error, configuration change, or service failure that triggered the issue.
With LM Envision, metrics and logs are unified, so your team doesn’t have to jump between tools or hand off investigations to someone else. That’s time saved and fewer delays, especially in high-pressure scenarios.
Cut MTTR with a Two-Step Process
Start with metrics: spot the issue fast.
Dive into logs: see what happened, where, and why.
With LM Logs automatically surfacing anomalies and patterns, you avoid combing through thousands of lines or escalating to senior engineers just to ask, “What changed?”
The result is lower MTTR, higher confidence, and less risk of missing something critical.
Faster Root Cause Analysis, Fewer Fire Drills
When a service crashes or users can’t log in, you need answers fast. Unified metrics and logs eliminate the need to bounce between tools or write complex queries under pressure. Here’s how teams that connect their observability data move faster and smarter:
1. Detection
Metrics fire targeted, meaningful alerts the moment performance drops, not hours later. Instead of noisy alerts or false positives, you get focused signals tied to real system behavior.
2. Triage
Correlating metrics and logs gives you instant visibility into what’s happening behind the scenes, without digging through separate tools or stale data.
3. Diagnosis
Logs lay out the detailed chain of events leading to the issue, not just what failed, but how, when, and where. You can trace incidents across services, pinpoint the root cause, and see the full blast radius.
4. Resolution
The faster you find the true cause, the faster you fix it, and the faster you get your services (and users) back on track.
And here’s where team productivity really wins: when junior engineers can resolve alerts without escalation, your senior staff stays focused on innovation, not incident response.
Want faster incident response? Check out our webinar on logging solutions.
If metrics and logs live in separate tools, you’re still stitching together timelines and manually correlating data while downtime ticks on.
Centralized observability means:
No gaps in context
No lost time flipping between dashboards
No guessing which logs to pull
And that directly reduces business risk because the longer you spend investigating, the more impact your users (and your service-level agreements, or SLAs) will feel.
One Platform, Complete Observability
You shouldn’t have to fight your tools when every second counts. That’s why we built LogicMonitor Envision—a platform that unifies logs and metrics into a single, real-time view.
With LM Envision, your team can:
Correlate metrics and logs instantly
Detect anomalies faster with AI-powered insights
Cut root cause time and prevent issues before they spread
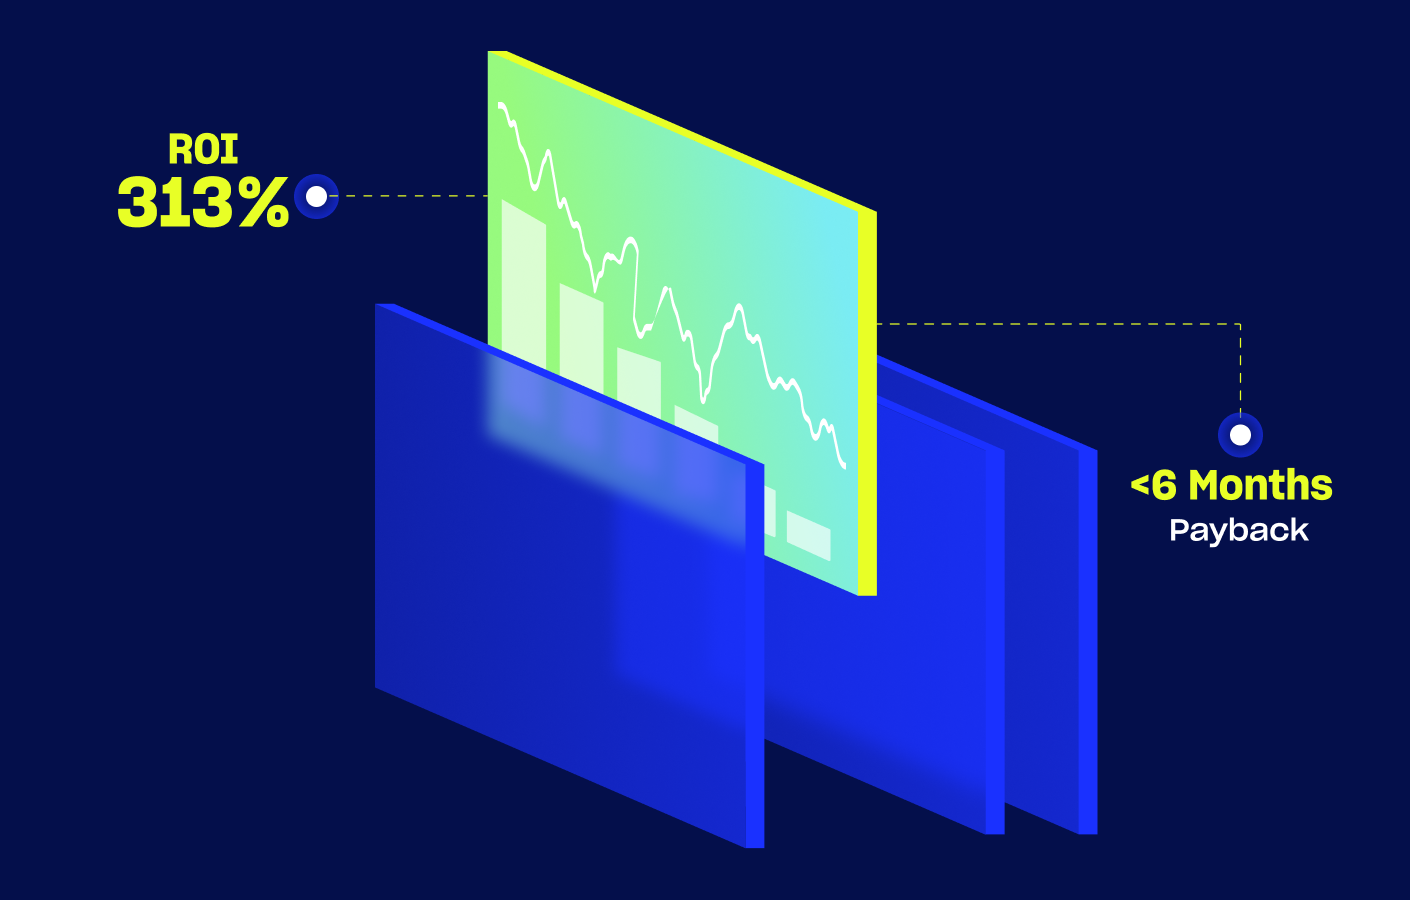
And it’s not just theory. After implementing LM Envision, Schneider Electric cut their MTTR and boosted alert accuracy by 40%, all by giving their teams faster access to the full story behind every alert.
Bring It All Together
Logs show the story. Metrics flag the signals. Together, they reduce risk, speed up investigations, and give your team time back to focus on what matters.
Get a unified view of your systems and a faster path to resolution.
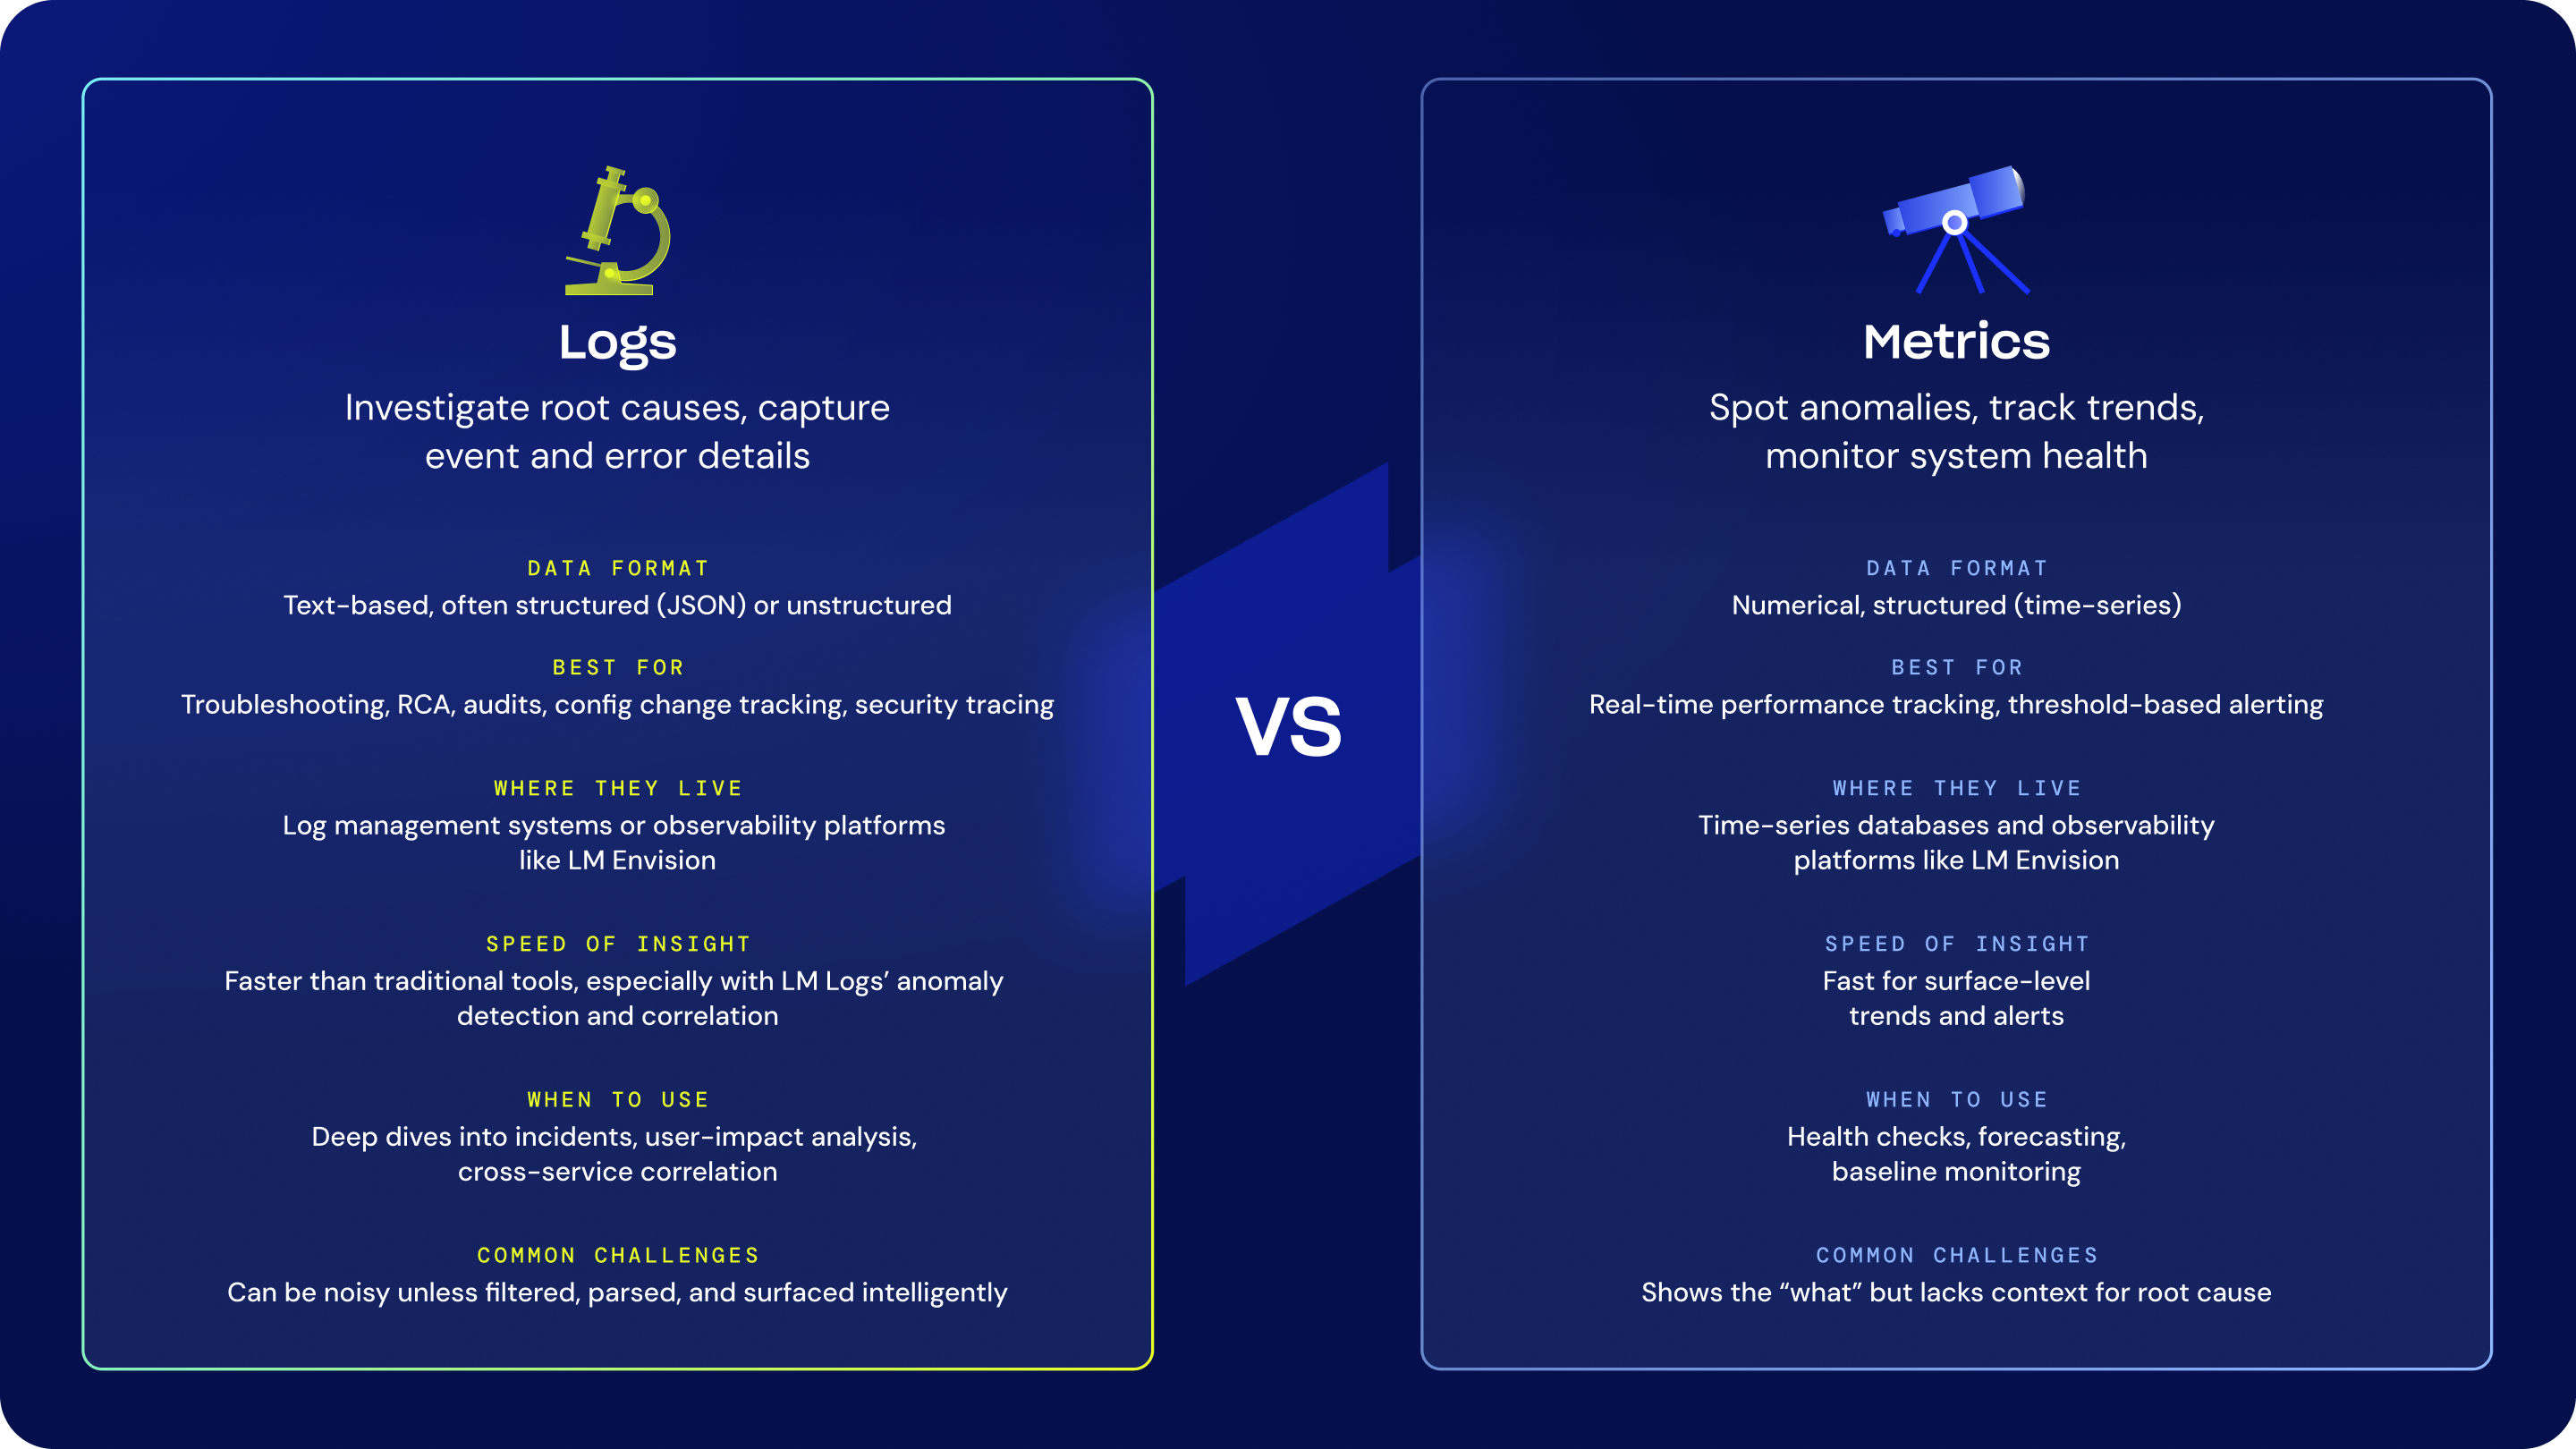
What’s the difference between logs and metrics in practice?
Metrics show performance trends over time, like CPU usage or request latency. Logs give you the specific events behind those trends, such as errors, configuration changes, or user activity.
What types of issues are better caught with metrics, and which with logs?
Use metrics to detect performance dips or anomalies. Use logs to trace the root cause, whether it’s a failed deployment, a restart, or a permission issue.
When should I use logs vs. metrics during an incident?
Start with metrics to spot what’s off. Then dive into logs to figure out what happened, why it happened, and how to resolve it. Metrics point you in the right direction. Logs give you the details.
When debugging a complex issue, where should I start—logs or metrics?
Begin with metrics to focus your investigation. Then check the corresponding logs for the specifics. If your platform connects the two (like LogicMonitor Envision does), you’ll get answers faster without digging blindly.
How do I decide which telemetry data to alert on, logs, metrics, or both?
Alert on metrics when thresholds are crossed, like high latency or CPU spikes. Use logs to confirm what triggered the issue and to alert on rare but critical events like security breaches.
What are the limitations of metrics due to aggregation or data loss?
Aggregated metrics can smooth over spikes or outliers. They’re great for trends but may miss the details. Logs fill in those gaps with a complete event history.
What are the risks of relying on logs too heavily?
Logs can get noisy and expensive fast. Without filtering or context, they make it harder to find what matters. That can slow down incident response instead of helping it.
Can I use logs and metrics together for capacity planning or forecasting?
Absolutely. Use metrics to track growth and usage patterns. Use logs to understand what caused those changes. Together, they give you a more accurate view for planning ahead.
By Patrick Sites
Product Architect of Logs, LogicMonitor
Subject matter expert in the Log Monitoring space with 25+ years experience spanning Product Management, Presales Sales Engineering and Post-Sales PS/Support Roles.
Disclaimer: The views expressed on this blog are those of the author and do not necessarily reflect the views of LogicMonitor or its affiliates.