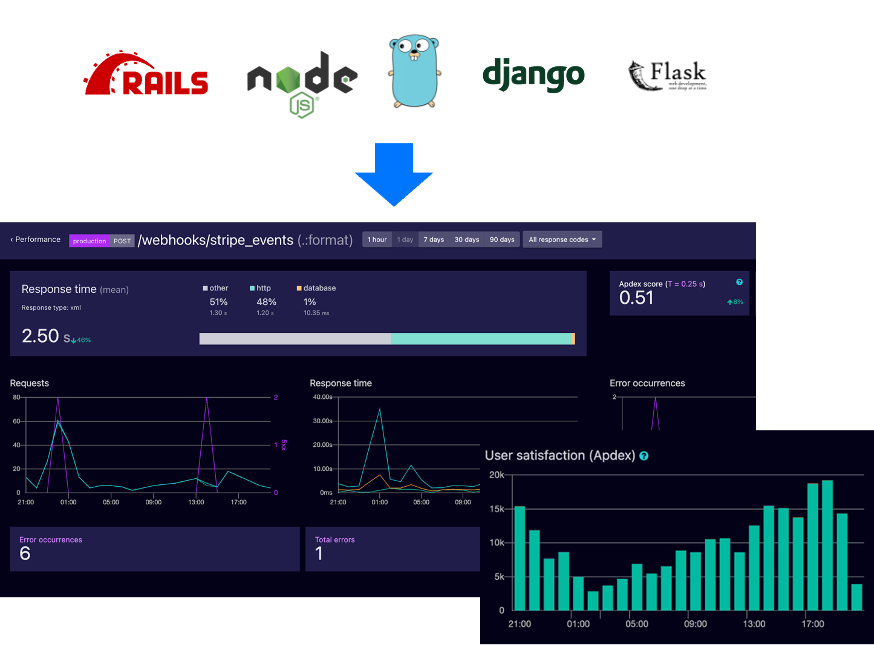
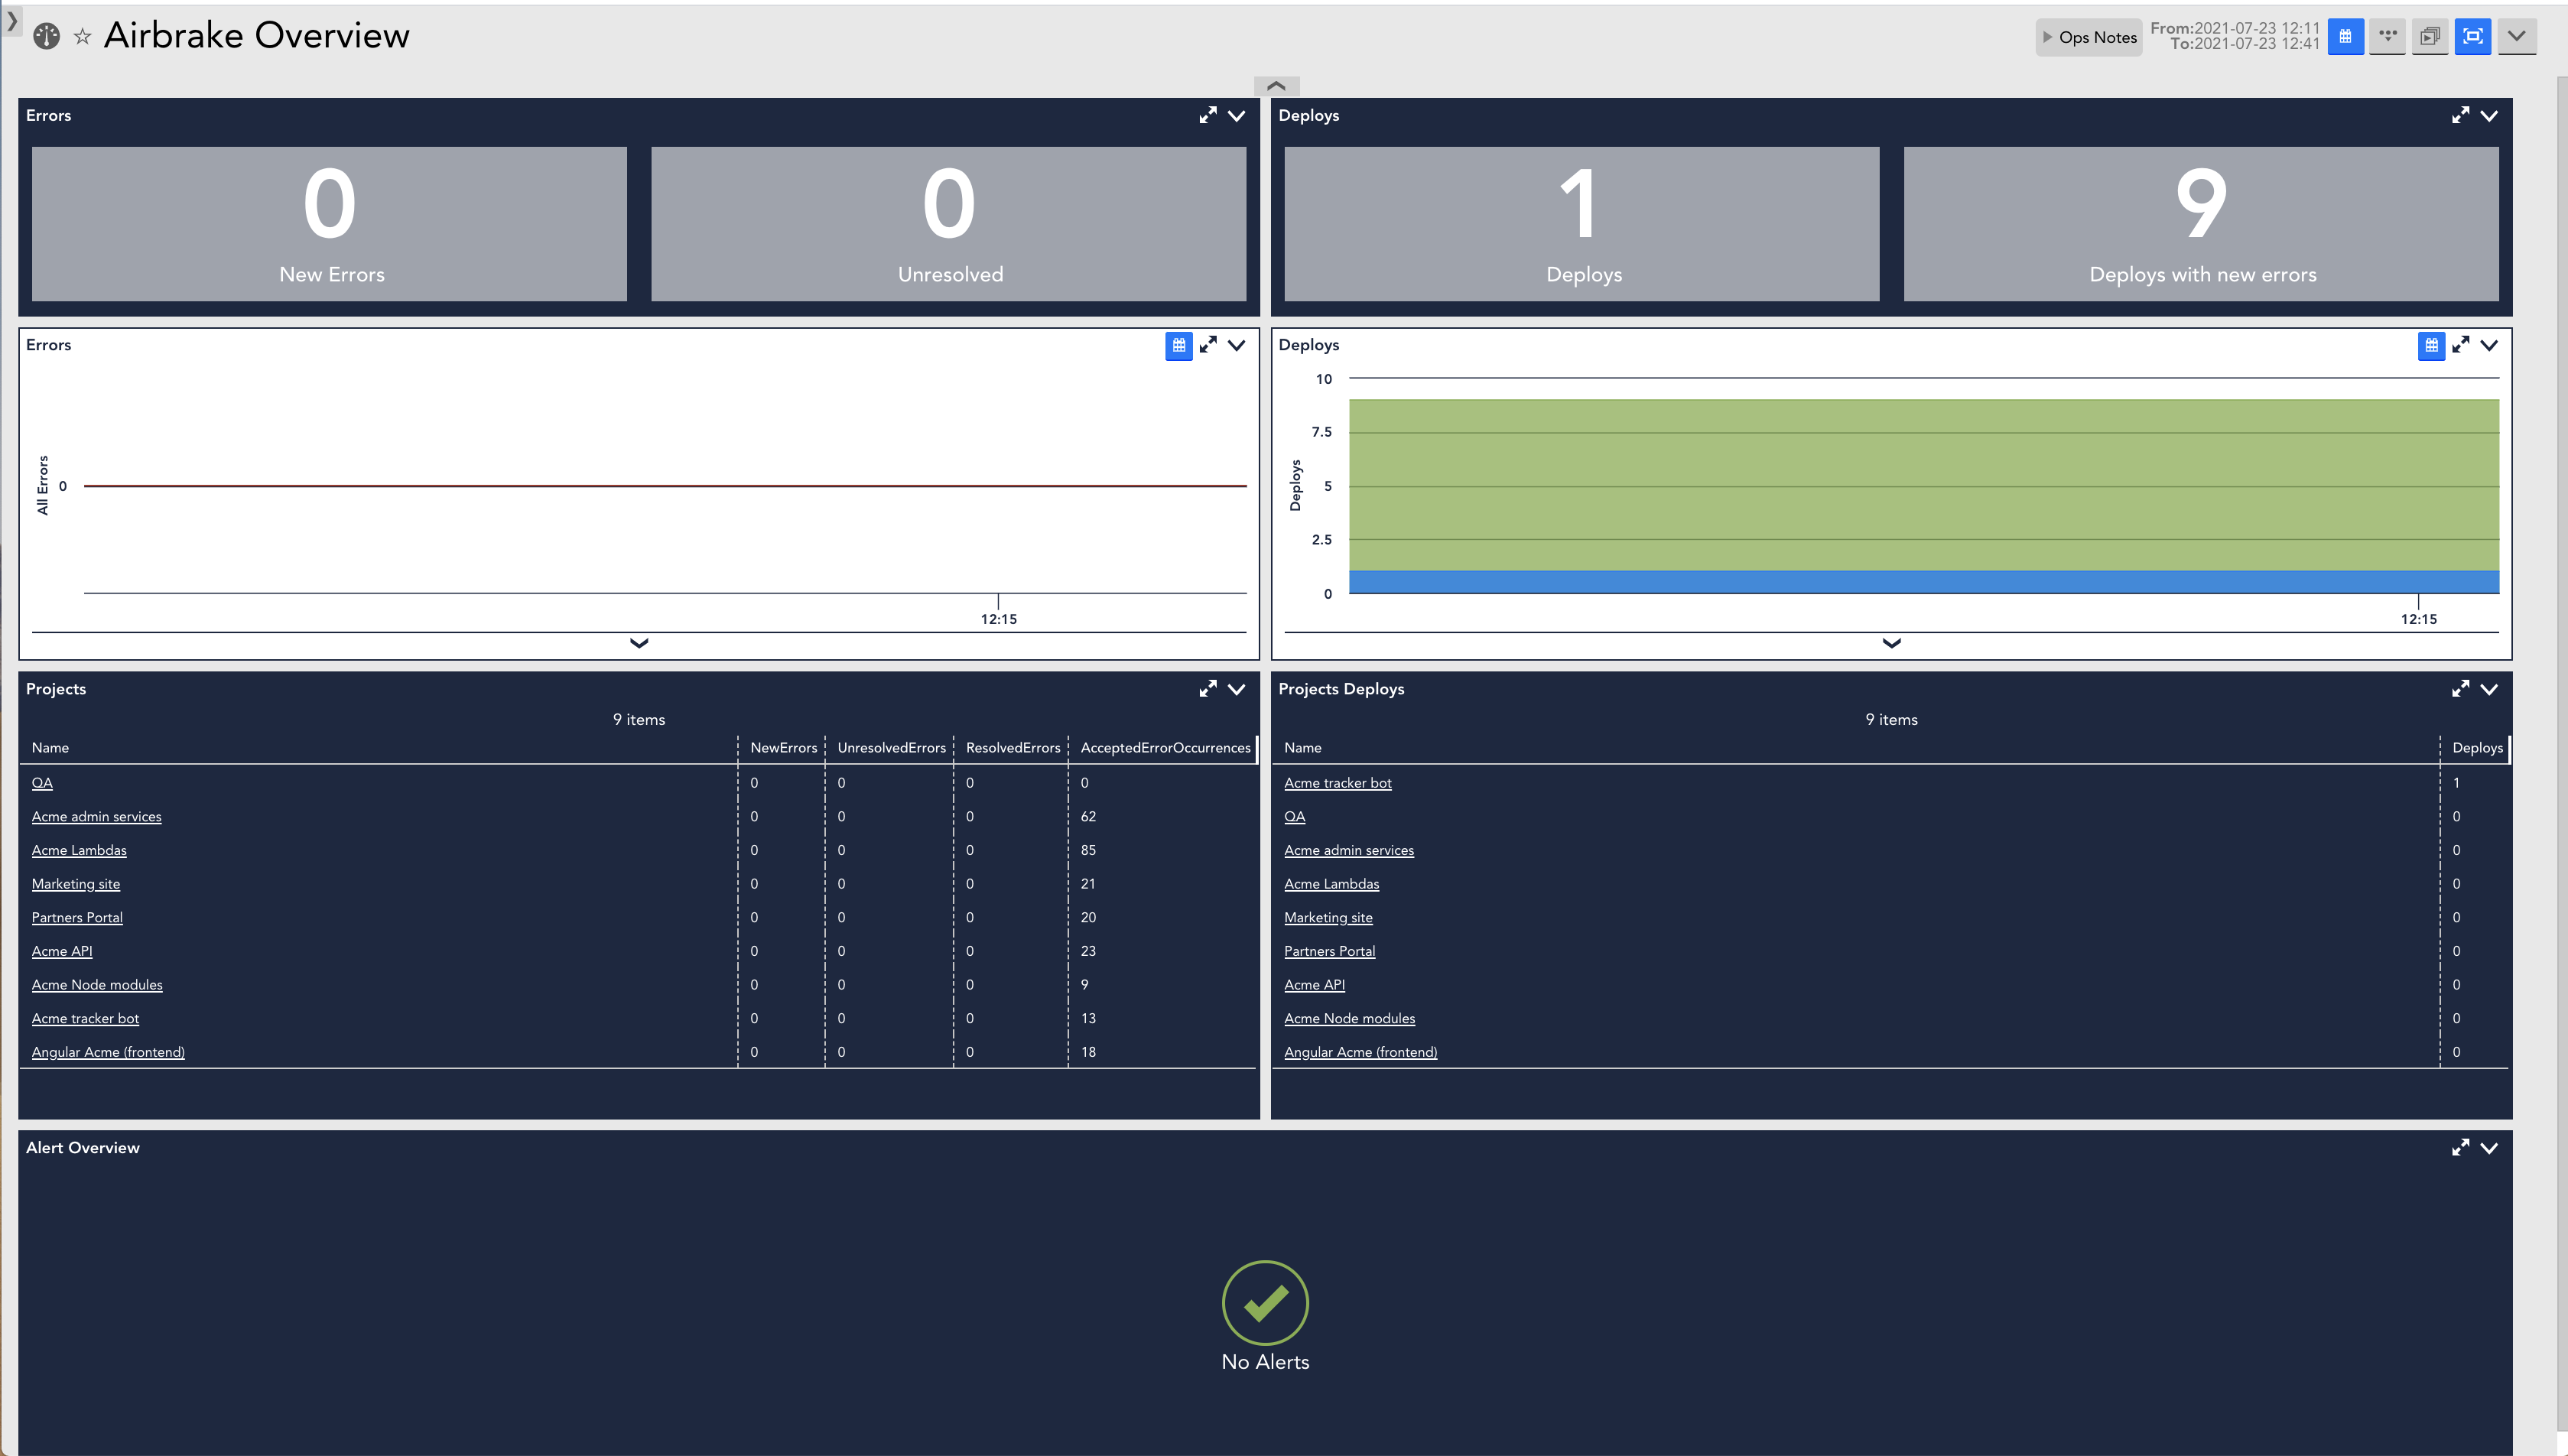
Airbrake: Error & Performance Monitoring
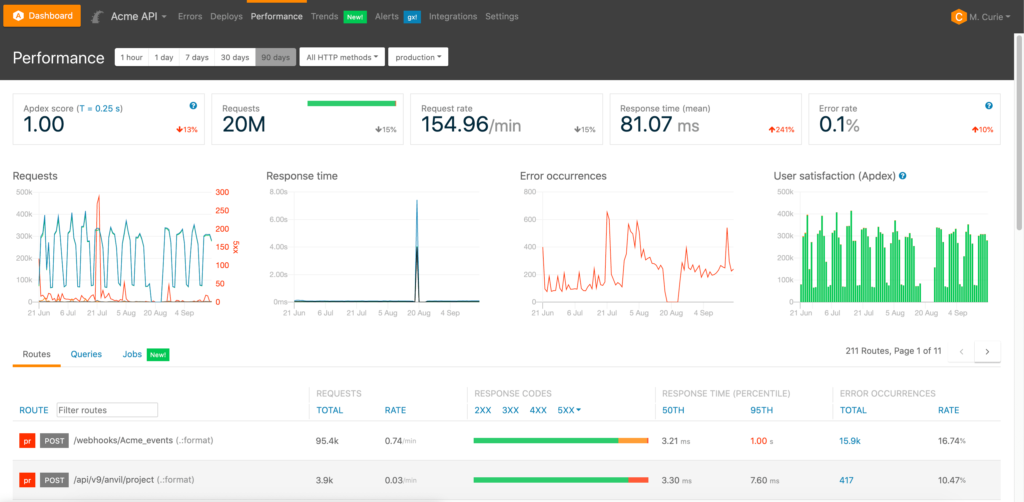
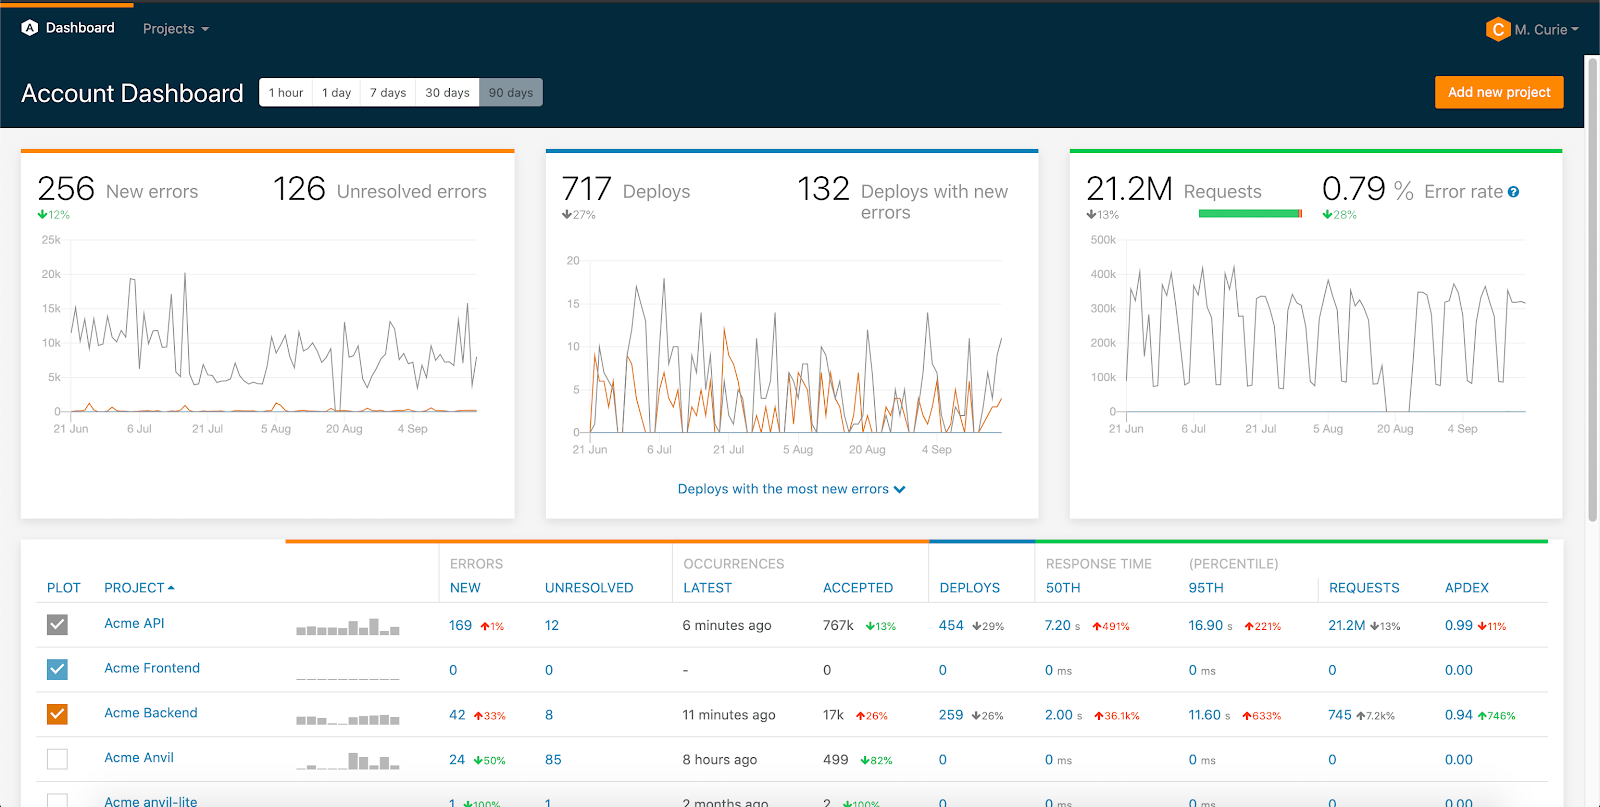
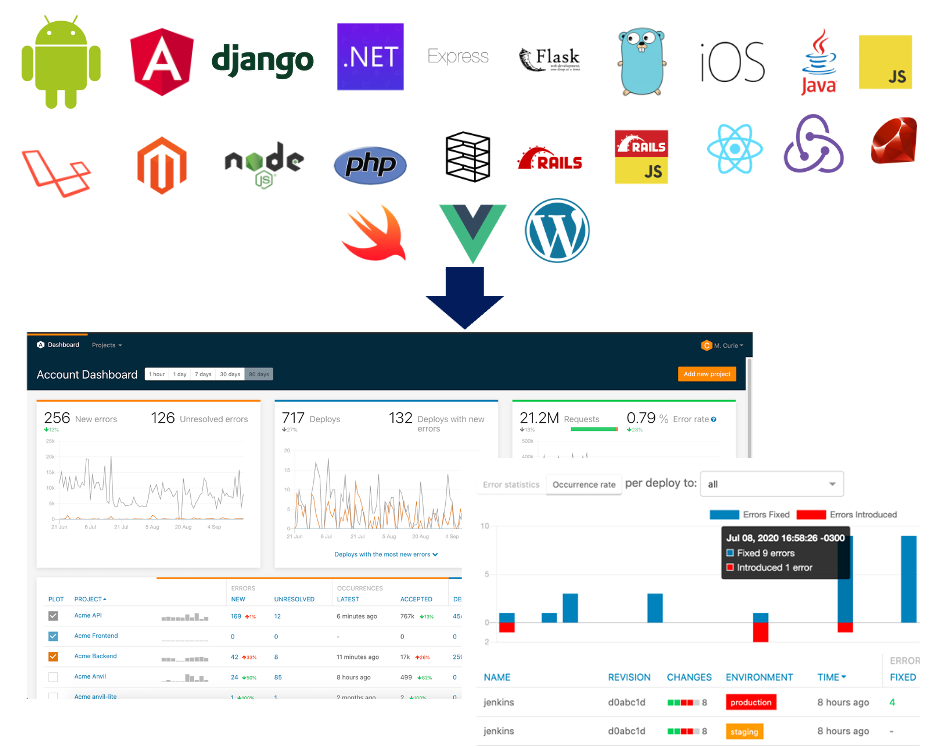
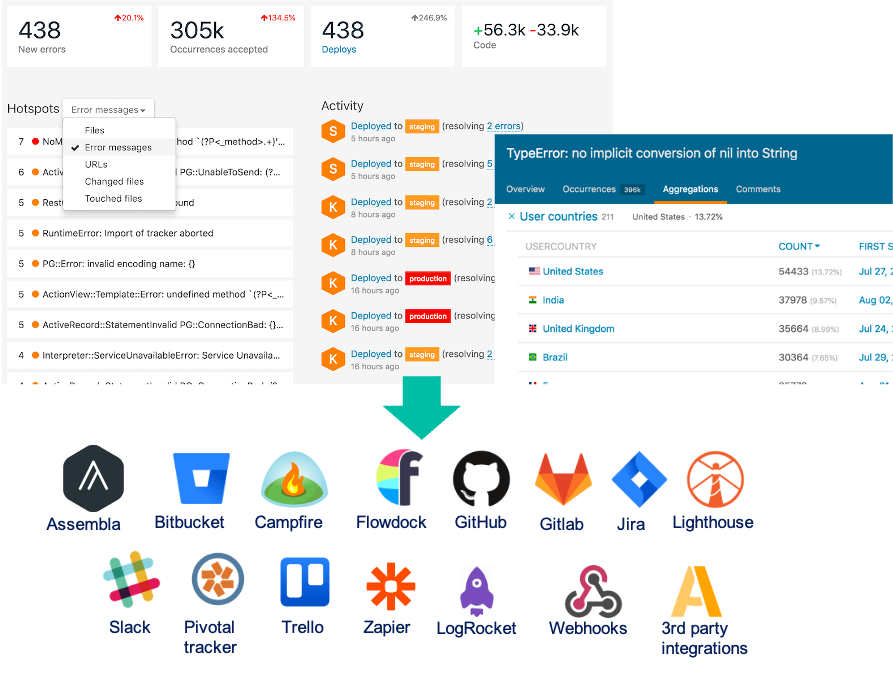
Never miss an application error, improve code quality, and diagnose and fix issues faster. Gain insight about the performance of the entire app stack, from code to cloud, to ensure flawless customer experience in Agile environments.