A hospital’s patient monitoring system fails during emergency surgery. A bank loses millions when its trading platform slows down by 50 milliseconds. A manufacturer’s production line halts due to a network bottleneck. A retailer’s point-of-sale system crashes during Black Friday.
These aren’t hypothetical scenarios—they’re real examples of what happens when network monitoring falls short. While keeping systems online is still fundamental, network monitoring now protects billions in assets, maintains data security, and prevents service disruptions across every major industry.
Each industry faces unique monitoring challenges:
- Healthcare providers need to track everything from patient data to medical devices.
- Banks require microsecond precision for trading platforms.
- Government agencies must maintain both service uptime and ironclad security.
- Manufacturers need to monitor industrial control systems and IoT devices.
- Retailers track point-of-sale (POS) systems and inventory management.
- Managed service providers (MSPs) handle monitoring for multiple clients simultaneously.
Let’s break down specific network monitoring use cases across these sectors.
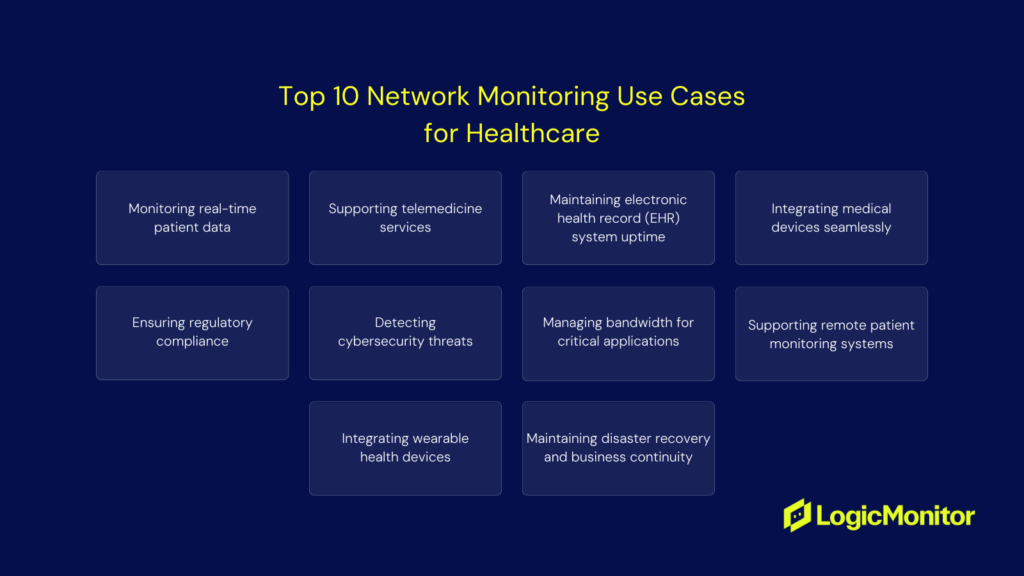
Healthcare Monitoring: When Every Second Counts
If you’re managing IT in healthcare, you know network issues aren’t just technical problems–they’re potential patient care problems. Here’s what you need to monitor to keep critical systems running:
Real-time Patient Data Systems
You’re responsible for monitoring vitals monitors, bedside devices, and patient alert systems. When a nurse needs to check a patient’s heart rate or O2 levels, those readings need to show up immediately. A 30-second delay isn’t acceptable when dealing with critical care patients.
Telemedicine Infrastructure
Remote consultations can’t have video freezing mid-diagnosis. You need to watch video quality, audio clarity, and connection stability across multiple locations. This means monitoring jitter, latency, and packet loss on your telemedicine endpoints.
EHR System Performance
When a doctor needs to pull up a patient’s history during rounds, waiting for the EHR to load isn’t an option. Monitor database response times, application performance, and server resources to catch slowdowns before they impact care.
Medical Device Networks
Your facility probably has hundreds of connected devices–from MRI machines to smart pumps. You need visibility into how these devices communicate with your network. Watch for interference, connection drops, and bandwidth bottlenecks that could disrupt device communication.
HIPAA Compliance Tracking
Beyond keeping systems running, you need proof they’re running securely. Monitor access logs, data encryption status, and audit trails. When the compliance team asks for reports, you need that data ready.
Security Monitoring
Healthcare is a prime target for cyberattacks. Watch for unusual traffic patterns, unauthorized access attempts, and potential data exfiltration. A ransomware attack isn’t just an IT problem–it can shut down entire departments.
Bandwidth Management
Different systems need different priorities. Remote surgery video feeds need more bandwidth than email. Set up QoS monitoring to ensure critical applications get the resources they need, especially during peak hours.
Remote Patient Monitoring
With more patients using home monitoring devices, you need to ensure those connections are reliable. Monitor VPN connections, data collection endpoints, and alert systems for these remote devices.
Wearable Device Integration
Patient wearables generate constant data streams that need to feed into your systems. Monitor API endpoints, data processing pipelines, and storage systems handling this influx of information.
Disaster Recovery Systems
When systems go down, you need to know your backups will work. Regularly monitor your failover systems, backup processes, and recovery procedures. Test these systems before you need them in a real emergency.
Pro tip: Set up separate monitoring dashboards for different departments. Your ER team needs metrics that are different from those of your radiology department. This helps you spot department-specific issues faster and prioritize your response based on clinical impact.
The key is remembering that every alert could affect patient care. A network issue that might be a minor inconvenience in another industry could be life-threatening in healthcare. Your monitoring strategy needs to reflect these stakes.
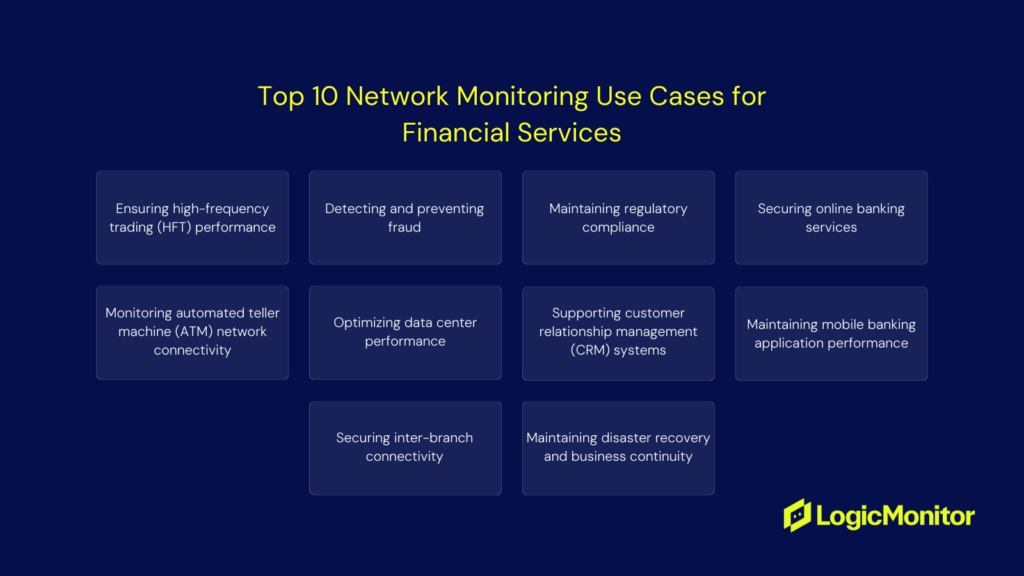
Financial Services Monitoring: When Latency Costs Real Money
If you’re an IT pro in financial services, you know network performance isn’t measured in seconds–it’s measured in microseconds. Here’s what you need to monitor to keep the money moving:
High-Frequency Trading Systems
Your traders need to execute thousands of transactions per second. A 10-millisecond delay can cost millions. Monitor network latency, packet loss, and jitter between trading servers and exchanges. Set up alerts for any latency spikes above your baseline – your traders will notice before you tell them.
Fraud Detection Infrastructure
Fraudsters don’t wait for business hours. Your monitoring needs to catch suspicious patterns 24/7. Watch for unusual transaction volumes, odd geographic patterns, and unexpected data transfers. When your fraud team asks why you flagged a transaction, you need that forensic data ready.
Compliance Systems
SOX and PCI DSS auditors love documentation. Monitor every data transfer, access attempt, and system change. Set up automated compliance reports–your auditors will ask for six months of logs and expect them in hours, not days.
Online Banking Platforms
When customers can’t check their balance or make a transfer, they call the CEO, not the help desk. Monitor your web servers, application performance, database response times, and load balancers. Set up synthetic transactions to catch issues before customers do.
ATM Networks
Nobody likes an “Out of Service” message on their ATM. Monitor connection status, transaction response times, and cash management systems. Watch for timeouts and failed transactions—they’re often early warning signs of bigger network issues.
Data Center Operations
Financial data needs to be processed NOW, not in five minutes. Monitor your storage I/O, network throughput, and processing queues. Watch for resource bottlenecks that could slow down end-of-day processing or trading operations.
CRM Infrastructure
Your sales team lives in the CRM. Monitor application response times, database performance, and integration points. When a wealth manager can’t access client data during a meeting, that’s a lost opportunity.
Mobile Banking Systems
Mobile apps are now your primary banking channel. Monitor API endpoints, authentication services, and backend systems. Watch for increases in error rates or response times – users will switch banks faster than they’ll update their app.
Branch Network Connections
Branch operations need rock-solid connectivity. Monitor MPLS links, VPN tunnels, and QoS settings. Set up failover testing–you don’t want to discover your backup links don’t work during a primary circuit failure.
Disaster Recovery Systems
In finance, downtime isn’t just expensive–it’s regulated. Monitor your backup systems, replication status, and recovery time objectives. Test your DR procedures regularly and monitor those tests. Regulators want proof your DR works, not promises.
Pro tip: Create tiered monitoring based on business impact. Your trading floor needs different SLAs than your marketing department. This helps you prioritize alerts and focus resources where milliseconds matter most.
In financial services, system performance directly impacts revenue. A network issue that would be a minor inconvenience elsewhere could cost millions here. Your monitoring needs to be as quick and precise as the trading systems you support.
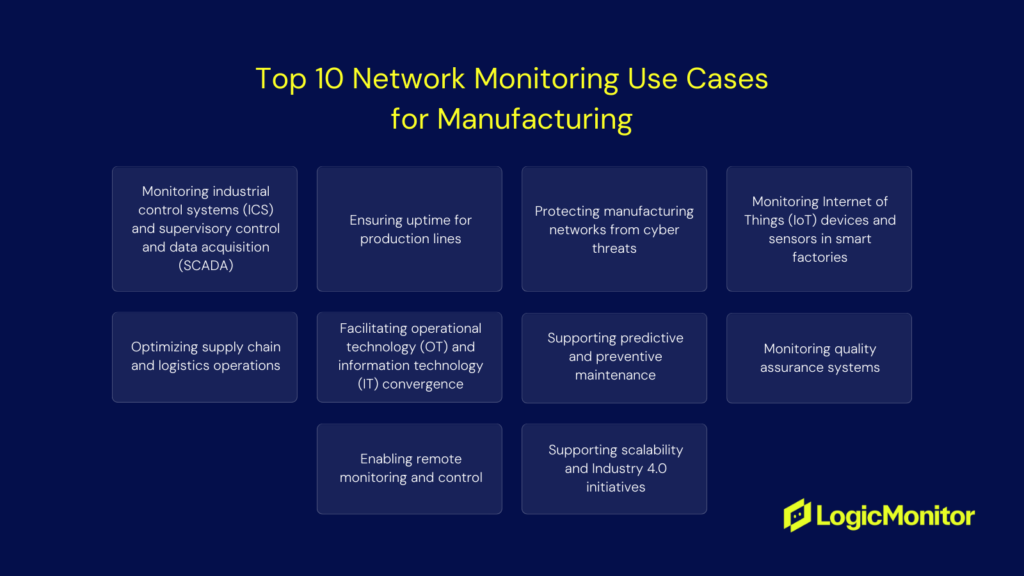
Manufacturing Monitoring: Because Production Can’t Stop
If you’re managing IT in manufacturing, you know downtime isn’t measured in lost sales. It’s measured in lost production minutes. Every minute a line is down costs thousands. Here’s what you need to monitor to keep things running:
ICS and SCADA Systems
Your PLCs and SCADA systems are the backbone of production. Monitor communication between controllers, response times, and command execution. When a PLC drops offline, you need to know which network segment failed before maintenance asks why the line stopped.
Production Line Networks
Modern production lines are all about machine-to-machine communication. Monitor data flows between equipment, watch for bandwidth bottlenecks, and track automation system latency. A 2-second delay in robotic arm coordination can mess up an entire batch.
OT Security
Manufacturing networks are becoming prime targets for cybercrime. Monitor for unusual access patterns, unexpected command sequences, and unauthorized devices. When ransomware hits a factory, you can’t just restore from backup – you need to prevent it entirely.
IoT Sensor Networks
Your factory probably has thousands of sensors monitoring everything from temperature to vibration. Track sensor connectivity, data collection rates, and battery levels. Set up alerts for sensors that start showing unusual patterns–they often indicate equipment problems before major failures.
Supply Chain Systems
Production planning depends on real-time inventory and logistics data. Monitor ERP system connections, warehouse management systems, and supplier portals. When the shipping system can’t talk to production planning, you’re risking either overstock or stockouts.
OT/IT Integration
Your shop floor systems need to talk to business systems seamlessly. Monitor the connections between your OT networks and IT systems. Watch for protocol conversion issues and data synchronization delays–they can cause mismatches between production and enterprise systems.
Maintenance Systems
Predictive maintenance depends on reliable data flow. Monitor your condition monitoring systems, maintenance scheduling applications, and asset management databases. Set up alerts for gaps in data collection–missing sensor data today means missing failure predictions tomorrow.
Quality Control Networks
Automated inspection systems need reliable, high-speed connections. Monitor your quality control cameras, measurement systems, and defect detection equipment. A delayed quality alert means more defective products to sort through.
Remote Access Systems
With distributed plants, secure remote access is crucial. Monitor VPN connections, remote access gateways, and authentication systems. When a technician needs to troubleshoot a machine remotely at 3 AM, those connections need to work.
Industry 4.0 Platform
Your smart factory initiatives depend on solid infrastructure. Monitor the integration points between AI systems, IoT platforms, and automation controls. Watch for bottlenecks in data processing that could slow down your smart manufacturing systems.
Pro tip: Create monitoring profiles for different production areas. Your high-speed packaging line needs different thresholds than your warehouse automation. This helps you prioritize alerts based on direct production impact.
Remember: In manufacturing, network issues directly impact production output. A connectivity problem that would be an inconvenience in an office can shut down an entire production line. Your monitoring strategy needs to be as reliable as your production targets.
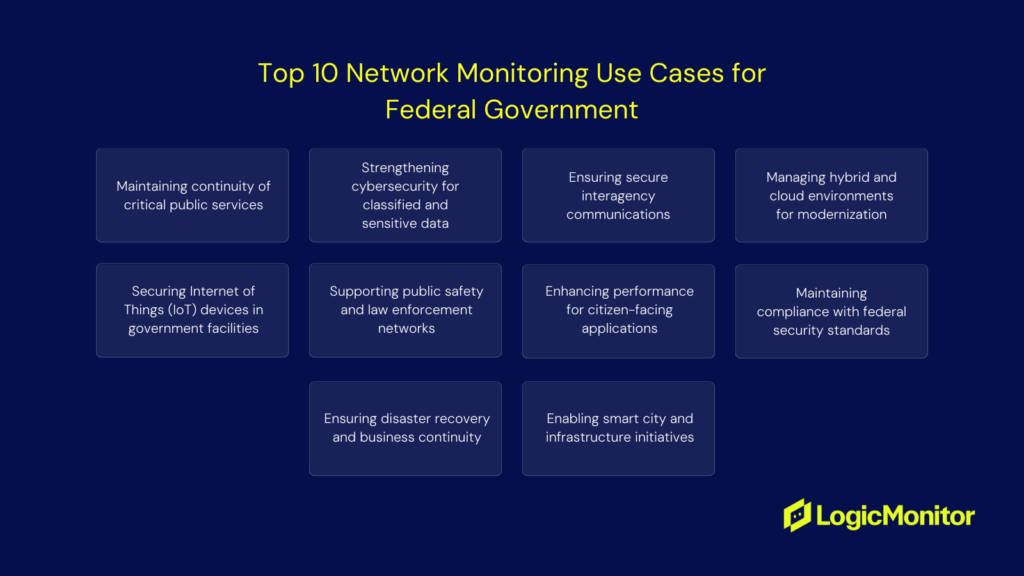
Federal Government Monitoring: When National Security is on the Line
If you’re an IT pro in federal government, you’re not just managing systems–you’re protecting national infrastructure. Here’s what you need to monitor to keep critical services running and secure:
Critical Public Services
Social Security checks, disaster relief, veteran benefits…millions depend on these systems daily. Monitor application performance, database response times, and system availability. When benefit processing systems slow down, it’s not just help desk tickets–it’s citizens not getting critical services.
Classified System Security
You’re defending against nation-state actors, not just random hackers. Monitor for unusual access patterns, data exfiltration attempts, and system anomalies. Set up alerts for any deviation from baseline behavior. By the time you spot obvious intrusion signs, it’s usually too late.
Interagency Communications
Agency collaboration needs to be both seamless and secure. Monitor encryption status, network tunnels, and cross-agency connections. Watch for encryption failures or connection degradation. Secure doesn’t help if agents can’t communicate during critical operations.
Hybrid Infrastructure
You’re probably juggling legacy systems and cloud platforms. Monitor the integration points, data transfer speeds, and application performance across both environments. When a 20-year-old system needs to talk to a new cloud service, you need visibility into every hop in between.
Facility IoT Security
Government facilities are full of connected devices, from security cameras to HVAC sensors. Monitor device behavior, network segments, and access patterns. A compromised security camera can become a gateway to sensitive networks.
Law Enforcement Networks
Police body cams, emergency response systems, case management databases–these need real-time reliability. Monitor streaming video quality, data upload speeds, and system access times. Delays aren’t acceptable when an officer needs to access case files in the field.
Public-Facing Systems
Tax season, emergency alerts, and grant applications are just a few ways government portals face massive traffic spikes. Monitor server loads, application performance, and database connections. Set up load testing and synthetic transactions to catch issues before they impact citizens.
FISMA/FedRAMP Compliance
Federal compliance isn’t optional. Monitor security controls, access logs, and system configurations. Keep detailed audit trails because when inspectors general come asking questions, you need answers backed by data.
Disaster Recovery
Government services need to run even during disasters. Monitor backup systems, failover processes, and recovery procedures. Test and monitor your DR systems regularly. Citizens need government services more than ever when natural disasters hit.
Smart Infrastructure
From traffic systems to emergency services networks, smart city tech needs smart monitoring. Monitor IoT networks, control systems, and data analytics platforms. Watch for both performance issues and security threats – smart infrastructure means smart targets for attackers.
Pro tip: Create separate monitoring environments for different security levels. Your public website needs different monitoring rules than classified systems. This helps maintain security boundaries while ensuring appropriate visibility at each level.
Every monitoring decision in federal IT impacts national security and citizen services. Security gaps that cause minor disruptions elsewhere could compromise state secrets or critical infrastructure. Your monitoring strategy must balance transparency for legitimate users with ironclad security against threats. When defending systems against nation-state actors while serving millions of citizens, your monitoring must be as sophisticated as the threats you face.
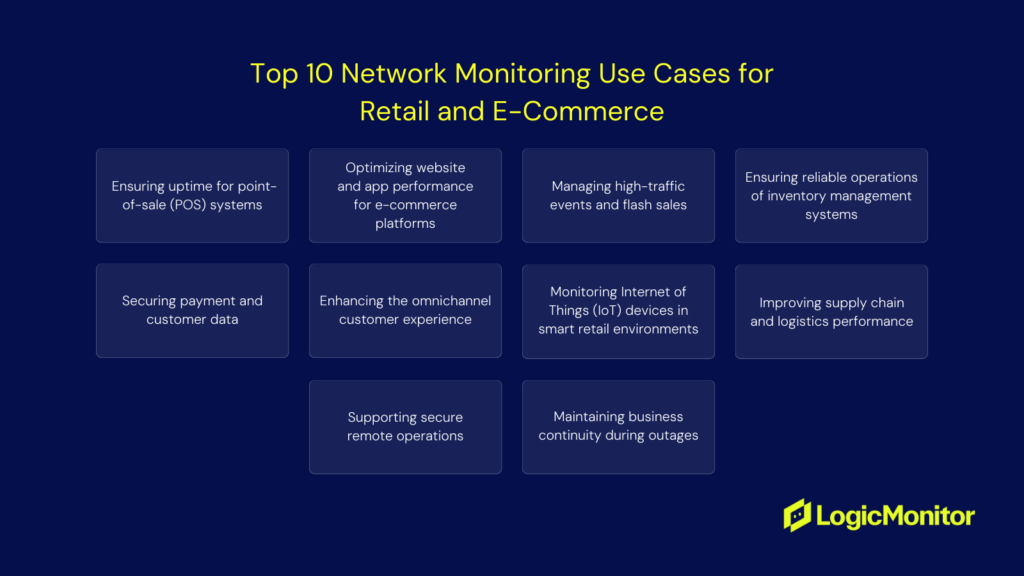
Retail Monitoring: Because Every Second of Downtime is Lost Sales
If you’re running IT in retail, you know system issues translate directly to lost revenue. When systems go down, customers walk out. Here’s what you need to monitor to keep the registers ringing:
POS Systems
Your registers are your revenue lifeline. Monitor payment gateway connections, card processor response times, and network stability. When a store manager calls about transactions failing on a busy Saturday, you need to know instantly if it’s a local network issue or a payment processor problem.
E-commerce Platform
Your website is your 24/7 storefront. Monitor server response times, database performance, and checkout flows. Track user journey metrics–if page load times spike from 2 to 5 seconds during peak shopping hours, you’re losing sales with every delay.
High-Traffic Event Systems
Black Friday, flash sales, and product launches are a few events that make or break your year. Monitor server capacity, load balancers, and database performance. Set up automatic scaling triggers and watch resource utilization. When 100,000 customers hit your site at midnight for a sale, you need to know you can handle it.
Inventory Systems
Nothing frustrates customers like buying something that’s not actually in stock. Monitor inventory database synchronization, store-to-warehouse communications, and real-time stock updates. When your system shows 100 items but the warehouse has zero, you’ve got angry customers and wasted marketing spend.
Payment Security
Retail is a prime target for payment fraud. Monitor transaction patterns, data flows, and access attempts. Watch for unusual patterns in payment processing–criminals often test stolen cards with small purchases before big fraud attempts.
Omnichannel Integration
Customers expect seamless buy-online-pickup-in-store experiences. Monitor the connections between your e-commerce platform, store systems, and inventory databases. When a customer tries to pick up their online order, and the store system doesn’t show it, you’ve got a problem.
Smart Store Systems
From electronic shelf labels to inventory RFID, modern stores are IoT hubs. Monitor device connectivity, battery levels, and firmware status. Set up alerts for offline devices. A dead electronic price tag showing the wrong price can cost thousands in pricing errors.
Supply Chain Networks
Stock delays mean empty shelves. Monitor connections with suppliers, warehouse management systems, and logistics providers. Watch for delays in inventory updates or shipping notifications – they often indicate bigger supply chain issues.
Remote Access Infrastructure
Store managers and warehouse staff need reliable remote access. Monitor VPN connections, authentication systems, and remote terminal servers. You need quick answers when a store manager can’t access sales reports from home during a crisis.
Business Continuity
Retail never sleeps, so your DR better not either. Monitor backup systems, failover processes, and recovery procedures. Test your failover systems regularly–when a store loses main internet during holiday shopping, that backup connection better work.
Pro tip: Set up different monitoring thresholds for different retail seasons. What’s normal traffic in March might be a problem in December. Adjust your alerts based on expected seasonal patterns.
Every minute of downtime hits the bottom line when it comes to retail IT. A slow website that would be a minor annoyance for a blog could cost millions during a holiday sale. A POS outage during peak hours directly impacts revenue, customer satisfaction, and brand reputation. Your monitoring needs to be as quick as a card swipe and as reliable as your best cashier. Because in retail, performance metrics show up directly in sales numbers.
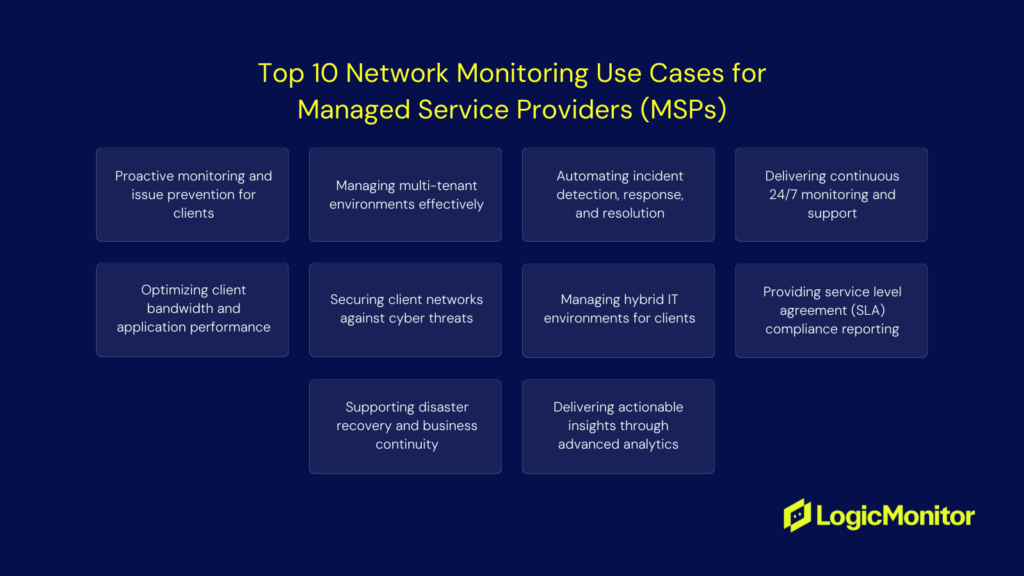
MSP Monitoring: Multiple Clients, Zero Room for Error
If you’re at an MSP, you’re juggling dozens of client environments, each with their own quirks and emergencies. You need to spot issues before your clients do, or you’ll be explaining why they’re paying you. Here’s what you need to monitor to stay ahead:
Proactive Issue Detection
Nobody likes those 3 AM “everything’s down” calls. Monitor server health metrics, network performance, and hardware status across all clients. When a client’s Exchange server starts showing memory leaks on Tuesday, fix it before it crashes their email on Friday.
Multi-tenant Environment
You’re managing a small city’s worth of networks. Monitor each client’s environment separately while keeping your master view. Set up client-specific dashboards and alerts. What’s normal traffic for your enterprise client might be a red flag for your small business customer.
Automated Response
You can’t manually handle every alert across hundreds of endpoints. Monitor for common issues and set up automated fixes. When a print spooler hangs or a service crashes, let automation handle it while you sleep.
24/7 Coverage
Your clients expect their systems to work around the clock. Monitor critical services, network connectivity, and application performance continuously. Set up escalation paths – when a client’s core system fails at midnight, the right person needs to know immediately.
Performance Optimization
Client complaints about “slow systems” need data-backed answers. Monitor application performance, bandwidth usage, and resource consumption. When a client asks why their CRM is sluggish, show them exactly which cloud backup is hogging their bandwidth.
Security Monitoring
Each client is a potential target. Monitor for security threats across all clients simultaneously. Watch for patterns–if three clients show similar suspicious activity, you might be seeing the early signs of a larger attack.
Hybrid Environment Management
Most clients have a mix of on-prem and cloud services. Monitor the connections, integrations, and performance across their entire infrastructure. When their cloud-synced files start lagging, you need to know if it’s their internet connection or their SaaS provider.
SLA Reporting
Contracts require proof of performance. Monitor uptime, response times, and resolution metrics. Generate detailed reports automatically. When a client questions your value, show them exactly how you’ve kept their systems running.
Disaster Recovery
Each client needs a working backup and recovery system. Monitor backup success rates, test recovery procedures, and verify data integrity. When a client loses critical data, “the backup failed” isn’t an acceptable answer.
ROI Analytics
Clients want to see the value you provide. Monitor cost savings, performance improvements, and avoided downtime. Build dashboards showing prevented issues and optimizations–help clients understand why they’re paying you before they ask.
Pro tip: Create standardized monitoring templates for different client types. Your retail clients need different monitoring than your healthcare clients. This helps you onboard new clients faster while maintaining industry-specific best practices.
As an MSP, monitoring capabilities define service quality. Each alert caught early strengthens client relationships, while each missed warning risks multiple client environments. A minor issue can cascade into a major crisis when it spreads across multiple clients and industries. Your monitoring must scale with your client base and adapt to their diverse business needs. The right monitoring strategy prevents problems and builds the trust that keeps clients renewing contracts.
Wrapping up
Network monitoring requirements continue evolving as technologies advance and threats become more sophisticated. Organizations need monitoring solutions that can adapt to new challenges while maintaining visibility across increasingly complex infrastructure.
Each industry’s specific needs shape their monitoring approach, but some requirements remain constant:
- Real-time visibility into network performance
- Quick problem detection and resolution
- Security threat identification
- Compliance with industry regulations
- Support for business continuity
The key is finding monitoring solutions that address your industry’s specific challenges while providing the flexibility to adapt as those challenges evolve.
Want to build a solid foundation for implementing these use cases? Learn the five key concepts of network monitoring that make these industry-specific implementations possible.
Database monitoring is the process of continuously tracking and analyzing a database’s performance, security, and availability to ensure it operates efficiently and reliably. By monitoring key metrics like query response times, CPU usage, and storage capacity, organizations can proactively address issues, prevent downtime, enhance data integrity, and maintain compliance with regulatory standards. Effective database monitoring tools and practices are essential for optimizing database management and supporting seamless operations.
This article explains why database monitoring is essential for modern IT infrastructure. It provides practical insights and step-by-step guides to help IT professionals enhance system reliability, protect data, and optimize performance.
Why database monitoring matters
Effective database monitoring is crucial for maintaining optimal performance, preventing downtime, and safeguarding sensitive data. It refers to a set of specific tasks performed regularly to ensure a database functions as it should, allowing companies to keep tabs on network and database performance. This includes both hardware and software maintenance.
Database monitoring acts like an ongoing health checkup for your data management system (DMS), ensuring that databases function optimally. By tracking vital metrics and identifying weak areas, monitoring optimizes performance, improves responsiveness, and guards against breaches. Monitoring also provides insights for forecasting hardware needs and helps ensure business operations run smoothly.
Database monitoring is multi-faceted and provides an overview of many different processes, which include:
Resource availability and consumption
Databases are regularly scanned to ensure they are online. This occurs both during and after the standard working hours. Once the system confirms the database is online, resources like CPU and other network components are monitored. Alerts for different problems can be sent to different team members so they can act quickly.
Tracking throughput
This type of monitoring includes things like replication latency. The system sets benchmarks and compares them to present numbers, making it easy to observe and investigate deviations from the norm.
Log tracking
Database logs can be the difference between proactive and reactive monitoring. Logs display vital information about which queries are running and how long they take. With various types of database logs, information is collected that wouldn’t be trackable with standard performance metrics.
With the rise of IoT, the average business now collects a staggering amount of data. Data management techniques need to keep pace. Built-in data management systems can significantly increase server loads, which can increase software and hardware costs. They also tend to include unnecessary data, which raises accessibility issues for administrators.
Thus, the market for Database Activity Monitoring (DAM) tools has grown year after year and may reach $2.86 billion by 2028. These tools add an extra layer of security, ensuring that business-critical applications always function optimally and end-users are never inconvenienced.
How database monitoring works
Teams can achieve strong database functioning by monitoring selected metrics. These include elements such as memory usage, configuration, and connection information. The system automatically refers to past data to ensure things are on track in real-time. But database monitoring goes deeper than just checking for problems. The system can distinguish true anomalies from temporary trends by consistently aggregating data. Such nuanced insights add more value to an already dynamic data monitoring tool.
SQL query monitoring is another way to keep IT resources running smoothly. An overly complex query design can slow down the system or create other internal issues. Data monitoring platforms offer quick and easy query monitoring of code. This allows developers to ensure their code doesn’t negatively affect database performance. The system will also detect new queries that were not previously monitored and add them to the list.
Database monitoring enables teams to:
- Incorporate business KPIs: Develop custom modules to interact with different systems.
- Monitor cloud database instances: Keep an eye on schedule database maintenance, data replication, and more.
- Targeted tracking: Observe the performance of individual databases.
- Eliminate manual configuration: DAM is an out-of-the-box solution requiring minimal setup.
- Utilize built-in alerts and graphing: Graphs are visible in real-time right from the data monitoring dashboard.
- Detect suspicious activity: Administrators can scan for security threats like SQL injections, outlier user activity, and privilege abuses.
- Extract key insights: Gain greater access to metrics without direct database access.
- Take advantage of observability: View information for many different servers from one dashboard.
Why is database monitoring important?
Databases have been around longer than many of today’s business applications. For this reason, there can be a sense that they are old news and there’s nothing more to say about them. Many businesses simply don’t prioritize databases at all, which can lead to substantial revenue losses. A 2014 Gartner study estimated downtime costs to average $5,600 per minute, which has only increased since then.
Organizations can proactively future-proof their databases. As businesses grow and evolve, so must their database management systems (DMS). Modern database monitoring tools are essential for scalability, a key feature to accommodate ongoing changes. Given that databases have been crucial since the inception of online business, maintaining database health remains a critical priority.
Core components of a scalable database monitoring system
- Customization: Allows organizations to tailor the monitoring tools to fit their specific needs and workflows.
- High server availability: Essential for monitoring multiple servers simultaneously. The platform must be accessible and scalable to support this high availability.
- Compliance management: A scalable monitoring system must help administrators stay compliant with various regulations and standards, adapting to new compliance requirements as they arise.
Key functions of database monitoring systems:
- Optimize performance: Ensures databases run efficiently, enhancing speed and responsiveness.
- Protect data: Safeguards sensitive information from breaches and vulnerabilities.
- Eliminate downtime: Minimizes disruptions, ensuring continuous database availability.
Benefits of Effective Database Monitoring
- Avoid revenue losses: Consistent monitoring helps prevent downtime and performance issues, which can directly impact revenue.
- Secure sensitive data: Protecting valuable data from unauthorized access and breaches ensures trust and compliance.
- Improve user experience: Fast and reliable database performance leads to a smoother user experience.
- Streamline data analysis: Simplifies the process of analyzing data and gaining insights.
- Reduce IT infrastructure costs: By automating routine tasks, organizations can save on manual IT efforts.
- Increase efficiency: Automates tasks that would otherwise consume valuable time, allowing teams to focus on strategic initiatives.
- Facilitate continuous improvement: Creates a cycle of regular updates and enhancements, optimizing database health over time.
Database monitoring in a DevOps environment
DevOps is a rapidly evolving field, presenting new challenges for IT professionals, especially with the rise of cloud-based infrastructures. Effective database monitoring systems are essential in overseeing connections across various applications. Using advanced monitoring tools, businesses can increase operational efficiency and ensure database health even as their technological needs grow more complex.
DevOps and evolving challenges
- Impact of cloud-based infrastructures: Cloud and hybrid environments require sophisticated monitoring solutions to manage multiple applications and connections effectively.
- Managing increased complexity: Effective monitoring tools can simplify the management process and prevent minor issues from becoming major complications.
Automation and efficiency in database management
- Reducing manual oversight: Modern monitoring tools automatically gather and present essential data, enabling staff to focus on critical tasks and strategic decision-making.
- Continuous monitoring and alerts: These systems can quickly detect anomalies such as resource overutilization and provide steady oversight and send real-time alerts when issues arise.
Proactive problem-solving and security
- Preventing system downtime: Early detection allows IT teams to respond swiftly, preventing system downtime and maintaining optimal performance.
- Ensuring data compliance and security: Effective monitoring provides visibility and transparency, helping organizations maintain data compliance and safeguard sensitive information through access controls and authentication protocols.
Key metrics for database monitoring
It’s important to track the right metrics to maintain database security and performance. These elements are critical to any comprehensive database monitoring strategy:
- CPU usage: Indicates how much processing power the database server is utilizing. Monitoring this metric helps prevent server overload.
- Memory usage: Shows the amount of memory that’s in use. Tracking memory usage helps optimize memory allocation and prevent resource exhaustion.
- Disk I/O: Measures the read and write operations on the database storage. Monitoring disk I/O helps identify bottlenecks and optimize database storage performance.
- Query performance: Includes metrics like the query execution time, the number of slow queries, and the number of queries executed per second. Tracking SQL query performance ensures the database quickly responds to requests.
- Latency: Calculates the time it takes for a request to travel from the client to the server and back. High latency can lead to poor user experience and slow application response times.
- Error rates: Tracks the number and types of errors occurring within the database. High error rates may indicate underlying problems that need immediate attention.
- Transaction throughput: Determines the number of transactions processed per second. Throughput is important for understanding the database’s capability to handle business operations.
Getting started with database monitoring
Database integrity remains a top priority for any business. As enterprises use more applications and rely more heavily on integrations, processes become more complicated. This complexity makes errors more difficult to anticipate, making data-driven technology the best choice for data monitoring efforts.
Given these challenges, it’s clear that effective database monitoring is essential for maintaining stability and avoiding costly disruptions. Here’s how to implement a robust database monitoring system:
1. Identify your monitoring needs
The first step in getting started with database monitoring is to understand your organization’s specific needs and how they may evolve in the future. This involves the following:
- Assessing current infrastructure: Evaluate the types of databases in use (e.g., AWS, SQL Server, MySQL, MongoDB, Oracle, Cassandra, MariaDB) and any future plans to add more. Understanding your current and future environments helps you select the appropriate monitoring tools.
- Determining business requirements: Identify key performance indicators (KPIs) and compliance needs that are critical for your business. Consider aspects like performance optimization, security, data protection, and scalability.
2. Select the right monitoring tools
Choosing the right monitoring platform is crucial. Look for tools that offer:
- Compatibility with multiple databases: Ensure the tool can monitor different database types you are using, whether on-premises, cloud-based, or hybrid.
- Scalability and flexibility: Select a tool that can grow with your business and adapt to changing needs.
- Advanced features: Consider features such as real-time alerts, anomaly detection, integration with AI and machine learning, and comprehensive reporting capabilities.
- User-friendly interface: Choose a tool with an intuitive dashboard that allows for the easy interpretation of data, allowing for quick action when problems arise.
3. Set up and configure the monitoring system
Once you’ve selected a monitoring platform, follow these steps to set it up:
- Installation and integration: Install the monitoring tool and integrate it with your existing infrastructure. Ensure that it is configured to monitor all critical databases and applications.
- Define monitoring parameters: Configure thresholds for performance metrics, set up alerting mechanisms (e.g., email or SMS notifications), and customize dashboards to visualize data effectively.
- Automate routine tasks: Leverage the monitoring system to automate regular health checks, security audits, and reporting to free up IT resources.
4. Train your IT team
Effective use of a monitoring system requires that IT staff are well-trained and familiar with the tool’s capabilities:
- Organize training sessions: Set up training sessions to help the team understand how to use the monitoring platform, interpret data, and respond to alerts.
- Develop standard operating procedures (SOPs): Create SOPs for handling common issues and responding to various alerts. This ensures a consistent and efficient approach to problem-solving.
5. Review and optimize
After the initial setup, continuously review the monitoring process to ensure it meets evolving needs:
- Regular audits and adjustments: Conduct periodic audits of your monitoring setup and adjust thresholds, alerts, and reporting as needed. Pay attention to updates with database and monitoring software to ensure you’re aware of changes that may impact performance.
- Feedback and iteration: Encourage feedback from IT staff on the monitoring system’s effectiveness and make iterative improvements to optimize performance.
By following these steps, IT teams can effectively implement a database monitoring system that enhances productivity, reduces the risk of outages, and ensures the security and integrity of their data environments. With a comprehensive monitoring strategy, organizations can stay ahead of potential issues and maintain uninterrupted operations.
Best practices for database monitoring
Implementing database monitoring is crucial for maintaining system health, optimizing performance, ensuring data security, and proactively finding problems. Following best practices helps organizations make the most out of their monitoring efforts. Here are five key best practices to consider:
1. Establish clear objectives
Define specific objectives for your database monitoring to align with your business goals. Whether the aim is to enhance performance, ensure uptime, increase security, or ensure compliance, having clear objectives helps tailor your monitoring strategies. Regularly review these objectives to adapt to evolving business needs.
2. Automate routine tasks
Automation is essential to reduce the workload on IT teams and improve accuracy. Automate routine tasks such as system health checks, performance benchmarks, and security audits. Automation ensures consistency, speeds up response times, and minimizes human error.
3. Implement real-time alerts and notifications
Set up real-time alerts for critical issues such as system failures, security breaches, or performance degradation. Alerts should be sent to the appropriate team members via multiple channels (e.g., email, SMS) to ensure timely action and prioritized to ensure critical alerts get immediate attention. Customize alert thresholds to avoid alert fatigue and ensure only significant issues are flagged.
4. Leverage historical data for trend analysis
Utilize historical monitoring data to analyze trends and predict future performance issues. By comparing current metrics with historical data, you can identify patterns and potential problems before they escalate. Trend analysis aids in proactive problem-solving and helps in capacity planning.
5. Prioritize security and compliance monitoring
Database monitoring should always include a focus on security and compliance. Regularly scan for unauthorized access, anomalies, and potential breaches. Ensure that monitoring tools support compliance with industry standards and regulations such as GDPR or HIPAA, depending on your business sector.
6. Optimize query performance
Regularly monitor and optimize SQL queries to enhance database performance. Identify slow or inefficient queries and address them to prevent them from affecting overall system performance. Monitoring tools should include features to automatically detect and flag problematic queries.
7. Integrate monitoring with DevOps practices
For organizations using DevOps methodologies, integrate database monitoring with existing DevOps workflows and part of the CI/CD pipeline. This ensures that monitoring is an ongoing part of development and deployment processes, allowing teams to address issues during development rather than after deployment.
8. Ensure comprehensive coverage
Make sure that your monitoring covers all critical aspects of the database environment, including hardware, software, network connections, and third-party integrations. Comprehensive coverage—including on-prem and cloud databases—helps quickly identify the root cause of any issues and ensures no blind spots in your monitoring strategy.
9. Regularly review and update configurations
Database environments and business requirements change over time. Regularly review and update your monitoring configurations using configuration management tools to adapt to new challenges and technologies. This includes updating alert thresholds, monitoring parameters, and compliance requirements.
10. Provide continuous training
Equip IT teams with regular training on the latest monitoring tools and techniques. Continuous learning and cross-training ensure that teams are up-to-date with best practices and can effectively utilize monitoring systems to maintain database health.
Conclusion
Database monitoring helps you gain a complete view of your databases and their current performance. It helps you proactively address potential issues, ensure compliance with security standards, and support overall business continuity. Best practices like automation, historical analysis, and query optimization can keep databases running efficiently, giving users a smooth experience and working applications.
LogicMonitor is the leading AI-based hybrid observability and IT operations data collaboration platform for enterprise IT and managed service providers and can help your business monitor your database. Get a bird’s-eye view of your networks, cloud, applications, servers, databases, log data, and more from one accessible platform. Ready to try it for free?
The Java Management Extensions (JMX) framework is a well-known tool for any experienced Java developer. The purpose of the JMX framework is to simplify the management of local and remote Java applications while providing a user-friendly interface.
The primary advantages of the JMX framework are that it’s highly reliable, scalable, and easy to configure. However, it’s also known for introducing the concept of MBeans, which unlocks the capacity for real-time Java application management. Here’s a closer look at the JMX framework and JMX monitoring.
Contents
- What Is JMX?
- What Is JMX Monitoring?
- What Are MBeans?
- How Is Data Collected?
- Comparing JMX Monitoring Solutions
- Why Should I Monitor Java Applications?
- Why Is JMX Monitoring Important for DevOps?
- Conclusion
What Is JMX?
Since Java 1.5, the Java Management Extensions (JMX) framework has been widely adopted as a user-friendly infrastructure solution to help manage both remote and local Java applications. Since JMX introduced the concept of MBeans, it helped to revolutionize Java application management and bring real-time management tools into the picture.
The features of JMX include the ability to:
- Easily manage Java apps and services without making heavy investments of time or resources. Since JMX needs only a core managed object server, you can manage your Java apps without really impacting how they are designed.
- Scale your management architecture as needed, without unnecessary complexity. Once you have set up the JMX agent service, it will run independently. Through this component-based approach, you can scale your JMX solution almost infinitely with hardly any changes necessary to the program itself.
- Leverage flexible and dynamic solutions to help you stay on top of future concepts. With the ability to use emerging technologies, you can stay ahead of the competition without completely reworking your solution every time a new approach or technology is released.
- Focus on managing your apps and services without a lot of legwork. You can certainly utilize JMX within a distributed environment, but the APIs make it simple to add management tools for your services, applications, systems, and networks.
As you can see, there are many reasons to utilize JMX if you’re currently working with Java applications. However, one of the best features of JMX is known as JMX monitoring. So, let’s take a closer look at how you can leverage it.
What Is JMX Monitoring?
The purpose of the JMX framework is to support monitoring and management initiatives for Java applications. By creating a generic system for monitoring Java applications, JMX monitoring unlocks some fundamental tools, such as notifications that can alert a team when an app needs attention or when the state of an application changes.
In addition to notifications, JMX monitoring can also help improve observability by exposing run time metrics and revealing resource utilization and allocation. One of the most crucial components to understanding JMX monitoring is the MBeans that help developers recognize and organize resources on their Java Virtual Machines (JVMs).
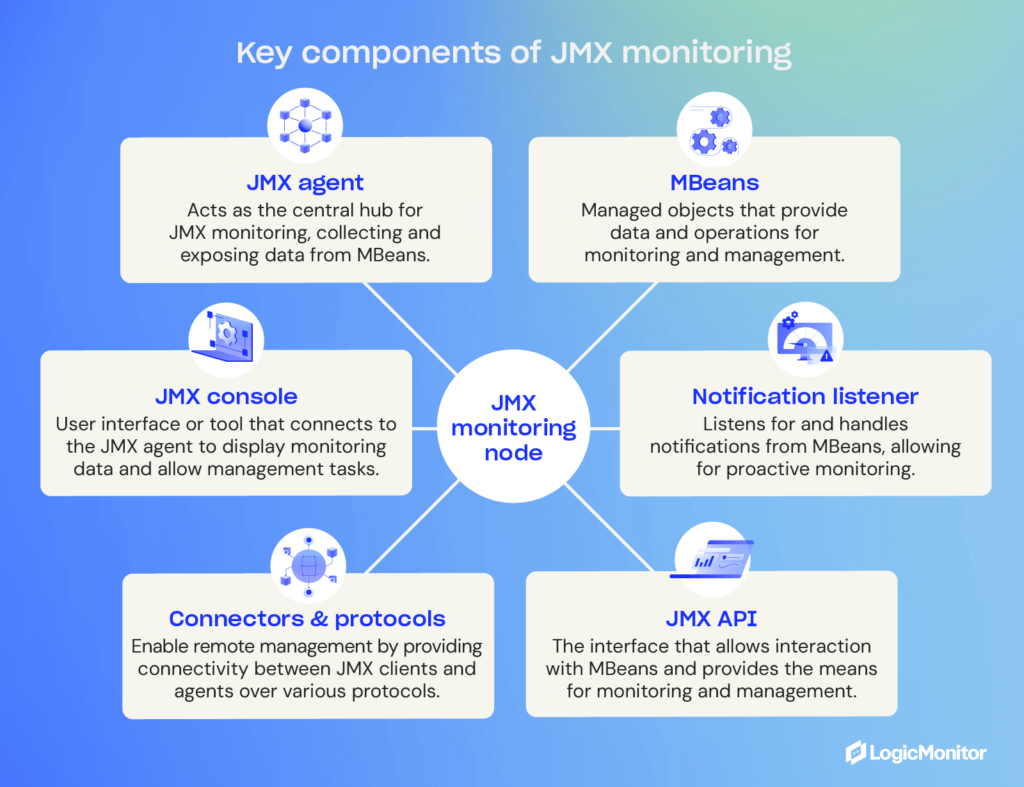
Overall, there are three tiers of components involved in JMX monitoring:
- The probe or instrumentation level is made up of MBeans wrapped around individual resources.
- The agent level consists of the MBean Server that exposes MBeans to applications on the next layer.
- The management level is where the connectors exist that allow your remote applications to access the MBean Server for monitoring and management purposes.
With these things in mind, here’s a more thorough explanation of how MBeans work and what developers can do with them to improve the monitoring and management of their Java applications.
What Are MBeans?
Managed Beans, or MBeans, form the foundation for JMX monitoring. The purpose of an MBean is to represent a resource within a Java Virtual Machine (JVM) to make it easier to configure and utilize. Within the JMX console, developers can expose a resource/MBean using a JVM port. From the console, developers can also group your MBeans into domains to help them easily track where all of their resources belong.
When looking at a Java Virtual Machine (JVM), you’ll generally see multiple domains, each with many MBeans assigned to it. For instance, a Java application using tomcat might have domains named Catalina and Java.lang. The former would include all resources (MBeans) for the Apache tomcat container known as Catalina, and the latter would contain all of the MBeans for the JVM run-time.
Depending on how a team manages things, they can choose to create custom domains for individual applications. This flexibility is important because today’s applications have very different requirements, with some requiring only a small footprint and others needing significant resources. While teams can optimize applications themselves during development, optimizing a JVM run-time and container is often handled after the fact.
When it comes to run-time and container optimization for Java apps, many developers might already be familiar with how to alter heap size or garbage collection, but MBeans can also play a role by helping them to allocate resources where they’re needed most.
How Is Data Collected?
Now that you understand the big picture overview of how JVM monitoring works and what MBeans serve to do, it’s also worth explaining how data is collected within Java Virtual Machines (JVMs).
The technical explanation involves some mostly unseen components, including MBeans and an MBean Server. The MBeans themselves take on the role of Java wrappers for components, apps, devices, and services within your network. Meanwhile, the MBean Server is where you can find and manage the resources that the MBeans represent.
Therefore, the MBean Server is the central focus of your JMX monitoring endeavor. If you want to get technical, a JMX agent consists of the MBean Server and the services necessary to handle the MBeans, such as an application performance monitoring (APM) solution. This setup keeps your resources independent of whatever infrastructure you use to manage them, which provides added flexibility.
If you’re using remote management tools, there are standard connectors (known as “JMX connectors”) that you can use to connect things together regardless of communication protocols. This means that you can use JMX connectors to use systems and apps that are not compatible with JMX specifically, as long as they support JMX agents.
Comparing JMX Monitoring Solutions
Once JMX agents are in place, you’re one step closer to easily managing and monitoring your Java applications. However, another important part of the process is deciding which monitoring solution you wish to use. Some of the most popular include:
- JConsole: Works alongside Java Management Extensions for both remote and local applications but is more ideal for development and prototyping than live deployments due to its intense resource consumption. Still, JConsole provides a wealth of information, including uptime, live threads, peak, etc.
- JMX Console: This management console is used by JBoss and allows developers to tap into the raw data produced by MBeans and unlocks the option to start or stop components and complete simple tasks. Keep in mind that JBoss is an open-source middleware solution provided by Red Hat, but a paid subscription is available for extra documentation and support.
- JManage: If you’re working with distributed applications, JManage is an open-source solution that’s worth considering, and it offers both web-based and command-line interface tools. It also supports an SNMP network along with JMX. The team behind JManage strives to offer a solution suitable for managing entire production environments.
- ManageEngine Applications Manager: If you’re interested in an on-premises paid software package, ManageEngine is comprehensive enough to enable entire IT departments and DevOps teams to implement JMX monitoring on any Windows or Linux server. A professional and enterprise edition is available, depending on a client’s budget and requirements.
- AppDynamics: Another paid solution, AppDynamics can provide additional flexibility since it is web-based. This platform is compatible with MBeans and can compile detailed activity reports for all your Java apps. Multiple tiers are available to fit various business sizes. This platform is part of the Cisco corporation and is widely trusted by enterprises.
- LogicMonitor: We use LogicMonitor to monitor our own infrastructure using JMX metrics. Since it’s so customizable, we’re able to track individual processes for particular microservices to get an overall idea of the service’s health and performance. It can be really useful for knowing when things go wrong (hello alerts!) and for helping unlock bottlenecks (hello dashboards!).
Depending on your needs and preferences (e.g., on-premises versus web-based or open-source versus paid), there are several other JMX monitoring solutions on the market. You do your research to make sure that investing in this area is worthwhile and that you know what you want to achieve going forward.
Why Should I Monitor Java Applications?
There are countless reasons to monitor your Java applications, but the most significant advantage is unlocking a heap of performance metrics that can help you fine-tune your JVMs and applications to make sure you’re making the most of all resources available to you.
While many developers are familiar with how to configure garbage collection or other settings to help boost the performance of their Java apps, learning to use the JVM framework will take them that much farther when it comes to optimization.
If you’re on the fence about using JVM monitoring to keep tabs on your Java applications, here are some practical reasons and considerations to keep in mind:
- Through monitoring, you can identify issues and potential issues sooner, giving you the best opportunity to correct them before they harm your end-users.
- By revealing the number of resources being consumed by your applications and understanding specific metrics and usage patterns, you can help avoid downtime and delays by allocating more resources when and where they’re needed.
- In the case of applications with a smaller footprint that don’t require a lot of resources, you can improve resource utilization across the board by taking unused resources away and allocating them elsewhere.
- The right metrics can help reveal bottlenecks and room for improvement, allowing you to speed up applications and improve the end-user experience.
Overall, there are countless reasons to pursue Java application monitoring and very few reasons not to. Especially when using JMX monitoring, which is relatively easy to use and implement, your business is likely to notice far more improvements and advantages than it will negative impacts on staff or internal resources.
Why Is JMX Monitoring Important for DevOps?
DevOps teams rely on powerful monitoring tools to better understand how development work behind-the-scenes impacts operations and vice versa. Monitoring tools like JMX can reveal opportunities to boost operational performance by re-evaluating the development processes that negatively impact an application.
Likewise, JMX monitoring can reveal information to the operational team about where future development projects may be necessary or tell the development team how operations are utilizing (or not utilizing) an app. Altogether, JMX monitoring provides numbers that increase observability and helps DevOps work together to achieve better outcomes.
Conclusion
Fine-tuning Java performance has long been a focus of Java developers everywhere, but there are few approaches that don’t require heavy time and resource investments. That’s why combining JMX with the correct monitoring tool is one of the easiest ways to give your team a headstart on understanding and improving the performance of your Java apps.
Whether you’re hoping to better allocate resources to help you keep scaling up, set up notifications to minimize negative end-user experiences, or keep an eye on the numbers to ensure continued success, JMX monitoring offers a suite of tools that can help you get there with ease.
If you are running Java applications, there are a few reasons not to use JMX monitoring. Thanks to its ease of use and plentiful documentation, your team will likely find that implementing and utilizing JMX monitoring is far easier than any manual processes you may already have in place — and your results will improve ten-fold.
When it comes to data storage, not all data is created equal. The information you access daily requires a different level of protection and accessibility compared to long-term storage solutions like hot or cold storage. In fact, a significant portion of a business’s data often goes unutilized due to data management and security challenges, underscoring the importance of having a robust data storage strategy in place.
Understanding the distinctions between these storage types is crucial for optimizing both performance and cost. Hot storage is designed for data that needs to be accessed quickly and frequently, ensuring fast retrieval speeds for real-time applications. Cold storage, on the other hand, is ideal for data that is rarely accessed and can tolerate longer retrieval times, making it a more economical option for long-term archiving.
In this article, we’ll break down the key differences between hot, cold, and warm storage, weigh the pros and cons of each, and provide guidance on choosing the best storage solution for your business.
Contents
- What is hot storage?
- Hot storage options
- What is cold storage?
- Cold storage options
- What is warm storage?
- Warm storage options
- Which storage option?
- How AI is redefining data storage
- How to get the most from your data storage strategy
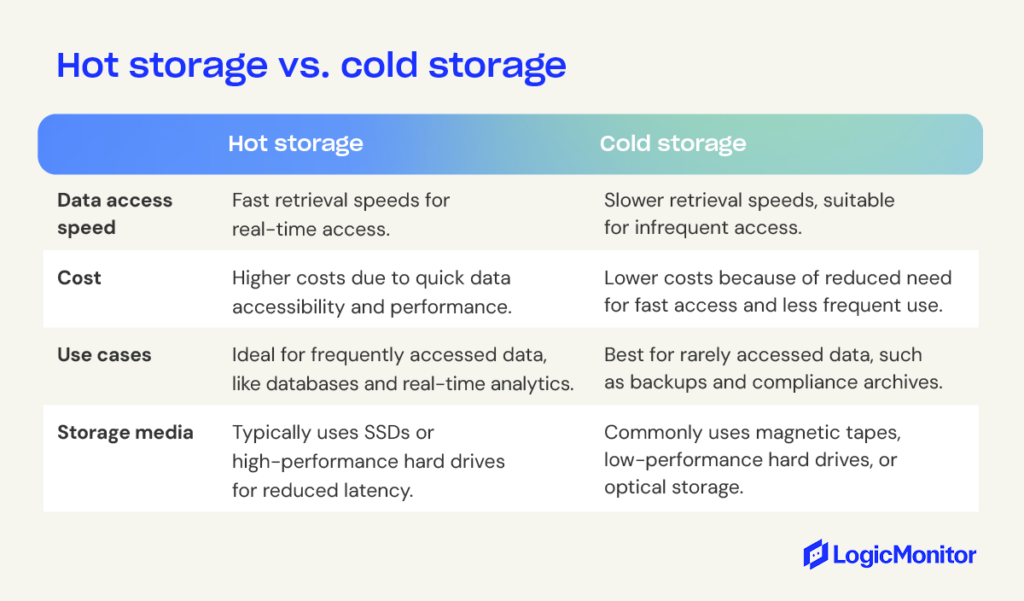
What is hot storage?
Hot storage refers to data that must be immediately accessible, making it ideal for mission-critical applications where delays are unacceptable. The speed at which you can access hot storage depends on its proximity to the data source; data processed closest to the source offers the fastest access times.
Hot storage often utilizes solid-state drives (SSDs) for optimal performance due to their reduced latency and high transactional rates. In contrast, due to their resilience, hard disk drives (HDDs) are preferred for environments with frequent read/write cycles.
Where is hot storage information located?
Hot storage is typically located in edge-storage configurations, where files are stored on servers close to end users. This proximity reduces latency and improves bandwidth, especially during peak traffic times. Edge archival, a form of edge computing, lowers costs by simplifying infrastructure and enhances security by reducing the risk of data interception during transit. The benefits of edge storage include:
- Reduces latency: Storing information closer to the user minimizes lag.
- Better scalability: Edge storage can be easily scaled up or down based on demand.
- Enhanced security: Locally stored information is less vulnerable to cyberattacks than data stored in centralized cloud systems.
- Improved privacy: Data stored separately from the main network enhances privacy.
When to use hot storage vs. cold storage
Hot storage is best used when rapid and consistent response times are necessary, such as in interactive video editing, web content delivery, and online transactions. It’s also suitable for workloads involving numerous small transactions, like telemetry data capture, messaging, and information translation.
The benefits of hot storage
Hot storage offers several advantages due to its non-volatile memory, which ensures data is not lost even during power outages. Its fast access speeds are ideal for real-time processing applications like CRM, ERP, and e-commerce platforms. SSDs in hot storage provide greater reliability than HDDs and receive more frequent backups, reducing the risk of data loss during disruptions. Additionally, the quick retrieval speeds of hot storage facilitate rapid data access.
AWS, Microsoft Azure, and Google Cloud warm storage options
AWS hot archival options
Amazon AWS provides three main types of hot storage: Elastic Block Storage (EBS), General Purpose Instances (GPI), and Provisioned IOPS (PIOPS).
- EBS offers persistent block-level storage with durable disk drives, allowing users to access data as if it were on a traditional hard drive. It combines the durability of standard EBS volumes with the benefits of faster provisioning and block-level access.
- GPI is designed for fast, on-demand response times.
- PIOPS is optimized for consistent low-latency access. It is ideal for heavy transactional workloads like web servers and applications with erratic spikes in I/O requests, such as databases and virtual machines.
Microsoft Azure hot storage options
Microsoft Azure also offers robust hot storage solutions.
- Azure Blob Storage, an object-based service, provides high durability for unstructured data like images or videos.
- Azure’s Hot Add feature allows you to increase performance by adding new disks to virtual machines without downtime.
- Azure’s SSDs deliver high IOPS at low latency, ideal for SQL Server OLTP read workloads and other high-performance applications.
Google Cloud hot storage options
Google Cloud’s hot storage options include persistent disks backed by SSDs, memory-optimized instances with high bandwidth to minimize disk I/O and HDD Snapshots. Persistent disks are suitable for information-intensive workloads, while memory-optimized instances offer peak performance by running entirely on RAM, making them both faster and more cost effective than traditional options.
What is cold storage?
Cold storage is designed for rarely accessed or needed data, primarily for compliance. It is a cost-effective solution for long-term data storage, often retaining information indefinitely. Unlike hot storage, cold storage prioritizes lower costs and slower access speeds since the data doesn’t require frequent retrieval.
When to use cold storage
Cold storage is ideal for archived projects, legal documents, HR records, and other information that doesn’t need frequent access but must be available for reference or compliance audits. It provides a reliable way to store data that needs to be retained over the long term.
The benefits of cold storage
Cold storage offers significant cost savings for data that doesn’t require frequent access. It economically stores inactive data, reduces costs, simplifies archival processes, efficiently meets regulatory requirements, and prevents overloading primary storage with infrequently accessed information.
Regulatory and compliance requirements for cold storage
Industries like healthcare and financial services have strict data storage regulations that require storing information for specified timeframes. Cold storage helps meet these regulatory needs by keeping data accessible as needed and often includes audit trails to log access.
Where to store cold data
Cold data can be effectively managed through various methods, such as low-cost archival solutions, cloud-based storage, annual data monitoring, and archival automation. Slow hard drives and tapes are common mediums for cold storage, but you should regularly test and replace them as necessary. Companies should also monitor device lifespans and retire aging devices before they fail. It is important to evaluate stored data annually to ensure efficient resource use and prevent unnecessary long-term storage.
AWS, Microsoft Azure, and Google Cloud cold storage options
AWS cold storage options
AWS provides several cold storage solutions to cater to different needs. Amazon Glacier Cold Storage is ideal for data not needing to be accessed frequently, offering low-cost storage with slower retrieval times. AWS also offers S3 Standard-Infrequent Access (S3 STANDARD IA), Reduced Redundancy Storage (RRS), and One Zone-Storage Class Memory Cache for Flash/SSD Instances (ZSC), which provide redundant backup options with varying levels of access speed and durability. The Elastic Block Store also offers features such as snapshots and cloning of virtual hard disks for flexible cold storage management.
Microsoft Azure cold storage options
Microsoft Azure’s Cool Blob Storage is designed for data that doesn’t require frequent access or redundancy. This storage option offers cost-effective solutions without guaranteeing long-term retention, making it a good choice for non-critical data. Azure’s Cool Blob Storage only keeps nonactive blocks on disks and offers unlimited snapshot capabilities and public access through anonymous authentication.
Google Cloud cold storage options
Google Cloud offers two primary cold storage options: Nearline Storage and Coldline Storage.
- Nearline Storage is ideal for infrequently accessed data but still needs regular retrieval, such as media archives, regular backups, or disaster recovery.
- Coldline Storage is best suited for data accessed less than once yearly, like outdated backups.
What is warm storage?
Warm storage is a middle ground between hot and cold storage, used for data that is accessed occasionally but does not require immediate retrieval. It caches less frequently accessed information to prevent demand spikes and allows updates at specified intervals, ranging from hours to years. Warm storage often uses cloud-based backup services to reduce the burden on primary servers and employs cost-effective archival systems that may not be constantly online.
When to use warm storage
Warm storage is ideal for data that doesn’t need immediate access but still requires periodic retrieval. It is suitable for use cases such as statistical modeling, time series forecasting, and data replication across multiple servers. Warm storage is also useful in mergers and acquisitions to provide temporary read-only access to data stored in different formats across legacy systems.
The benefits of warm storage
Warm storage simplifies data management by enabling incremental backups, where only changes since the last full backup are saved, making backups and restorations faster and more efficient. This storage method also uses “chunking” to restore data in segments, speeding up the restoration process compared to cold storage.
AWS, Microsoft Azure, and Google Cloud warm storage options
AWS warm storage options
AWS offers two archival options for data that is not in active use:
- Archive storage stores infrequently accessed data at lower costs than standard cold storage. This option provides up to 80% cost savings with reduced durability and availability compared to AWS’s standard archival.
- Or Regional Cold Storage (RRS), where you can store the most rarely used items on tape or disk media near your geographic location. When storing archives this way, you pay less per gigabyte of capacity but will experience longer retrieval times—typically 24 hours or more.
Microsoft Azure warm storage options
Azure Cool Storage is for high I/O workloads that don’t require frequent access. Cool archival keeps inactive hot and cold data in the cloud.
Google Cloud warm storage options
Nearline is a low-cost archival option for infrequently accessed data. Data stored in Nearline can be accessed in less than two minutes. However, if a company goes offline before all replicas are re-established, it may experience a 24-hour delay.
Hot storage vs. cold storage vs. warm storage: Which is right for you?
Choosing the right storage option depends on your needs, and there isn’t a one-size-fits-all solution. Ideally, you should use a combination of hot, cold, and warm storage to effectively balance speed, cost, and access frequency. Here’s what to consider for each type:
- Hot storage is perfect for data you need to access quickly and frequently. It acts as short-term memory, holding active files for real-time applications like online transaction processing (OLTP) and data warehouses that require fast query processing for analytics.
- Cold storage is the best choice for data you don’t need to access often but must keep for the long term. You’ll typically use cold storage for backups, archiving, and compliance. It’s great for storing secondary copies of data, offline backups, and maintaining records for regulatory compliance, legal, or forensic purposes.
- Warm storage offers a balance between hot and cold storage, providing flexibility for data that’s accessed occasionally. It’s a versatile option when you need something that isn’t as frequently accessed as hot storage but still requires more availability than cold storage.
How AI is redefining data storage
Hot storage vs. cold storage isn’t always straightforward. This is especially true with new technology such as artificial intelligence (AI) and the Internet of Things (IoT). Each of these technologies generates massive amounts of data. AI requires significant data to improve the predictive environment’s accuracy levels, where data must be ingested, stored, and prepared. As a result, these technologies have varying archival requirements based on capacity, throughput, latency, IOPS, and other factors. AI and IoT technology will likely need to address hot vs. cold storage and data growth requirements.
How to get the most from your data storage strategy
Most archival vendors use artificial intelligence to enable automatic tiered data storage. Companies define the rules and triggers that the AI software uses to distribute.
A tiered strategy typically works as follows: In-memory archival and solid-state drives frequently serve as the primary tier for storing data you use the most often. A secondary tier stores data only used infrequently on less expensive drives. Dedicate another tier to cold data archival on low-cost, slow disk drives and tapes. Data tiers ensure that data is constantly optimized and distributed to achieve the best results at the lowest cost.
The sheer volume of data companies generate requires highly resilient and flexible archival options. Data archival is the first line of defense for preserving mission-critical information. Companies have a variety of archival options. Speed is the determining factor when evaluating hot storage vs. cold storage. The above tips can help determine which option is best for your company.
For businesses and organizations that need reliable, secure servers to host data, applications, or services worldwide, Linux is often the platform of choice. Linux is a popular operating system because it is open-source, highly secure, and offers a lot of customization options, making it ideal for both personal and professional use.
Let’s learn what Linux is and some of the reasons why it’s such a popular option for setting up and maintaining servers, from emerging startups all the way to full enterprise deployments.
What is Linux?
Linux is an open-source operating system based on Unix known for its stability, security, and flexibility. It powers various devices, from personal computers and servers to smartphones. The kernel, the core component, manages hardware resources and facilitates software communication. Users can customize and distribute their own versions, called distributions, like Ubuntu and Fedora. Developers and system administrators favor Linux for its powerful command-line interface and extensive programming support.
Whether running dynamically scaled workloads in the cloud, creating private cloud infrastructure, or deploying bullet-proof web servers, Linux’s flexibility, scalability, and security make it an ideal choice. You can use it to build reliable, high-performance web servers or as the foundation for custom application development environments.
Based on UNIX principles, Linux offers efficient multitasking and supports multiple users, groups, and access control lists (ACLs). Popular distributions include Ubuntu, Suse, and Red Hat Enterprise Linux, which provide extensive software libraries and security features.
Why is Linux so popular?
Linux’s popularity is due to its flexibility and cost-effectiveness. Many companies integrate Linux servers into their IT infrastructure across various environments, such as embedded systems, private clouds, and endpoint devices. Its open-source nature allows developers to customize their operating systems without vendor constraints.
Here are 9 reasons why Linux is a popular choice for servers:
1. Open-source nature and customization flexibility
Linux is open-source and free, allowing users to modify and distribute it as needed. Its flexibility and customization make it an ideal choice for server operational environments. For example, developers can access code repositories, modify source code, and build custom kernel versions.
In addition to adapting the kernel to specific needs, developers have access to a wide variety of software packages available with most Linux distributions. These packages can be used to add additional functionality or security features, such as firewalls or intrusion detection systems (IDS). Additionally, many distributions come with tools such as lshw (list hardware) and lspci (list devices), which allow administrators to view detailed information about the hardware and devices connected to the server.
Linux offers great customization and flexibility, allowing users to adapt solutions to their needs. Additionally, users can optimize Linux to enhance system performance for specific applications, ensuring that the system runs efficiently and effectively.
2. Range of applications and tools
Linux has become a popular choice for servers because its wide range of applications and tools allow users to customize and configure their systems to perform virtually any task. Linux is compatible with various hardware architectures and easily integrates numerous applications and services.
Linux is well-known for its compatibility and integration with various hardware and software platforms. This makes it ideal for server use; you can deploy it in almost any environment. It is also possible to install Linux on multiple hardware types, from laptops to the latest servers.
The most common uses for Linux servers include web hosting, database management, file sharing, game servers, and virtualization—all of which require specific software packages or libraries to run correctly. Fortunately, Linux’s open-source nature makes it easy to find the necessary components for any type of application or use case, reducing the need to purchase expensive commercial software.
In addition to its vast array of applications and tools, Linux offers an impressive range of user-friendly features that make it a great choice for administrators who want to manage their server environment easily. For example, administrators can leverage projects like Terraform or Ansible to manage large numbers of Linux servers or VMs all at once. Rather than logging in to each system and configuring them individually, the Linux ecosystem makes it easy to deploy and configure environments through repeatable, automated actions.
3. Enhanced security
Built from the ground up with security in mind, Linux has numerous features that make it difficult to breach. A critical security feature is access control capability, which allows admins to set permissions and restrictions on user accounts and files. For example, administrators can set read-only or write-only access rights for users to prevent unauthorized programs from executing on their servers.
Additionally, Linux supports multiple authentication methods, such as username/password combinations, smart cards, biometrics, and digital certificates. These methods provide an extra layer of protection by verifying each user’s identity before granting access to data and resources.
The open-source nature of Linux means that anyone can find, report, or fix a security issue. This is in major contrast to proprietary systems like Windows, where you’re mostly at the vendor’s mercy to identify and fix bugs before hackers find them and use them maliciously.
Linux source code is public, meaning anyone can check their developers’ work to see if they left a door open for hackers. Because of this, Linux is generally seen as more secure than Windows and other proprietary operating systems.
Linux stands out for its lower number of security vulnerabilities than other operating systems, making it a preferred choice for many users and organizations seeking a robust and reliable platform. The Linux community and developers are also dedicated to maintaining a secure environment by providing frequent updates and patches. These regular security updates ensure that any emerging threats are quickly addressed, protecting and securing the system.
4. High stability and reliability
Due to its outstanding reliability, Linux can run for extended periods without needing reboots, making it a popular choice for server operating systems. It’s also incredibly secure and stable, making it well-suited for mission-critical tasks. Linux’s robust open-source codebase and highly active development community mean bugs can quickly be identified and patched. Additionally, many available packages make tools easily accessible to complete the tasks at hand.
Long-term support (LTS) versions of Linux distributions allow users to upgrade reliably without worrying about compatibility issues. Many companies provide dedicated LTS versions explicitly designed for use as servers, with guaranteed support and security updates for up to five years or more.
Linux efficiently manages resources, providing stable and consistent performance. Its robust design ensures system resources are utilized optimally, resulting in reliable and smooth operation even under demanding conditions. This consistent performance makes Linux an ideal choice for both servers and desktop environments.
5. Community support and resources
Linux is widely used as a server operating system due to its robust community support and resources. Support includes user forums, online knowledge bases, live chat help desks, and detailed tutorials.
Linux users benefit from the abundance of dedicated forums. They are filled with experienced professionals eager to help those having trouble with setup or have questions regarding configuration options. Many forums offer personalized advice and general information on topics ranging from hardware compatibility to troubleshooting common issues. Community-driven development ensures that Linux receives regular updates and new features, enhancing functionality and security.
6. Cost-effectiveness compared to proprietary software
You can use Linux to run mission-critical applications while still being affordable. In most cases, you can save money on licensing fees because Linux requires fewer resources than other operating systems. Linux is cheaper because there are no license fees unless you’re paying for RHEL or Oracle. However, it’s important to note that it can require more advanced years than other licensed and supported operating systems.
Linux offers a lower total cost of ownership due to reduced software and support costs over time. Its open-source nature eliminates the need for expensive licensing fees, and the robust support from the Linux community minimizes the need for costly external support services.
7. Scalability for handling large amounts of data and traffic
Linux is highly scalable, making it an ideal platform for servers that handle large amounts of data and traffic. It can run hundreds of services simultaneously and can be configured to provide elastic responses that match the user’s demand. This scalability extends to more than hardware—Linux can scale across multiple systems for added efficiency and flexibility. It offers advanced features like virtualization and fault tolerance to ensure business continuity.
Scaling Linux is easy and seamless. It runs exceptionally well on both physical and virtual machines and can easily handle large loads while maintaining availability and uptime. This makes it ideal for applications that require reliability, such as web hosting and database management.
Linux also offers cutting-edge features for developers, like the eBPF virtual machine and io_uring, which allow developers to track kernel events and perform I/O operations more efficiently. Linux’s stability makes it perfectly suited for mission-critical applications when reliability is crucial. Many users rely on eBPF and robust “user mode” protections to ensure errors or failures don’t affect the entire system. Containers and VMs also exist to further isolate what the kernel and userspace cannot isolate.
8. Compatibility with modern DevOps practices and configuration management
Linux is an important part of modern DevOps practices. Many businesses use it to streamline their software development and deployment processes. With containerization technologies like Docker and orchestration tools like Kubernetes, Linux provides a platform for these tools to operate efficiently. Its lightweight and modular architecture allows for continuous integration/continuous deployment (CI/CD) pipelines, enabling rapid development cycles and more efficient management of infrastructure as code (IaC).
Linux’s high compatibility with configuration management tools such as Ansible, Puppet, Chef, and SaltStack ensures efficient and scalable infrastructure management. These tools allow administrators to automate server provisioning, configuration, and management, creating consistency and reducing the potential for human error.
For instance, Ansible uses simple YAML files to describe automation jobs, which you can execute on any Linux machine without requiring a special agent. Puppet provides a more comprehensive framework with a declarative language that allows administrators to define the desired state of their infrastructure.
9. Support for visualization
Linux excels in virtualization, offering various tools and technologies to create and manage virtual environments. Virtualization allows multiple operating systems to run on a single physical machine, optimizing resource utilization and reducing hardware costs. Tools like KVM (Kernel-based Virtual Machine), QEMU, and Xen enable the creation of virtual machines (VMs) with high performance and security.
Linux’s built-in support for these virtualization technologies ensures efficient resource allocation and management, making it a preferred choice for hosting multiple servers on a single physical host. Additionally, Linux containers (LXC) and containerization platforms like Docker offer lightweight alternatives to traditional VMs, providing isolated environments for applications with minimal overhead. This versatility in virtualization supports diverse use cases, from development and testing to production workloads, making Linux an ideal choice for scalable and cost-effective server solutions.
Conclusion
Linux has grown incredibly popular, as evidenced by its widespread use in web hosting services, cloud computing solutions, home routers, IoT devices, TVs, cars, refrigerators, and anything else with a computer that isn’t a Windows or Mac desktop or laptop. Its lightweight design enables it to consume fewer resources while providing powerful performance levels, which are ideal for server tasks like database management or application hosting.
If you’re considering using Linux for your servers, these seven reasons provide a great starting point to help you decide if it’s right for your business. From security and stability to flexibility and affordability, there are many compelling reasons to give Linux a try.
Security features comparison chart
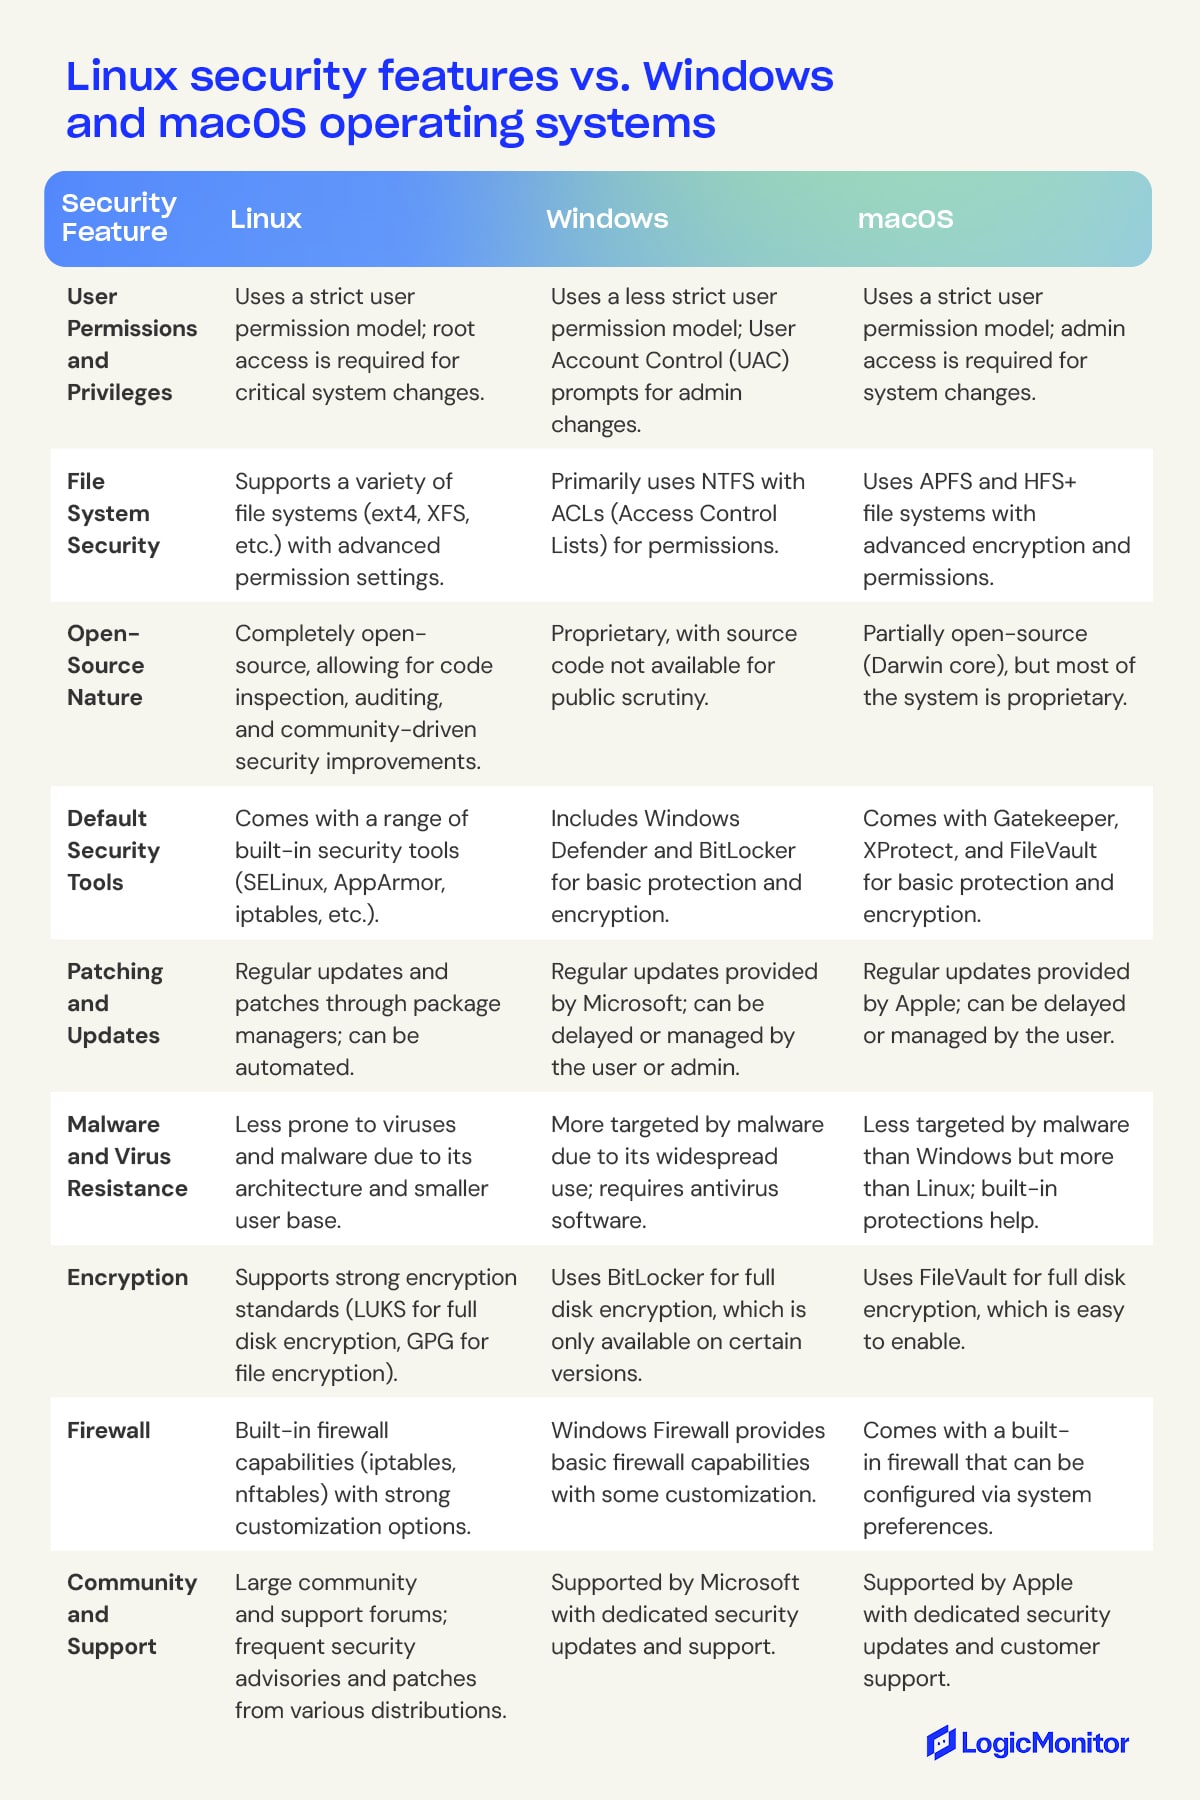
Linux FAQs
How much control do users have over their Linux systems?
Linux gives users a lot of control over their systems. Users can choose how their Linux system looks and works, from the desktop environment to the core system settings. They can also customize security settings, install the software they want, and tweak the system’s performance. Unlike other operating systems with restrictions, Linux lets users manage and modify their systems as they see fit. This flexibility is beneficial for advanced users and IT professionals who need a high level of customization.
How do I troubleshoot and fix boot issues in Linux?
Various factors, such as corrupted boot loader configurations or faulty hardware, can cause boot issues in Linux. Common steps to troubleshoot boot issues include checking the boot loader configuration file (such as GRUB), running filesystem checks using commands like fsck, and examining system logs located in the /var/log directory for errors.
How do I handle file permission and ownership issues in Linux?
File permission and ownership issues can lead to access problems. To troubleshoot, use the ls -l command to check the current permissions and ownership of files and directories. Modify permissions with chmod and change ownership with chown. Ensure that users and groups have access rights to the required files appropriately.
What should I do if my Linux server is running out of memory?
If your Linux server is running out of memory, you can troubleshoot by identifying memory-intensive processes using commands like top, htop, or free. Check for memory leaks or misconfigured applications that consume excessive memory. The Out-Of-Memory (OOM) killer may also come into play, terminating processes to free up memory. Additionally, optimizing your system by adjusting swap space and configuring memory limits for applications can help. Monitoring tools like vmstat and sar provide insights into memory usage patterns. Start monitoring your Linux systems with LogicMonitor and gain valuable insights into their performance.
Contact us today and see how our comprehensive platform can help you optimize your Linux environment. Don’t miss out on this opportunity to take control of your IT operations and stay ahead of the competition with LogicMonitor!
Unlike physical stores and organizations that operate during set hours, the IT world never sleeps. Many believe that when an investment is made in technology, it should be accessible at all times—which is virtually impossible to guarantee. Since disruptions occur, organizations should evaluate the services needed to run operations smoothly. For example, what services are required during an IT service outage to ensure minimal disruptions?
This type of evaluation requires organizations to look at several metrics, including a system’s uptime (or reliability) and availability. Although these two metrics are often used interchangeably, they are different.
These two metrics lead us to the uptime myth. Uptime does not mean availability.
Uptime is the percentage of time a system is up and running. For example, if your app had no downtime in the past month, its uptime is 100%. With a two-hour outage, uptime drops to about 99.72%. Availability includes uptime and maintenance factors. Even if your app runs most of the time, planned maintenance can reduce availability.
Understanding what these two metrics mean and what they don’t can help managed service providers (MSPs) create accurate and transparent agreements.
What is uptime?
Uptime refers to the percentage of time a system is ready for operation under normal circumstances. This metric measures system, solution, or infrastructure reliability and commonly refers to a computer.
So, uptime is how long a machine has been working and available, expressed as a percentage of time. However, uptime does not necessarily mean all services and applications are available and ready for use.
When looking at a service-level agreement (SLA), guaranteed uptime is determined by past performance. However, it does not indicate what will happen in the future.
So yes, uptime can be an indicator of availability, but it is by no means a guarantee.
The Great Google Outage of 2014 is an excellent example of how 100 percent uptime is impossible. During this outage, service to Google applications, such as Google+ and Gmail, was down for 25-55 minutes, affecting approximately 10 percent of users. This example shows the conflict that exists between IT reality and consumer expectations. In the years to follow, moree outages occurred for Google, Facebook, Instagram, Azure, Salesforce, and more. Regardless, consumer expectations remain high.
IT professionals know that 100-percent uptime is a myth, which is why technology is so essential when aiming to deliver a level of service availability that ensures positive customer experiences.
What is availability?
In contrast, availability measures the proportion of time a system is accessible and operational, factoring in both uptime and scheduled maintenance. It reflects overall service reliability, accounting for active operation and planned downtime. This metric is critical when a team is working remotely.
Data shows that 16 percent of companies worldwide are now 100 percent remote, and since 99 percent of people would choose this option for the rest of their lives, even if it were just part-time, this percentage will likely rise in the coming years.
Related: How IT Departments Are Evolving in an Era of Remote Work
When comparing these two metrics, consider the difference between uptime and availability as OEE (overall equipment effectiveness) and TEEP (total effective equipment performance).
Understanding both of these metrics is important because incorrect assumptions can be costly. Viewing these metrics incorrectly will often lead to a poor experience. Service providers will meet the thresholds in their agreement, but the level of service will be lower than the customer expected.
This phenomenon is what’s referred to as the watermelon effect.
Outputs can meet defined targets, but the outcome is not achieved, leading to unhappy customers.
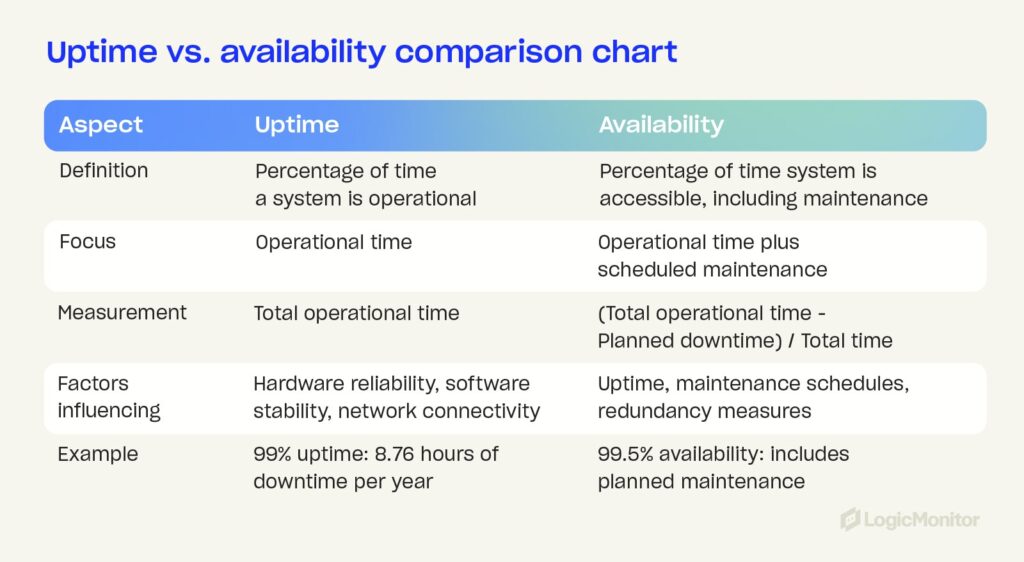
Diving deeper into the watermelon effect
The watermelon effect is the byproduct of thinking your IT metrics meet all requirements. However, the customer has a poor experience. Metrics look green on the outside, but on the inside, they are red.
SLA reports can look good, leaving the MSP happy. In contrast, customers aren’t satisfied and take their business elsewhere. Customer experience is essential, so an MSP should never underestimate the importance of support metrics.
The greater the level of transparency around the end-user experience, the easier it is for IT teams to focus on helping the end-users. Diving deeper into “red” metrics helps IT teams focus on what matters most. The best thing to do is lean in fast and hard, maximizing the time to fix problematic metrics before a project or quarter ends.
So, even if uptime metrics are met, it’s critical to consider customer experience if clients feel the value of a service is still missing. If engagement dips, the driving forces that encourage change drop, and businesses cannot accurately improve the matters that matter most to customers today.
The key is to identify issues before they become problems. An observability platform such as LogicMonitor can help achieve this.
The concept of the Five Nines
“Five Nines” refers to an uptime or availability rate of 99.999 percent. For example, the availability level “1 Nine” signals 90 percent uptime, which equates to 36.5 days of downtime per year. As availability levels increase, so does the associated uptime. When companies advertise “5 Nines” availability, this refers to an uptime measurement of 99.999 percent or approximately 5.26 minutes of downtime annually.
The Five Nines of uptime and availability is a significant selling point, which is why suppliers market a 99.999 percent uptime SLA. The issue is that, in some cases, each additional Nine added to an uptime or availability score does not necessarily guarantee greater reliability. It’s more important for customers to focus on the supplier or service provider based on their capabilities.
As a managed service provider, this is where you can shine.
For example, working with customers to develop a business continuity plan can make a difference when disruptions occur. To achieve the Five Nines, you must consider both equipment and personnel. Uptime and availability are determined by equipment not going down — these metrics are also affected by how quickly the response is when components fail. A business continuity plan is imperative.
This requires a proactive approach, such as using automated tools to better respond to unexpected events.
Read more: Solutions to Strengthen Your IT Business Continuity Plan
More on SLAs
Although it’s important to be aware of critical metrics and company stats, SLAs can be reasonably meaningless when customers seek an accurate measurement tool. Companies must look at the bigger picture to gauge the value of an agreement. SLAs require a certain level of commitment. Boasting a 99.99 percent SLA is excellent, but this commitment is challenging to meet if there isn’t enough staff to assist when an issue occurs. So, the higher the number of Nines, the more resources are required.
This type of agreement often leads to a gray area; compensation is usually minimal or non-existent when issues occur. For example, cloud providers frequently provide customers with service credits if an outage occurs. However, these credits do not generally cover the costs. For example, an outage can negatively affect a company’s ability to trade or sell, resulting in lost revenue or a damaged reputation.
The “four-hour SLA response window” is another variable that businesses must be aware of when creating a disaster recovery plan. Suppliers often include this four-hour window in their terms and conditions, and while it sounds ideal, it doesn’t mean issues will be fixed within that window. Instead, it means the supplier will begin troubleshooting within that time. As a result, systems can be offline longer and often are.
SLAs vs. SLOs
To ensure outstanding customer service, some MSPs no longer offer guarantees on SLAs but instead set Service Level Objectives (SLOs). SLOs are internal goals measured by Service Level Indicators (SLIs), which track performance against objectives like uptime. For example, an MSP might aim for 99.96% uptime on hosted servers. This approach helps measure compliance and avoid disputes.
It’s also beneficial to create different SLAs for various workloads. High-priority services, such as cloud infrastructure, may require 5+ Nines for greater functionality, while low-priority workloads can tolerate lower performance levels. Essentially, SLAs are external commitments, often with penalties for non-compliance, while SLOs are internal targets that help manage service quality effectively.
How are uptime metrics and availability metrics tracked?
Calculating uptime and availability metrics is possible but can be challenging to measure accurately. Network uptime, for example, refers to the time a network is up and running. This is tracked and measured by calculating the ratio of uptime to downtime across 365 days, which is then expressed as a percentage.
Here is an example of how to calculate network uptime:
- 24 hours/day x 365 days/year = 8,760 hours/year
- Number of hours your network is up and running per year ÷ 8,760 hours x 100 = Yearly uptime percentage.
So, if your network is down for 7 hours during the year, network uptime would be:
- 8,753 ÷ 8,760 = 0.9992
- 0.9992 x 100 = 99.9.2 percent
Again, uptime is directly related to past performance, which is why challenges arise. For example, a cloud solution with a 99.999 SLA commitment may be available. However, vulnerabilities and even cyberattacks can cause outages beyond the vendor’s control. If the service is affected for days, its availability will decrease.
- When measuring availability, the measurement is driven by time loss.
- When measuring reliability (uptime), the measurement is driven by frequency and the impact of failures.
Businesses can also use monitoring services to track server uptime consistently.
Case study: Stripe’s 99.9999% uptime during BFCM weekend
Overview: Stripe, a leading online payment service provider, achieved an impressive 99.9999% uptime during the 2022 Black Friday and Cyber Monday (BFCM) weekend. This is only ~31.5 seconds of downtime annually, demonstrating their exceptional infrastructure and meticulous planning.
Key achievements:
- Platform uptime: Maintained 99.9999% uptime during BFCM, handling over 20,000 requests per second and processing more than $3 billion in transactions daily.
- CTO insight: David Singleton, Stripe’s CTO, noted that even a 5-minute downtime could lead to significant revenue losses in the tens of millions.
Strategies for success:
- Workload and capacity planning
- Simulation and load testing: Stripe conducted extensive simulations and load testing to prepare for BFCM traffic. They determined the necessary infrastructure capacity by ramping up traffic and analyzing system behaviors.
- Peak load handling: Their infrastructure handled over 20,000 requests per second during peak times, justifying the investment in robust capacity planning.
- Availability and uptime SLA
- Ambitious targets: While a 4 or 5 Nines uptime is common, Stripe exceeded expectations with six Nines during BFCM, maintaining a 90-day average uptime of five Nines.
- Calculation of downtime: Using the power of 10 trick, Stripe calculated downtime to ensure they met their availability targets. For example, 3 Nines availability results in approximately 1.44 minutes of daily downtime.
- API performance
- PaymentIntents API: Achieved a 99.9999% success rate through rigorous stress testing, ensuring high responsiveness and minimal errors even under peak traffic conditions.
Lessons learned:
- Workload and capacity planning: Essential for managing high traffic and ensuring system reliability.
- Stress testing: Critical for identifying potential issues and ensuring the system remains robust under peak loads.
- Setting ambitious targets: Helps in driving the commitment to high availability and reliability.
Conclusion: Stripe’s exceptional uptime during the BFCM period is a testament to their dedication to reliability and scalability. Their approach to workload planning, capacity testing, and ambitious availability targets sets a high standard for other companies facing similar challenges during peak traffic periods.
What other key metrics are relevant surrounding uptime and availability?
When customers evaluate MSPs, they do so using metrics. Relevant metrics are also monitored by those in management roles at MSP organizations. The goal is to ensure they maintain suitable performance levels and actively improve key performance indicators (KPIs).
Uptime is usually covered under service improvement metrics. However, several other metrics are worth paying attention to as an MSP. These metrics leverage data to highlight deciding factors between IT providers.
- Renewal rate: Although this metric is not directly associated with uptime and availability, it does indicate whether customers are receiving the service they expect. If the renewal rate is low, it’s time to ask why. What expectations are not being met? While customers may choose not to renew for several reasons, seeking feedback is important.
- Customer satisfaction: These scores are strong indicators of customer service quality. Again, diving deeper and focusing on metrics such as uptime and availability can provide greater insight into high-level metrics.
- Mean time to notify (MTTN): This is the average amount of time that passes before an MSP notifies a customer about a service outage.
- Mean time to repair (MTTR): This is the average time an MSP takes to resolve an issue. To remain competitive, strive for a low MTTR.
In that sense, uptime and availability are essential to consider, but they are not the be-all and end-all of MSP metrics. There is a bigger picture to consider when monitoring managed services.
Which is more important, uptime or availability?
Availability is becoming an important metric based on the transition toward remote work. While both metrics matter, especially when creating SLAs, they are only part of the overall picture. It is not just the metrics that are important, but more so what you do with them.
To improve service uptime and availability, it is essential that customers understand we do not live in a perfect world. Communication is crucial, especially concerning the needs and requirements of customers.
Continuous monitoring is vital in addition to running tests, implementing fail-safes, and working towards getting rid of failure points. Monitoring availability provides clarity, and that is how you build a highly available system.
Is uptime irrelevant?
Achieving 100 percent uptime is an unattainable objective. As discussed, uptime reflects past performance. In that sense, it is a valuable indicator of future availability, but it is not a guarantee — and 100 percent uptime remains virtually impossible.
That is why businesses must focus on project maintenance requirements and potential logistical delays. In doing so, they can more accurately forecast downtime to improve availability. To address consumer expectations, IT teams must anticipate problems and improve visibility to recover faster. Complete coverage, flexible integrations, and deep reporting will remain critical focus areas to achieve this.
Learn how the Minnesota Vikings leveraged LogicMonitor to achieve outstanding IT performance. Dive into the full case study to discover the strategies and solutions that can enhance your uptime and availability.
Telemetry is the automated process of measuring and wirelessly transmitting data from remote sources. It involves using sensors to collect electrical data (such as voltage and current) and physical data (such as temperature and pressure). This data is sent to remote locations for monitoring and analysis, enabling effective management and control of systems.
Why it matters for IT monitoring
Modern, dynamic distributed systems require comprehensive monitoring to understand software behavior in various situations. Customers face challenges tracking the software’s performance in the field and responding to various modifications. To keep up with digital advancements, it’s essential to have a simple way to collect data from various products and share it for analysis. This need led to the creation of telemetry and OpenTelemetry.
In this article, we will explore what telemetry is, how it works, and its significance for application monitoring. We will also discuss its benefits to customers and its impact on software development.
What does telemetry mean for application monitoring?
Telemetry is one of the latest ways to track software progress. It helps developers stay aware of the software’s performance and notifies them if a problem occurs with the application.
Software development is a great way to learn which features end-users prefer and which require modification. This system also notifies the developers if there is a problem with the application, like a bug. It gives the developers enough time and data to rectify the problem and introduce an even better version in the market. It is an important step in ensuring the end-user gets the best application version.
How does telemetry work?
Telemetry for application monitoring is a four-step process:
Step 1: Specifying the metrics
This step involves planning how the telemetry will occur. Metrics are specified for the developer’s process to track the performance of their application. The developers need to create a plan of action for what should happen if the given hypothesis is validated. This helps prioritize the work.
Then, the developer needs to specify the lifetime of the telemetric run. It depends on the cost and returns on the investment of the run. Once you have specified the life, you will give the formula the telemetrics would calculate. The developer needs to mention the necessary data points here.
Step 2: Data transmission
Telemetry requires tracking the user’s activity on your application. That makes it important for the developer to stay aware of privacy laws and regulations. For that purpose, the best action is to get the end user to sign up for telemetry data analysis.
You must also ensure data transmission and safety to make the process safe and secure. It should not be able to easily fall into the hands of hackers or any third-party users. Sometimes, when the device is connected to a metered network, it may incur charges. That is why waiting until the device is connected to an unmetered connection is better.
Step 3: Data processing
Once the data is transmitted and stored, it must be processed before it can be used. For that purpose, various mathematical formulas are run to make data digestible for the analysis. The method adopted for the data processing may depend upon the type of metrics the developer sets.
For metrics involving a formula, the step mainly applies the data to simplify the results. If required, the results are merged with other data sets. For exploratory metrics, a data mining approach is adopted. In this method, computer algorithms are run to find the hidden pattern in the data.
Step 4: Data analysis
The final step of the telemetric process is to perform the analysis of the data. Once the data has been collected and filtered into their respective data sets, the data is analyzed to see the performance of the software. In this step, all the issues and bugs with the application are reported and rectified by the developer.
Once the developer implements the action plan, the identified problem is removed from the application. It helps improve the application’s user experience, making it better and easier for the user.
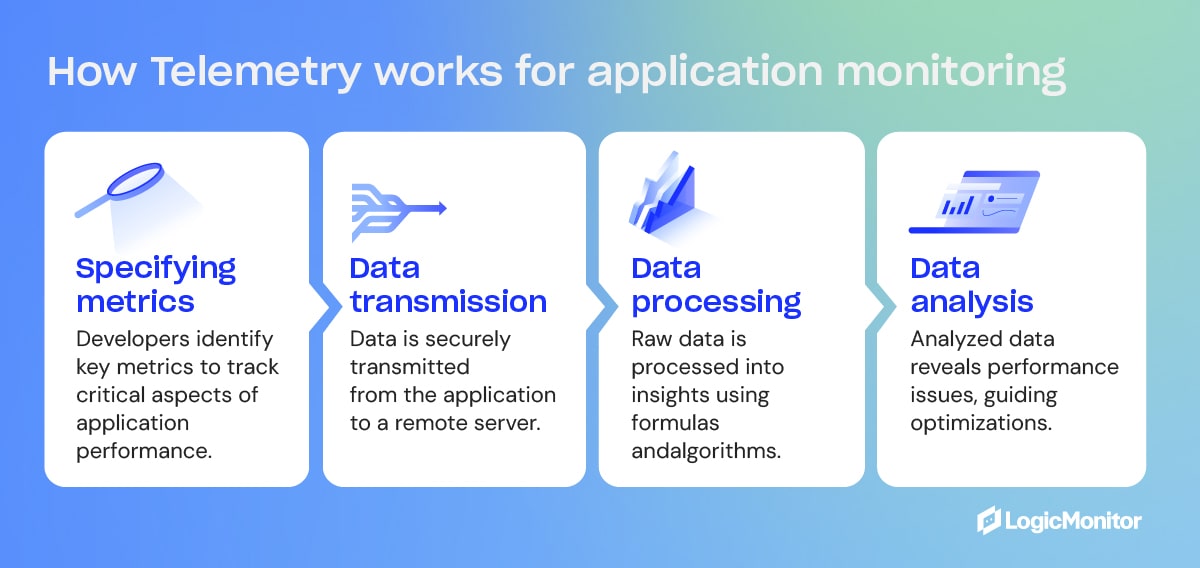
What is telemetry data?
Telemetry data refers to the automatic collection and transmission of logs, metrics, events, and traces from remote sources using sensors and protocols. This data is sent to centralized systems for monitoring and analysis, enabling effective system management and control.
Telemetry data comes in various forms, each offering valuable insights for effective system monitoring and management. Here are the main types:
Environmental Data: Includes information about the physical conditions around a system or device, such as temperature, humidity, and air pressure. Monitoring environmental data is crucial for maintaining optimal operating conditions and preventing damage from adverse environmental factors. For example, tracking temperature and humidity in data centers helps ensure equipment runs safely and efficiently, extending its lifespan.
Performance Data: Focuses on how well a system is working. This data type includes CPU usage, memory utilization, network latency, and throughput metrics. By monitoring performance data, organizations can identify slowdowns, optimize resource use, and ensure systems run smoothly. For instance, monitoring CPU and memory usage in real time can prevent server overloads and avoid system crashes.
Operational Data: Relates to a system’s daily functioning and health. This category includes metrics like uptime, error rates, transaction volumes, and system alerts. Operational data is essential for ensuring systems are reliable and available. By monitoring these metrics, businesses can quickly spot and fix issues before they become major problems, ensuring continuous service. For example, tracking uptime and error rates helps IT teams maintain high service levels and meet their Service Level Agreements (SLAs).
Benefits of telemetry
Telemetry has become so ingrained with DevOps teams because it helps reduce their work. Once an application is introduced in the market, it gets scattered across various parts of the world. At that point, it becomes nearly impossible to keep track of all the applications and ensure they work optimally.
Telemetry gives you the tools to keep track of performance from all outlets. All of the important information regarding the application and its performance is reported to you at your place, no matter how remote the end user’s location is. This makes telemetry an ideal method for improving the application.
Here are a few benefits that telemetry provides the developers:
Reports the best and worst features
The telemetric analysis helps the developer learn which software features are the best. Through the analysis, developers will learn which software feature is frequently preferred by users in a region. It also helps the developer learn which features must be included in the next version to ensure the application is even more popular.
Telemetric analysis also helps users learn about the applications’ features they do not prefer. This gives the developers a chance to improve those features so that they can also be used frequently, which will help improve the application’s rating.
Reports the customer’s preferences
Telemetric analysis data informs the developers of the users’ preferred application settings, such as which display types they prefer. This makes it easier for the developers to modify the application based on the data to match the users’ needs.
It also informs the developers which users commonly use screen configuration and display backgrounds. That way, the developers can modify the application to become more compatible with that kind of screen orientation and device settings. When users find these settings in the application by default, they would surely prefer to use the application.
Reports the user’s engagement with the application
User engagement is a key metric determining an application’s rating. Applications that can keep users engaged for a long time with their content are more successful in application rating. That is why telemetry analysis of the application is important.
Through it, the developer can learn how much time the user spends on their application. Then, they can work towards improving that time by introducing interactive and engine content. By knowing the users’ favorite features, the developers can keep them engaged with their applications for a long time.
Reports the crashes
Each time an application crashes, it is instantly reported to the developer through telemetric data transmission. This information also provides insights into the crash context, identifying which apps were running in the background at the time of the crash. Additionally, it tracks the frequency of application crashes on a device.
This information aids the developer in identifying and rectifying the causes of crashes. If the data reveals that another application is responsible, the developer will ensure that their application remains stable when used at the same time as others. That is why the crash context is really important and provided to the developer by the telemetric data transmission.
Telemetry challenges and considerations
Data privacy and security concerns
Handling large volumes of telemetry data requires a focus on data privacy and security to protect sensitive information. Ensuring that telemetry data is securely collected, transmitted, and stored is vital to prevent unauthorized access and breaches. Implementing strong encryption methods and adhering to privacy laws and regulations, such as GDPR, are essential practices to safeguard data.
Handling large volumes of telemetry data
Managing large volumes of telemetry data involves efficient data processing and storage solutions. Scalable cloud storage, data compression techniques, and real-time data processing frameworks help handle the influx of telemetry data. These methods ensure that the data is readily available for analysis without overwhelming system resources.
Ensuring data accuracy and reliability
Implementing data validation and cleansing processes is crucial to maintaining the accuracy and reliability of telemetry data. Regularly calibrating sensors and using redundancy checks can help detect and correct errors in the data. Ensuring that the data collected reflects the true state of the monitored systems enables accurate analysis and decision-making.
Advanced uses of telemetry
Telemetry data isn’t just for monitoring systems in real-time; it also has advanced uses that can significantly enhance system management and decision-making. Here are two key areas:
Predictive analytics
Telemetry data can be used in predictive analytics to foresee system failures before they happen. Organizations can predict and address potential issues by analyzing historical data, patterns, and trends. This minimizes downtime and keeps systems running smoothly.
AI and machine learning
Integrating telemetry data with AI and machine learning can enhance automation and decision-making. AI algorithms can analyze vast amounts of telemetry data to identify anomalies, optimize performance, and make real-time adjustments. Machine learning models can continuously learn from the data, improving their predictions and actions over time, leading to smarter and more efficient systems.
Future trends in telemetry
The future of telemetry holds significant potential across various sectors, driven by advancements in technology and increasing demands for real-time data analysis and automation. Here are some key trends to watch:
- Internet of Things (IoT) integration: As IoT devices multiply, telemetry data will grow exponentially, offering deeper insights into performance, conditions, and user behavior. In smart homes, cities, and industrial automation, IoT integration with telemetry will enable more efficient systems.
- Edge computing: Edge computing enables real-time data processing near the data source, crucial for low-latency applications like autonomous vehicles and industrial automation. By processing telemetry data at the edge, systems respond faster and more efficiently, reducing the need for constant data transmission to central servers.
- Enhanced security measures: As data transmission grows, securing telemetry data is crucial. Future systems will likely use stronger encryption and security protocols to protect sensitive information, especially in finance and healthcare sectors.
- Environmental monitoring: As climate change and sustainability become pressing issues, telemetry will be key in monitoring environmental conditions. Future trends may involve advanced sensors and analytics to track pollution, weather patterns, and resource usage.
Practical applications of telemetry and real-world examples
Telemetry data is widely used across various industries, providing essential insights for monitoring and improving systems. Here are some practical applications and real-world examples from different sectors:
IT and software
In the IT industry, telemetry data is crucial for monitoring system performance, detecting anomalies, and ensuring optimal operation. For instance, cloud service providers use telemetry to track server uptime, CPU usage, and network latency. Analyzing this data, they can predict failures and automatically scale resources to maintain service reliability and performance.
Healthcare
Telemetry in healthcare involves monitoring patient vital signs remotely. For example, wearable devices collect data such as heart rate, blood pressure, and oxygen levels and transmit this information to healthcare providers for real-time monitoring. This allows for timely intervention in the event of any abnormalities, improving patient outcomes and reducing hospital visits.
Automotive
Telemetry is used for various testing and operational purposes in the automotive industry. Automotive telemetry systems can measure torque, stress, and temperature on critical components like driveshafts and brakes. For example, Accumetrics’ systems provide real-time torque measurements from vehicle drivelines, helping engineers optimize performance and ensure safety during high-stress conditions such as racing or heavy-load transportation.
Aerospace
Telemetry plays a vital role in aerospace, monitoring and analyzing the performance of aircraft components. Aerospace companies use telemetry data to track parameters such as engine temperature, vibration, and pressure. This data helps predict failures and schedule maintenance proactively. A notable example is NASA’s telemetry monitoring of rotor blade dynamics on helicopter models, improving flight safety and performance.
Conclusion
Telemetry has revolutionized software development and monitoring by simplifying the process of gathering and analyzing data from remote sources. It provides essential insights into system performance, environmental conditions, and operational health, enabling IT teams to identify and resolve issues proactively.
Advancements in IoT, AI, edge computing, and enhanced security measures will further enhance the power of telemetry. These technologies will allow for more sophisticated data collection and analysis, predictive maintenance, and improved decision-making.
Telemetry is indispensable for maintaining optimal system performance and driving continuous improvement. It helps developers learn from initial versions and improve subsequent ones, ensuring applications effectively meet user needs. As telemetry continues to evolve, it will remain a cornerstone of efficient and reliable IT management, essential for application monitoring.