Helm is a powerful package manager for Kubernetes that automates application deployment, upgrades, and management. By simplifying the process of organizing microservices, Helm helps developers scale their applications more efficiently while reducing the complexity of managing Kubernetes manifests.
Anyone familiar with writing Kubernetes manifests knows how tedious creating multiple manifest files using YAML is. Even the most basic application has at least three manifest files. As the cluster grows, the more unwieldy the configuration becomes. Helm is one of the most useful tools in a developer’s tool belt for managing Kubernetes clusters. This article explores Helm’s basic features to give you an idea of how you might use it to help with your Kubernetes deployments.
What is Helm?
Helm package manager for Kubernetes applications includes templating and lifecycle management functionality. It is a package manager for Kubernetes manifests (such as Deployments, ConfigMaps, Services, etc.) grouped into charts. A chart is just a Helm template for creating and deploying applications on Kubernetes.
Charts are written in YAML and contain metadata about each resource in your app (e.g., labels, values, etc.). You can use a chart by itself or combine it with other charts into composite charts, which you can use as templates for creating new applications or modifying existing ones. Helm essentially allows you to manage one chart version for your different environments.
Helm architecture
The Helm uses a client/server architecture that consists of the following components:
- Helm client: The client is the user interface to Helm. It creates new charts, manages repositories, and releases packages. You can install the Helm client on macOS and Linux and it is available as a Chrome extension as well. Developers also use Helm to test upgrades before releasing them into production.
- Helm library: The Helm library is a set of client libraries that clients use to interact with the Kubernetes API server to install, upgrade, or roll back charts. The tool is installed on every node in the cluster and is a required component for installing any chart.
What are Helm charts?
Chart is the packaging format used by Helm. It contains the specs that define the Kubernetes objects that the application consists of, such as YAML files and templates, which convert into Kubernetes manifest files. Charts are reusable across environments. This reduces complexity and minimizes duplicates across configurations. There are three basic concepts to Helm charts:
- Chart: A Helm chart is a pre-configured template for provisioning Kubernetes resources.
- Release: A release represents a chart that has been deployed.
- Repository: A repository is a public or private location for storing charts.
When working with Helm, developers search repositories for charts. They install the charts onto Kubernetes clusters, which creates a release.
Helm Chart Structure
The files and directories of a Helm chart each have a specific function:
YOUR-CHART-NAME/
|
|- charts/
|
|- templates/
|
|- Chart.yaml
|
|- values.yaml
Charts: The charts directory contains other charts the main chart depends on. A single chart could depend on several charts. Thus, there might be multiple charts in this directory.
Templates: This folder stores the manifest being deployed with the chart. For example, you may deploy an application that needs a service, a config map, and secrets. In this case, the directory would contain a deployment.yaml, service.yaml, config.yaml, and a secrets.yaml. Each of these files would get its values from the values.yaml file.
Chart.yaml: This file holds meta information such as the version, name, search keywords, etc.
Values.yaml: Default configuration values for the chart.
Benefits of using Helm
Developers and DevOps teams appreciate Helm’s ability to automate complex Kubernetes deployments. The tool frees them up to focus on more value-added tasks. The tool is very user-friendly, so you don’t need special skills or knowledge. The user interface is intuitive, meaning you can easily manage your cluster deployments.
Strong security model
It is a very secure solution that ensures you can only install packages you trust in your cluster.
Flexible
It is a very flexible and customizable solution that makes installing different packages on your Kubernetes cluster easy.
Large package ecosystem
It has a very large ecosystem of packages, so you can find the package you are looking for.
Community support
Helm is an open-source tool supported by a large community of developers. That means there’s plenty of support and advice if you encounter challenges.
Helm simplifies deployments
Helm charts allow developers to provision Kubernetes resources with the “click of a button” (or via a command if using the command line interface). Additionally, the tool enables developers to perform complex deployments by including chart dependencies within other charts.
Automatic versioning and rollback capabilities
Keeping track of versions across deployments can be a challenge. Helm automatically handles this task. The tool keeps a database of all release name versions. That way, if something goes wrong, the developer can simply roll back to the previous version. Each deployment creates a new version, allowing for easy tracking of changes over time. If a deployment encounters issues, rolling back to a stable version is fast and straightforward, minimizing any potential system performance disruptions.
CI/CD Integration
DevOps engineers enjoy the tool’s seamless CI/CD pipeline integration. Helm provides integration hooks that you can configure to perform certain actions. For example, these hooks can be configured to act before installation begins or after installation. You can also use these hooks to run health checks on the Helm deployments and verify if the deployment was successful. Additionally, these hooks can trigger automated tests or rollbacks based on specific conditions, allowing teams to maintain a robust and streamlined deployment pipeline with minimal manual intervention.
Helm boosts developer productivity
As we mentioned, you can share helm charts. These templates mean you won’t need to spend time rewriting manifests for common tasks. You can also use them to quickly generate a new chart based on one of your existing templates. For example, if you want to generate a new Kubernetes application with a specific service account, you can do this with a single line of code. This makes it easier for your team to scale with Kubernetes, as you won’t need to rewrite manifests to handle the same tasks.
Helm smooths the Kubernetes learning curve
Kubernetes is a complex tool with many features and configuration options. The learning curve can be overwhelming. Using Helm removes the complexity and makes Kubernetes more approachable. You can begin using Helm with a single command to install a chart. It also has a user-friendly graphical interface. You can search for charts in the public repository to find one that meets your needs.
Private repositories also allow your company’s engineers to upload their charts for other employees to install. Where other tools may require configuration files, Helm uses a declarative approach. You can specify all of your desired settings in a single file and then install the chart. With Helm, you can also set up automated updates and deployment schedules to keep your cluster up to date with the latest software.
Application configuration during deployment
Another distinguishing feature is the ability to provide application configuration during deployment. Not only can you specify the Kubernetes resources (deployments, services, etc.) that make up your application, but also the environment-specific configuration for those resources. This allows the same Helm chart to be used across all of your environments.
Creating a basic Helm chart
To create a Helm chart, you first need to create a directory where the chart will live. Then, you can create the Helm file in that directory. The following example shows how to create a Helm chart that deploys an application to a Kubernetes cluster.
# mkdir my-app
# cd my-app
# helm init
# helm install --name my-app kubernetes/my-app
The –name flag tells Helm which name to give the chart when installed. The next step is to configure the Helm chart. You do this by creating a file called config/helm/my-app.yaml in the same directory as the Helm file. The following example shows how to configure the my-app chart to deploy an application named hello world.
apiVersion: apps/v1beta1
kind: Deployment
metadata: config/helm/my-app.yaml
     name: my-app
     labels:
     app: hello world
spec:
     replicas: 1
     template:
          metadata:
               labels:
                     app: hello world
spec:
     containers:
     -name: hello
     image: kubernetes/hello
     ports:
     - containerPort : 80
The first line in the example sets the API version for the my-app object to apps/v1beta1. The next line sets the kind of chart to be a Deployment. The metadata for the my-app chart will be stored in the file config/helm/my-app.yaml.
The labels field in this file will contain the name of the application being deployed, and the spec field will contain the application’s configuration. In this case, only one container will be deployed, and it will have port 80 open. The last line in this file sets up the template for the my-app chart, which tells Helm how to create and deploy the application.
To run the my-app chart, you can use the helm command.
# helm list
# helm deploy my-app
The first command lists all of the charts that are currently installed on your system. The second command deploys the my-app chart to a Kubernetes cluster. Helm provides developers with an elegant way of packaging and deploying applications in a Kubernetes cluster.
Streamline Your Kubernetes Workflows with Helm
Helm streamlines Kubernetes workflows by simplifying package management and automating deployments, pushing Helm upgrades and Helm rollbacks. With its reusable charts, Helm reduces complexity, integrates metrics, improves consistency across environments, and saves developers time, allowing them to focus on scaling applications rather than manual configuration. Whether you’re managing a single cluster or scaling across multiple, Helm’s automation capabilities make Kubernetes easier to manage while ensuring your applications are deployed efficiently and reliably. Integrating Helm into your DevOps pipeline will optimize workflows and enhance overall productivity.
Effective server management is crucial for maintaining the health and performance of IT infrastructure. HP iLO (Integrated Lights-Out) offers a powerful solution for remotely monitoring and managing HP servers, providing a wide range of features designed to streamline operations and ensure uptime.
Whether you’re an IT professional looking to optimize your server management practices or evaluating HP iLO monitoring as a potential solution for your organization, understanding its capabilities and best practices is essential.
This article provides a deep dive into HP iLO and offers comparisons to other infrastructure monitoring tools. Learn more about configuration specifications and explore some of the best practices for implementing HP iLO server management.
Key features of HP monitoring solutions
HP monitoring solutions are designed to enhance server performance on network devices through comprehensive remote management and real-time monitoring. Here’s what HP iLO offers:
- Remote server management and monitoring: Allows administrators to manage servers remotely, ensuring quick response times even when on-site access isn’t possible.
- Real-time performance tracking: This service offers real-time monitoring of server health metrics, such as CPU usage, temperature, power supply, and power consumption. LogicMonitor’s article, HP Hardware Health, provides further details.
- Advanced alerting and reporting capabilities: Immediately mitigate potential issues on HP devices by setting up alerts for critical events.
- Power management and efficiency features: Integrated advanced power management tools optimize energy usage.
- Integration with other IT management tools: Integrating with tools like LogicMonitor provides a centralized platform for managing entire IT infrastructures.
HP iLO vs. other monitoring tools
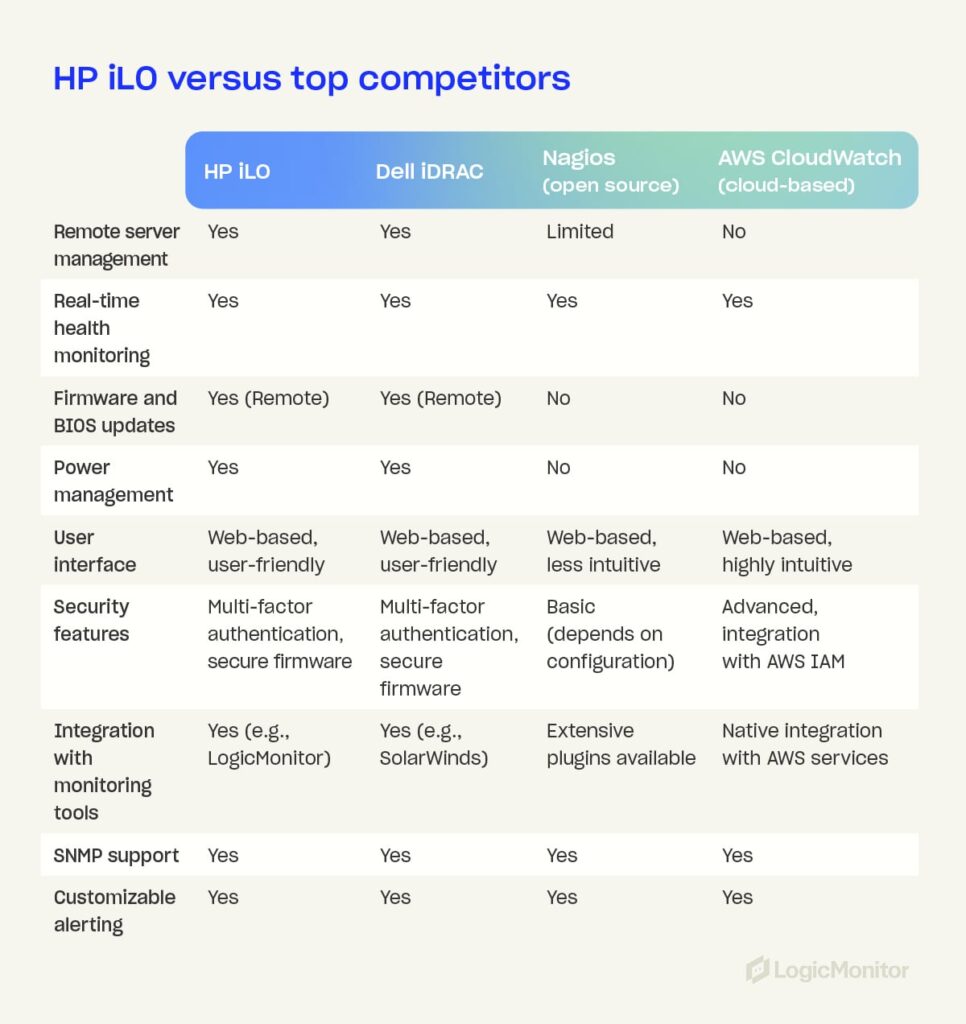
Choosing the right network monitoring tool for your mobile devices depends on various factors, including features, cost, and ease of use. Here’s how HP iLO compares to other popular monitoring tools:
HP iLO vs. Dell iDRAC
- Remote access: Both offer strong remote network management capabilities, but HP iLO excels in user-friendliness.
- Power management: HP iLO provides more granular power management options.
- Security: Both tools have robust security features, though HP iLO’s integration with LogicMonitor enhances its monitoring capabilities.
HP iLO vs. open-source monitoring solutions
- Cost-benefit analysis: HP iLO’s licensing cost is higher, but offers professional support and advanced features for end users that open-source solutions may lack.
- Ease of use: HP iLO is more user-friendly and requires less manual configuration than open-source tools.
- Community support and customization: Open-source tools offer extensive customization, while HP iLO provides a more standardized solution with strong vendor support.
HP iLO vs. cloud-based monitoring tools
- Cloud integration: While cloud-based tools excel at managing hybrid environments, HP iLO offers more specialized features for on-premises server management.
- Scalability: Cloud-based solutions are typically more scalable, but HP iLO’s integration with LogicMonitor can bridge this gap.
- Security and compliance: HP iLO provides strong security measures, which are crucial for compliance in industries like finance and healthcare.
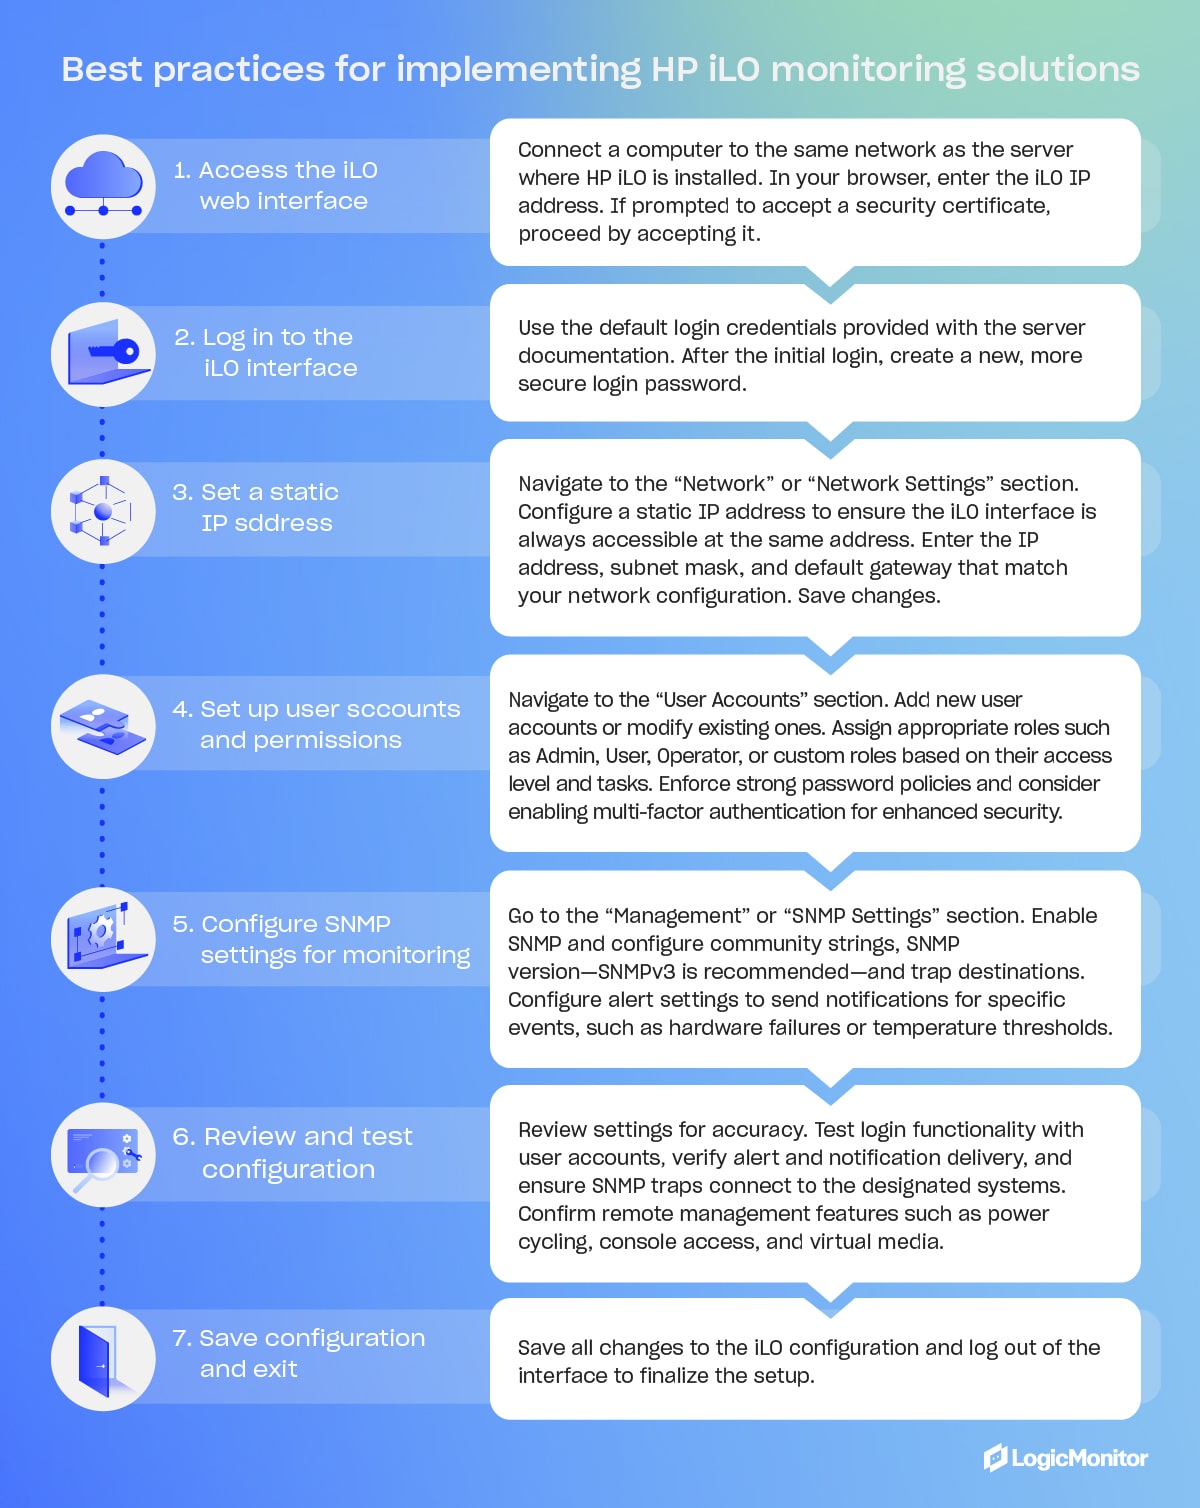
Best practices for implementing HP monitoring solutions
To fully harness the potential of HP iLO for server management, implement practices that align with your technology’s capabilities and the needs of your IT environment. These best practices can help maximize the benefits of HP iLO.
- Setting up and configuring HP iLO: Use SNMP settings to ensure accurate data collection and alerting.
- Enter the iLO interface’s IP address in your web browser and log in with your iLO credentials.
- In SNMP settings, enable SNMP and configure SNMP versions.
- Set up SNMP traps, define alerts, set data parameters, and save your configurations.
- Optimizing monitoring settings for different IT environments: Tailor HP iLO settings based on specific infrastructure needs, such as customizing alert thresholds and monitoring intervals.
- Regular firmware updates and maintenance: Keep HP iLO firmware up to date to benefit from the latest features and security enhancements.
- Security best practices for HP iLO: Implement strong passwords, enable multi-factor authentication, and restrict access to ensure secure remote management.
Common challenges and how HP monitoring addresses them
HP iLO addresses many common challenges in server management, from minimizing downtime to enhancing security. It also provides high-performance solutions for maintaining server performance and reliability. These capabilities enable teams to proactively manage their IT infrastructure, avoiding unexpected failures and security breaches.
1. Managing large-scale server environments
Overseeing numerous servers in large-scale environments across multiple locations increases the complexity of managing and monitoring servers and can limit visibility and control. HP iLO simplifies management and enhances visibility by providing a dashboard that empowers administrators to take the reins and comprehensively view server statuses. This centralized approach streamlines administrative tasks such as configuration, updates, and troubleshooting, simplifying server performance maintenance, saving time, and reducing the difficulty of managing dispersed server environments.
2. Reducing downtime with proactive monitoring
Minimizing interruptions and eliminating downtime are among the foremost challenges that IT administrators face. Downtime can lead to significant disruptions in operations, corrupted data, and increasing costs due to added staff support and possible overtime pay to get servers up and running again. HP iLO’s real-time health monitoring and alerting features provide immediate notifications regarding potential hardware failures. Alerts can enable swift intervention, allowing teams to resolve issues before they escalate. Automation facilitates responses to certain triggers, such as adjusting cooling settings, further enhancing system reliability.
3. Enhancing security in remote management
Remote server management produces unique security challenges, including the risk of unauthorized access. Intruders can cause all kinds of issues, such as stealing sensitive information or hijacking system resources. HP iLO enhances security through features like multi-factor authentication, secure boot, and encrypted firmware updates. These measures safeguard against unwanted visitors gaining server access and control and provide confidence that server environments are safe and secure.
4. Cost management through efficient resource allocation
Overutilization and underutilization of server resources are common challenges in system monitoring, especially in dynamic environments where needs shift regularly. HP iLO’s tools have effective resource and hardware monitoring built-in, helping to identify underutilized servers, optimize server deployment, and consolidate workloads where possible. Other features, like power management optimization, enable teams to monitor and control power usage across servers. LogicMonitor’s blog on HP MSA StorageWorks Monitoring provides insights into best practices for HP server monitoring and managing HP storage solutions effectively.
Future trends
As server management evolves, HP monitoring tools like iLO keep up with trends and promise the latest management software integrations.
- Integration with AI and machine learning for predictive monitoring: In 2023, HP Enterprise rolled out Green Lake for LLM, taking its place in the AI marketplace. The future will likely bring powerful and scalable predictive analytics to the table, helping foresee and prevent potential issues.
- The role of HP monitoring in edge computing: HP continues to invest heavily in edge computing capabilities to manage and monitor distributed networks. As edge computing grows, HP will continue to expand its use throughout all HP Enterprise endeavors, including iLO capabilities.
- Evolution of HP monitoring tools in cloud and hybrid environments: HP continues to enhance server management across hybrid environments by further integrating with cloud-based tools. Each improvement offers a more seamless migration of legacy systems to cloud-based and hybrid environments.
Conclusion
HP iLO is a powerful solution for server management, providing comprehensive features for remote management, real-time health monitoring, and enhanced security. Its integration with tools like LogicMonitor empowers organizations to maintain a centralized view of their IT infrastructure, optimizing resource allocation and performance. Best practices like regular firmware updates and customized SNMP settings let businesses maximize uptime and ensure secure and efficient server environments. As IT landscapes evolve, HP iLO remains a vital tool for proactive and scalable server management, ensuring IT infrastructure operates at its peak.
Virtual memory in Linux allows the operating system to use part of the hard disk as extra RAM, effectively creating the illusion of having more memory available, but before diving into monitoring techniques, it’s crucial to understand the basics of virtual memory. This process involves two key mechanisms: swapping and paging.
- Swapping: Entire processes are moved from RAM to disk when physical RAM memory is full.
- Paging: Only specific pages of memory are moved to disk, allowing more granular control over memory usage. More information about these mechanisms is available in The Linux Documentation Project’s guide on swap space. For a beginner-friendly explanation of swap space, see PhoenixNAP’s article on what swap space is and how it works.
LogicMonitor’s article What is Virtual Memory Anyway provides a deeper look into these concepts.
Essential commands for monitoring Linux memory usage
Monitoring a system’s available memory is critical to ensuring it operates efficiently. Here’s how to get started:
1. Physical memory: free and top commands
Using the free command provides a quick snapshot of memory usage, including total, used, and memory allocation. The top command offers real-time memory usage stats, making it invaluable for ongoing monitoring.
[demo1.dc7:~]$ free -g
             total       used       free     shared    buffers     cached
Mem:            47         45          1          0          0         21
SaaS-based server view
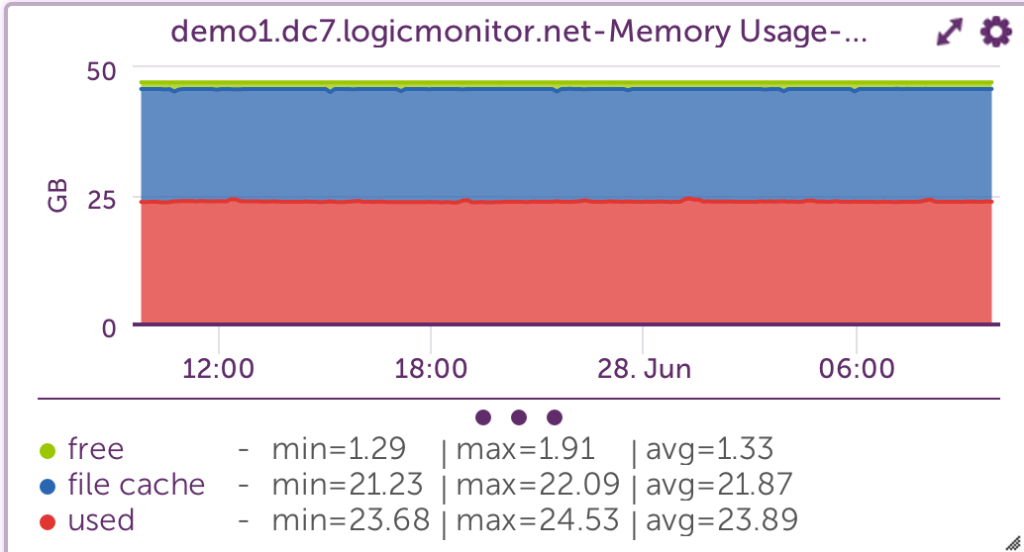
Linux uses all physical memory that is not needed by running programs as cache files. When programs need physical memory, the Linux kernel will reallocate a file cache memory to programs. So, memory addresses used by the file cache is free, or at least allocatable to programs, and serves its purpose until needed by another program.
It’s ok if all Linux memory is used, little is free, or is in use as a file cache. It’s better to have some file cache, except in these two instances:
- When running large Java programs where maximized heaps are necessary
- Needing databases, rather than the OS, to manage disk caching
As long as there is free virtual memory, and not active swapping, most systems will run efficiently with physical memory. More information about Linux memory is available in LogicMonitor’s blog article The Right Way to Monitor Linux Memory, Again.
2. Virtual memory usage: free -t command
Using free -t provides detailed information about swap memory usage, which is critical for understanding how much virtual memory is in use.
Example
free -t
[demo1.dc7:~]$ free -t
total used free shared buffers cached
Mem: 49376156 48027256 1348900 0 279292 22996652
-/+ buffers/cache: 24751312 24624844
Swap: 4194296 0 4194296
Total: 53570452 48027256 5543196
Monitoring view
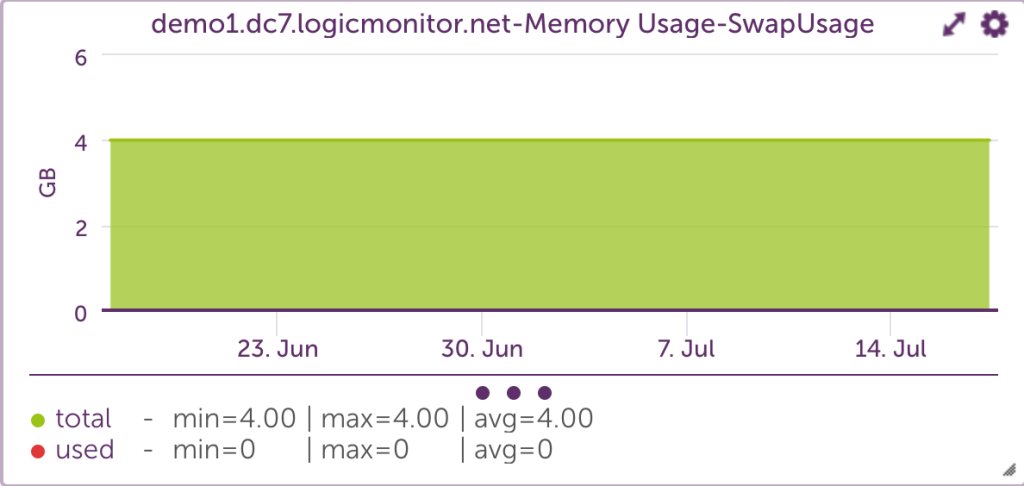
According to the outputs above, the system has used zero swap space. So, even though 90% of the total swap and physical virtual memory space is in use, the system never ran low enough on physical memory.
High swap usage can be dangerous, as it means the system is close to exhausting all memory. When programs need more main memory and are unable to obtain it, the Out Of Memory (OOM) Killer will begin killing processes based on the amount of memory initially requested, among other criteria. The server process, which sets the entire function of a server, will likely be one of the first to be killed.
While high swap usage is not recommended, low to moderate swap usage of inactive memory is no cause for concern. The system will shift inactive pages from physical memory to disk to free memory for active pages.
Knowing if swaps are being used is key to keeping usage low.
Monitoring virtual memory paging rate
One of the most critical indicators of memory issues is the rate at which memory pages are moved from physical memory to disk. This can be monitored using the vmstat command, specifically the si (pages swapped in) and so (pages swapped out) columns.
Example
vmstat
dev1.lax6:~]$ vmstat 1
procs -----------memory---------- ---swap-- -----io---- --system-- -----cpu-----
r  b   swpd   free   buff  cache   si   so    bi    bo   in   cs us sy id wa st
8 17 2422376 122428   2520  24436  952  676  1796   904 10360 4421 41  0 33 26  0
9 17 2423820 123372   2524  24316  732 1716   752  1792 12259 4592 43  0 25 32  0
8 17 2425844 120408   2524  25044  416 2204  1616  2264 14675 4514 43  0 36 21  0
7 19 2427004 120532   2568  25640  608 1280   764  1308 12592 4383 44  0 36 20  0
8 24 2428816 121712   2572  25688  328 1880   500  1888 13289 4339 43  0 32 25  0
Server monitoring view:
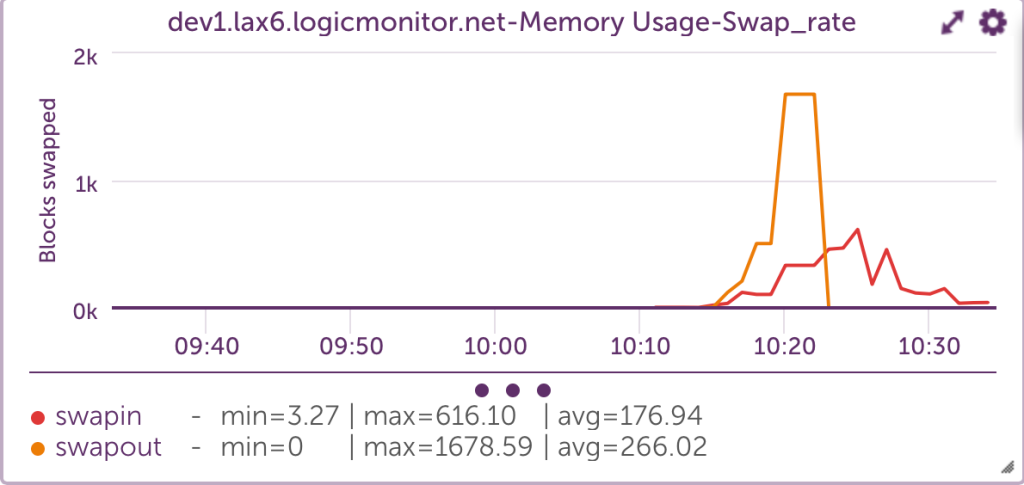
Swapping out a large number of blocks is the main indicator that a system is running low on memory. Swapping blocks at a high rate causes bottlenecks to performance because systems must look for needed codes on disk, rather than on physical memory, to run efficiently. This “hunt-and-switch” process slows performance.
In reviewing this graph, the sustained spikes in the page-in and page-out rates could be an indication of memory contention. Occasional spikes may be normal under heavy workloads, but frequent or prolonged activity often indicates the need to optimize memory usage, increase physical memory, or investigate memory leaks.
Additionally, the relationship between page-in and page-out rates can provide insight into system performance. For instance, a high page-in rate with a relatively low page-out rate may suggest that the system is successfully recovering from a temporary spike in memory usage. However, if both metrics are high over a long period, the system is likely thrashing — constantly swapping memory in and out, leading to performance issues.
Best practices for Linux memory management
To keep your system running efficiently, it’s essential to follow these best practices:
- Minimize swapping: Ddjust the swappiness parameter to reduce swapping frequency, especially on systems with ample RAM.
- Optimize swap space: Ensure swap space is appropriately sized for workloads.
- Monitor file cache usage: Understand that Linux uses available RAM for file caching, which can improve performance but may need adjustments depending on applications.
For more insights on how Linux manages memory, including tips on free memory and file cache, read LogicMonitor’s article More Linux Memory: Free Memory That Is Not Free Nor Cache.
Conclusion
Monitoring and managing virtual memory effectively is crucial for maintaining optimal performance in Linux systems. By using the right tools and following best practices, IT managers can be confident that servers will handle even the most demanding workloads without missing a beat.
A full range of Linux monitoring resources is available on the LogicMonitor blog. In particular, LogicMonitor offers reliable Linux monitoring capabilities via SSH, which can collect critical metrics such as CPU, memory/shared memory, filesystem utilization, user space, uptime, and network throughput. This method is especially useful for systems where SNMP is not configured. LogicMonitor’s suite of DataSources allows IT managers to monitor Linux environments comprehensively without the need for special permissions or SNMP setup.
For more details on configuring SSH-based Linux monitoring, and how to import LogicModules for full coverage, explore LogicMonitor’s Linux (SSH) Monitoring package.
OpenTelemetry (OTEL) provides vendor-neutral ways of application instrumentation so that customers can switch between Telemetry backends without re-instrumentation. It enhances observability by adding valuable data alongside other monitoring systems. OpenTelemetry consists of the OpenTelemetry SDK, the OpenTelemetry API, and the OpenTelemetry Collector. This approach ensures flexibility and standardization for monitoring systems.
This article will cover OTel and its architecture (receivers, processors, exporters, extensions, and service config). You’ll also learn key practices to help you deploy and maintain your OTel Collector so you can meet your organization’s needs.
Understanding the OpenTelemetry Collector
As a core component of OpenTelemetry, OTel collectors are deployed as pipeline components between instrumented applications and telemetry backends. With an OTel Collector, telemetry signals are ingested in multiple formats, translated to OTel-native data formats, and exported to backend-native formats. They are part of the three pillars of observability (metrics, logs, and traces), with traces for API being the most mature and metrics and logs in different stages of development.
Key components of the OTel Collector architecture
The OpenTelemetry collector consists of three main components: Receivers, processors, and exporters. These collector components are used to construct telemetry pipelines.

Receivers: Collecting telemetry data
Receivers are responsible for transferring data to the collector. They can be push-based or pull-based. Receivers accept data in specified formats, translate it into an internal format, and then pass it to batch processors and exporters defined in applicable pipelines. The format of any trace data or metrics supported is receiver-specific.
Processors: Transforming and enriching data
Processors transform metrics and modify the names of spans before sending data to exporters. They also batch data before sending it out, retry when exporting fails, and add metadata and tail-based sampling. The order in which processors are configured dictates the sequence of data processing.
Exporters: Sending data to backends
Exporters are tasked with exporting processed telemetry data to various observability backends, both open-source and commercial. They ensure that observability data reaches its intended destination in a compatible format, supporting seamless integration with different observability platforms.
Extensions: Enhancing collector functionality
Extensions add optional capabilities to the OTel Collector without directly accessing telemetry data. They are used primarily for managing and monitoring OTel collectors and offer optional enhancements for the collector’s core functionality.
Service configuration: Enabling components
The service section of the OTel Collector enables configured components within defined receivers, processors, exporters, and extensions sections. The section contains a list of extensions and pipelines of traces, metrics, and logs consisting of sets of receivers, processors, and exporters. Further information is available in Configurations for OpenTelemetry Collector Processors and LM OTEL Collector Logging.
Example configuration
receivers:
  otlp:
    protocols:
      grpc:
      http:

processors:
  batch:

exporters:
  otlp:
    endpoint: otelcol:4317

extensions:
  health_check:
  pprof:
  zpages:

service:
  extensions: [health_check,pprof,zpages]
  pipelines:
    traces:
      receivers: [otlp]
      processors: [batch]
      exporters: [otlp]
    metrics:
      receivers: [otlp]
      processors: [batch]
      exporters: [otlp]
    logs:
      receivers: [otlp]
      processors: [batch]
exporters: [otlp]Best practices for implementing the OTel Collector
- Ensure proper configuration: Each component—receivers, processors, and exporters—must be correctly configured and included in the pipeline for the collector to function effectively. Use validators to help ensure proper configuration.
- Utilize extensions wisely: Extensions are optional but can significantly enhance the collector’s capabilities, providing valuable monitoring and management functions.
- Leverage multiple pipelines: Define multiple pipelines with unique configurations to handle different types of telemetry data. While processors are represented per pipeline, receivers and exporters share collector instances across pipelines.
- Optimize data processing: It is crucial to optimize the order of processors, batch processing, sampling strategies, caching, and a configuration that optimizes data transformation and enrichment processes.
- Scalability and flexibility: Configuration of the OTel Collector to handle increased data loads as the system scales will help maintain efficiency and performance.
LogicMonitor’s OpenTelemetry Collector
LogicMonitor offers a customized version of the OTel Collector, which is pre-configured to forward traces from instrumented applications to the LogicMonitor platform. With LogicMonitor’s central management offering, users and providers can streamline observability strategies with little troubleshooting.
For more information on integrating with LogicMonitor, visit OpenTelemetry Collector for LogicMonitor Overview.
FAQs
What is the primary advantage of using the OTel Collector?
The primary advantage is its vendor-neutral approach, allowing organizations to switch between telemetry backends without re-instrumenting their applications.
Can I use multiple receivers in a single pipeline?
Yes, you can configure multiple receivers within a single pipeline to ingest data from various sources, optimizing your data collection strategy.
How do I ensure the OTel Collector scales with my system?
Implement best practices for configuration files and continuously monitor performance to adjust resource attributes as needed based on the signal types using the most resources, ensuring the collector deployment scales efficiently with your system.
What are the security considerations for deploying the OTel Collector?
Ensure data is encrypted in transit and at rest, and apply access controls to maintain the security and integrity of your telemetry data.
HAProxy (High Availability Proxy) is free, open-source software that acts as a load balancer and proxy for managing TCP and HTTP traffic, ensuring reliable performance and high availability. Known for its speed and efficiency, HAProxy provides high availability by distributing incoming web traffic across multiple servers, preventing overloads at startup, and improving overall reliability.
The tool’s popularity has grown among developers and network engineers due to the volume of features available, which help reduce downtime and manage web traffic. This article discusses those features, as well as uses, load-balancing techniques, and key features of 2.7.0, the latest version of HAProxy.
HAProxy includes reverse proxy and load-balancing capabilities for HTTP-based applications and TCP-based applications. Load balancing involves routing traffic to servers based on pre-configured rules, such as looking for high-performance servers with the least amount of traffic or telling proxies to send connections to multiple servers.
Why use HAProxy?
HAProxy also provides SSL termination, health checks, and detailed logging capabilities, along with its load-balancing features. This open-source software is ideal for websites and web applications that experience high volumes of traffic or traffic that spikes on occasion.
As such, many large organizations prefer HAProxy for its efficiency, scalability, and strong supportive community. It simplifies the management experience and reduces downtime by persistently load-balancing heavy traffic, which increases availability for applications and network layers, improving the user experience.
Top reasons to use HAProxy
- Scalability: Handles increased traffic without compromising performance
- Reliability: Trusted by organizations like JPMorgan Chase & Co. and Boeing, the largest aerospace company in the world (HG Insights)
How does HAProxy work?
HAProxy can be installed free using a system’s package manager or as a Docker container.
- Frontend and backend setup: Configure HAProxy by defining the front end (receiving traffic) and backend (managing servers). You can set rules to direct traffic to specific servers based on IP addresses, ports, or HTTP load-balancing algorithms.
- Traffic management: Intelligently routes traffic based on configurations, ensuring optimal server usage and reliability.
HAProxy One offers a range of tools and platforms that enhance the benefits of HAProxy’s free proxy and load-balancing software.
Load balancing techniques
Load balancing in a web application environment depends on the type of load balancing used.
- Web server load balancing (layer 4): The simplest load balancing solution for multiple web servers is layer 4, or transport layer, load balancing. This setup uses a load balancer, a predefined range of IP addresses, and a port to determine where to route traffic, allowing multiple servers to respond to user requests efficiently.
- Application server load balancing (layer 7): Layer 7 load balancing routes requests to different backend servers, depending on requests, and requires more complex rules to connect user requests to the correct backend servers. For example, you might house blog articles on one server while you host an e-shop page on another. So, a request for a blog article will be routed through a different server than a request for an e-shop product, even though the requests are generated from the same website.
- Reverse proxy: Reverse proxies sit between applications and backends to ensure user requests reach appropriate servers. They also provide security, reliability improvements, and traffic management.
Key features of HAProxy
Due to its extensive features, HAProxy is preferred over alternative proxies like NGINX and LoadMaster.
- HTTP/2 protocol support: Enhances web performance
- SSL/TLS termination: Improves security by managing encryption and decryption
- Detailed logs: Offers comprehensive logs for monitoring and observability
- RDP cookie support: Supports secure, reliable sessions
- CLI for management: Provides in-depth server management capabilities
Implementing HAProxy: A step-by-step guide
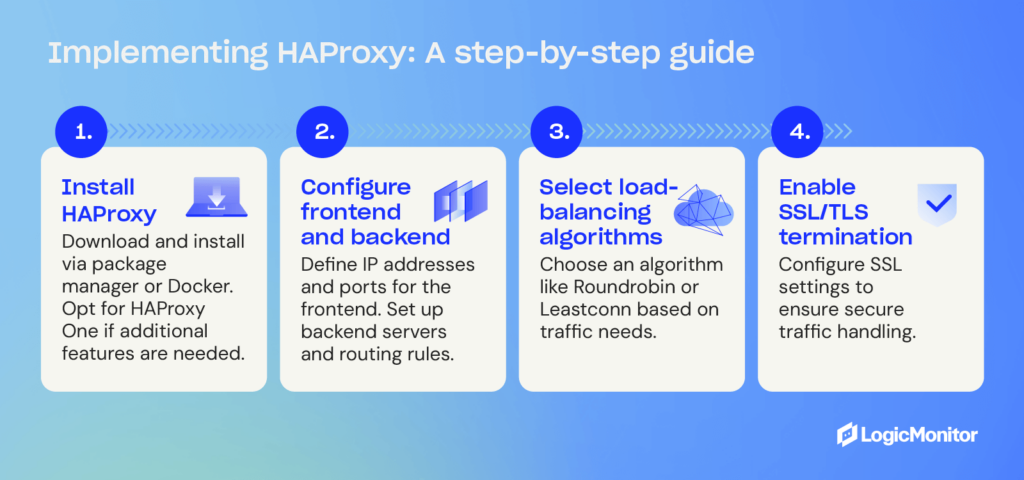
Step 1: Install HAProxy
- Download and install via package manager or Docker.
- Opt for the HAProxy One version if additional features are needed.
Step 2: Configure the frontend and backend
- Define the IP addresses and ports for the frontend.
- Set up the backend servers and the rules for routing traffic.
Step 3: Select load-balancing algorithms
- Based on traffic needs, choose an algorithm like Roundrobin or Leastconn. Roundrobin is the default load-balancing algorithm that selects servers in a specific order, and Leastconn is an alternative algorithm that searches for servers with the fewest connections.
Step 4: Enable SSL/TLS termination
- Configure SSL settings to ensure secure traffic handling.
HAProxy vs. other solutions
When evaluating load balancers and proxy solutions, it is important to choose one that best fits the specific infrastructure needs. HAProxy, NGINX, and LoadMaster are among the top contenders, each offering distinct features that cater to different operational demands.
HAProxy vs. NGINX
Both HAProxy and NGINX are popular choices for managing web traffic, but they excel in different areas.
- Performance: HAProxy is optimized for low-latency environments, making it ideal for applications that require real-time responsiveness and high availability. In contrast, NGINX is better suited for caching and delivering static content, offering a simpler solution for web applications that prioritize speed over complexity.
- Logging: One of HAProxy’s major advantages is its detailed logging capabilities. For environments that require deep traffic analysis and precise monitoring, HAProxy provides comprehensive logs that track each request and connection. NGINX, while effective, offers more basic logging, which may not be sufficient for enterprises needing extensive traffic visibility.
- Configuration complexity: HAProxy offers more advanced configuration options, allowing users to customize traffic routing based on a wide range of conditions. This flexibility comes with increased complexity, making it a better fit for organizations with dedicated DevOps teams or advanced networking needs. On the other hand, NGINX provides a simpler, more beginner-friendly configuration process, making it an appealing choice for smaller projects or businesses with less demanding requirements.
HAProxy vs. LoadMaster
The distinction between HAProxy and LoadMaster is open-source flexibility and proprietary convenience.
- Flexibility: As an open-source solution, HAProxy allows full customization, enabling businesses to tailor the tool to their specific needs without paying for additional features or upgrades. This makes HAProxy particularly attractive to organizations that want to maintain control over their infrastructure. In contrast, LoadMaster, a proprietary tool, provides pre-configured solutions that are easier to deploy but may lack the flexibility needed for more complex environments.
- Cost-Effectiveness: HAProxy’s open-source nature means it can be implemented at no cost, regardless of the scale of operations. For businesses that need to manage large volumes of traffic without the burden of licensing fees, HAProxy presents a cost-effective solution. LoadMaster, however, is a paid option that includes professional support and additional features. While this may benefit enterprises that prioritize customer support and streamlined implementation, it can become costly, especially as traffic demands grow.
Real-world use cases
The power of HAProxy is demonstrated by organizations like GitHub, which rely on it to manage millions of concurrent connections efficiently. In these large-scale environments, HAProxy’s ability to handle complex configurations and provide real-time performance metrics far surpasses the capabilities of NGINX and LoadMaster without significant customization.
Which to choose?
Ultimately, HAProxy stands out as the optimal choice for organizations looking for maximum flexibility, scalability, and a robust feature set to manage high volumes of traffic. For environments with static content or simpler traffic needs, NGINX may be a more suitable option. LoadMaster offers a more simplified, pre-configured solution but may be costly, particularly for enterprises looking to scale.
Community support and resources
HAProxy’s community support and resources are vast, offering many user options, from official documentation to active community forums. With a HAProxy One subscription, users can benefit from expanded paid support options.
HAProxy supports users of current and latest versions and assists in critical fixes on any version. Documentation, including configuration tutorials and detailed manuals, is available on the HAProxy website, and the HAProxy blog offers helpful articles that you can filter according to specific inquiries. Current HAProxy One subscribers can contact support through the HAProxy Portal, providing convenient access to assistance.
Conclusion
HAProxy is a powerful, scalable solution for managing heavy or unpredictable web traffic. As a free, open-source tool, it provides smaller organizations the same reliability and performance enjoyed by large enterprises like JPMorgan Chase & Co. and Boeing. Implementing HAProxy is a strategic move for any business looking to enhance its web infrastructure’s reliability and performance.
Simple Network Management Protocol (SNMP) traps are messages sent by SNMP devices that notify network monitoring systems about device events or significant status changes.
At LogicMonitor, our view on SNMP has evolved over the years. While we have often favored other logging methods that offered more insights and were considered easier to analyze in the past, we recognize that SNMP traps remain an essential tool in network management.
For network engineers, SNMP traps deliver real-time alerts faster than other methods, ensuring you’re the first to know when critical network events occur. They also provide specific, actionable data that can only be captured through traps, helping you quickly isolate issues and reduce downtime.
And it’s our mission to ensure our customers have all the necessary—and best—tools to solve their problems, no matter the technology. Mature techology =/= obsolete or ineffective.
So, let’s look at SNMP traps and how your organization can leverage them to monitor your IT infrastructure.
SNMP traps vs. SNMP polling
SNMP polling is similar to SNMP traps in that it allows you to collect information about a device’s status and store it in a monitoring server. The difference between the two is the way information is sent.
SNMP traps work on an event-based model. When a pre-defined event occurs, it immediately sends a trap message to the designated receivers. On the other hand, SNMP polling mechanisms work with the monitoring server actively requesting information from SNMP agents.
Using SNMP traps offers you many advantages over polling:
- Get real-time notifications to learn the moment an event occurs
- Reduced network overhead by only sending messages when events occur
- Quickly catch issues that may get missed by intermittent problems
Depending on your organization’s needs, there are also some drawbacks to using SNMP traps, some of which include:
- Notifications may be lost during transit since they are sent using User Datagram Protocol (UDP—a fast, connectionless communication method that sends data without guaranteeing delivery, often used in real-time applications)
- Setting up individual devices to send traps may be more complex if setting up more than one trap instead of just starting an SNMP agent to accept polling, but this isn’t always the case
- It may miss the broader context regular polling provides (if not using a combination of trapping and polling) because traps only send point-in-time information
Despite those challenges, you can still use SNMP traps to get information about your infrastructure. We offer LM Logs as part of the Envision platform. LM Logs provides many features that help IT teams manage SNMP traps, such as:
- Sending traps to the collector to gather and Map Management Information Base (MIB) data
- Uploading proprietary and/or custom MIB definitions to expand translation capabilities
- Automatically translating object identifier (OID) and Varbind (Variable Bindings) information into human-readable labels to focus on finding issues
- Using advanced anomaly detection features to remove the noise and surface only the most important traps
- Utilize stateful alerting to automatically close alerts that receive an indication that the error status doesn’t exist anymore to reduce the number of alerts
Detailed mechanism of SNMP traps
Several components make up SNMP traps:
- SNMP agent: Software running on monitored devices that generate and send SNMP trap messages
- SNMP manager: Systems that receive and parse SNMP trap information
- Management Information Base (MIB): Database defining the structure and meaning of trap information
- Network Management System (NMS): The overall system responsible for monitoring and managing network devices, including routers, servers, and switches.
The other critical part of SNMP traps is how the data is stored. This happens through OIDs. By default, SNMP agents come with default OIDs from the built-in traps. However, you may also create custom OIDs or download pre-built ones from device vendors to upload to your monitoring solution.
You must also consider how SNMP traps are submitted. They use single UDP packets for transmissions, meaning delivery isn’t guaranteed. You can minimize some of this risk by putting the device and collector as close together as possible on the network.
When using SNMP traps, you’ll need to weigh the benefits of lower overhead against the risk of missed deliveries. Although polling may provide data at a delayed rate, combining it with traps will ensure you don’t miss any critical alerts.
Types of SNMP traps
Several SNMP traps are available, from standard to enterprise-specific and custom traps.
Let’s look at some common traps available:
- coldStart: Indicates system reinitiation itself with potential configuration changes
- warmStart: Indicates system reinitiation without configuration changes
- linkDown: Indicates a communication link failure
- linkUp: Indicates a communication link was restored
- authenticationFailure: Indicates an authentication request failure
- egpNeighborLoss: Indicates an EGP neighbor loss
You can create custom traps if your organization needs more from SNMP traps. To do this, you would download the proprietary MIB files from your vendors (or create a custom one if you have more specific needs). You can then upload your custom MIB file to your monitoring solution so it can translate the data.
Through this, you can define custom traps to look for events such as CPU utilization and memory usage. You can also define custom alerting behavior based on specific conditions using LogSources and Pipelines to get notified about the alerts that matter most—as well as define custom “stateful” behaviors to remove alerts that aren’t relevant anymore. Example: “alert on Link Down, but close the alert if/when you get a Link Up for the same interface.”
The good thing about collecting this information using traps (as opposed to polling) is that it’s less resource-intensive on networks, as businesses only get the alerts they’re looking for instead of constantly polling devices—something especially important in large environments.
It also offers alerts when they matter the most—when a device problem occurs. This helps teams find issues immediately instead of only learning about problems when a device is polled.
Configuring SNMP traps
Configuring SNMP traps involves configuring individual devices to trigger SNMP traps and send them to the Collector. Follow the general steps below to start with the configuration:
- Access the device configuration to enable the SNMP agent
- Configure the trap destination by inputting the IP address or DNS of the trap receivers
- Study vendor documentation for proprietary OIDs to learn the available traps and upload them to your Collector
- Define the trap types by selecting the events that trigger traps and send data to the receivers
- Set community strings for trap configuration (authentication strings, port numbers, and engine ID)
- Test the configuration to ensure traps work properly
This can get your organization set up with a basic configuration. However, a few advanced tips are available that will help optimize your SNMP traps:
- Send all traps available to a monitoring server and filter everything not required
- Collect MIB information from proprietary vendors to get comprehensive insights into enterprise environments
- Use a DNS name instead of an IP address to avoid misconfiguration when IP addresses change
- Avoid sending traps across the NAT or the internet to avoid packet loss with UDP packets
- Use the default LogSource when possible and add customization when you need custom behavior
Monitoring and managing SNMP traps
SNMP traps can gather a lot of information, but as your network environment grows, you may start gathering a lot of information and need a way to filter down to the most important data.
This requires strong SNMP trap monitoring and management.
It comes down to two things: interpreting trap messages to respond effectively and automating alerting.
- Interpreting trap messages: Properly define source devices, event types, and associated data. Filter messages to surface trap information that indicates problems that IT teams should respond to—avoiding time wasted looking through irrelevant data.
- Automation: Automatically filter information based on the above criteria and use reporting tools to send it to the appropriate party for resolution—ensuring engineers only see the information they should act on.
You can use tools such as the ones we offer at LogicMonitor with LM Logs to improve the management of SNMP traps as part of a hybrid observability solution (for legacy on-prem and cloud infrastructure and services). LogicMonitor Envision provides several features to make management easier:
- Automatic ingestion, parsing, and mapping SNMP traps as logs to read OIDs in a human-readable format and streamline their management
- Automatic translation of OIDs and their data to remove the need for you to manually decode them, helping you quickly learn what potential problems the data shows
- Store historical data to get the historical context of SNMP logs—along with other data—to perform historical analysis and find trends
- Automatic anomaly detection using AI-powered features to help automatically surface the SNMP trap data that matters and helps you save time
- Integrate with SNMP polling to get faster notifications and maximum visibility
- Link SNMP trap information with other data within LM Envision to help correlate potential issues with other data
Best practices for SNMP trap management
With so much data available with SMP traps, your organization can employ best practices to help streamline operations. Use the following tips to practice efficient SNMP management:
- Centralize management: Centralize the collection of SNMP traps using monitoring software (like LM Logs) to streamline management
- Filter traps: Use filters using your management software to eliminate traps you aren’t interested in
- Complete visibility: Collect as much information as possible to get complete visibility on a network
- Integrate with other tools: Use SNMP trap data in other tools to get a more comprehensive view of your IT infrastructure instead of only using SNMP trap information
- Automate where possible: Avoid manual work wherever possible by automating alerts and OID translation
Challenges, best practices, and troubleshooting in SNMP trap management
Although several challenges are associated with SNMP traps, there are ways you can mitigate those challenges to ensure you get the information you need.
Let’s look at a few common challenges and the best practices to overcome them.
Missed traps
Since SNMP uses UDP for transmission, traps can be lost in transmission. Consider using SNMP inform messages or app-level acknowledgments to ensure the trap receiver sees all traps. These will help agents determine if a trap message was successfully sent. Also, try to avoid sending traps across network address translations (NATs) and network boundaries to reduce the chance of packet loss.
Misconfigured devices
Some traps have thresholds that trigger an alert. If a device isn’t configured properly, it won’t send an alert to you. When setting up traps, audit devices to ensure proper configuration and test devices where possible to see if traps trigger.
False positives
Traps provide a lot of information—and not all of it is relevant to finding and fixing IT problems. You may miss the important alerts if you look at all this data. Regularly review any false positives triggered and put filters in place to remove them from regular alerts—reducing alert fatigue and allowing you and your team to focus on real problems.
Security concerns
Traps can potentially expose sensitive information if not properly secured. Ensure your organization uses the latest SNMP (SNMPv3) version and implements encryption, complex community strings, Access Control Lists (ACLs), and trusted IP addresses. Implementing a regular audit of SNMP traffic can help identify anomalies.
Troubleshooting SNMP problems
Troubleshooting SNMP issues comes down to ensuring traps are generated when necessary and make their way to the trap receiver. Here’s some steps you can leverage to identify potential SNMP problems:
- Verify trap generation to ensure the target devices are correctly configured
- Check network connectivity to look for network issues that may impact transmission
- Validate trap receiver configuration to ensure traps go to the right place
- Analyze trap content to ensure it contains the correct information
- Review MIB files to ensure they are updated to the latest versions from the vendors
Advanced topics in SNMP traps
Understanding where SNMP came from and other advanced topics will help you learn what it’s about and how it helps.
The evolution of SNMP
SNMP started with SNMPv1 in the 1980s. It started simple with limited features, but it lacked security features, making it a problem for businesses. Over time, the SNMPv2 protocol was released, and it came with manager-manager communication and enhanced security. It greatly expanded the amount of data available to be received on a single request, giving organizations more flexibility in how they use the protocol.
However, one of the biggest challenges with SNMPv2 was that the security amounted to nothing more than a password, which is where SNMPv3 comes in. SNMPv3 is the latest and most secure version. It includes authentication and encryption, ensuring that you and your team are the only people able to view trap data.
SNMP trap storms
SNMP trap storms occur when the number of traps received from a specific device reaches a specific threshold. Trap storms can indicate network outages, device misconfiguration, or cascading failures.
Trap storms can lead to network problems because of the overwhelming amount of bandwidth used on a network. They are also a sign that a more serious problem may need to be addressed immediately.
Your organization can address trap storms in several ways:
- Implement rate limiting to stop irrelevant traps
- Filter data to avoid unwanted traps
- Aggregate data to group similar traps in single alerts
Using SNMP traps with other protocols
SNMP traps provide a lot of data, but they’re only a piece of the puzzle when looking at a network in its entirety. Integrating them with other protocols like syslog and Netflow can offer more comprehensive visibility into IT infrastructure.
For example, Netflow tells businesses a lot about how data flows on a network—something SNMP doesn’t. Your organization can use the two protocols together to learn about what happens on devices and how devices interact with each other.
The same is true with syslogs. SNMP may tell you when something goes wrong on a device—but it may not give any details about more specific application errors. Looking at syslogs can give more details that SNMP doesn’t to help troubleshoot and fix problems.
SNMP informs vs. SNMP traps
SNMP traps are a mechanism a device uses to send information about device events. It’s a data collection mechanism that helps you and your team learn if anything important happens to their infrastructure.
SNMP informs require a response from other SNMP agents they communicate with. They expect a response from the other agent upon receipt of a message, which helps agents determine if a trap was successfully sent. These are good to use in cases when reliability is critical, and the information sent is vital to operations.
Wrapping up
As we’ve outlined, SNMP traps can be a useful tool, especially when combined with Logs. LogicMonitor has evolved our perspective, thanks to customers’ input to provide the best tool for the job. SNMP traps and LM logs offer the best of both worlds, giving IT teams actionable insights and helping them troubleshoot critical infrastructure problems. Using traps and polls together provides a comprehensive solution for network monitoring and helps teams ensure their infrastructure stays online.
In healthcare, every second matters. Healthcare IT infrastructure is the backbone of modern patient care delivery, ensuring that patient data is accessible, treatments are administered on time, and critical, life-saving systems remain operational. When these systems fail, the consequences are immediate and far-reaching—delayed treatments, disrupted workflows, and compromised patient safety. As an IT leader, it’s your responsibility that essential systems are running smoothly through optimal IT solutions for healthcare, minimizing risks to operations and safeguarding patient outcomes.
The complex challenges of healthcare IT
Your role puts you at the forefront of integrating cutting-edge technology, from IoT sensors and high-resolution imaging to AI-driven diagnostics. These new technologies transform how healthcare is delivered and improve patient care. However, these technologies come with increased complexity. Your healthcare facility likely relies on a mix of cloud-based and on-premises systems, from EHR platforms to lab and imaging software, all of which must seamlessly interact to deliver care. Yet, when systems fail to integrate properly, it results in delayed workflows, disconnected data, and, ultimately, a compromised ability to deliver quality care. This increasing complexity isn’t just a technical issue; it’s a mission-critical challenge that affects every layer of your organization, whether a hospital, health system, clinic, laboratory, or any other type of health or pharma-related operation.
Downtime disrupts everything—from clinical care to your back-office operations. Staff move from automated systems to manual processes, doubling their workload and risking errors. This leads to operational inefficiencies that ripple throughout the hospital, from patient records to pharmacy systems.
The far-reaching impacts of IT downtime in healthcare
As you know, the financial impact of downtime is enormous. Downtime significantly increases operational expenses, costing the healthcare and life sciences industry an estimated $203 million each year. In 2023, reports estimated that cyberattacks alone cost an average of $1.3 million per healthcare organization, severely disrupting system availability and normal operations. The stakes are high, and these challenges hit your bottom line as hard as they hit your IT infrastructure. But it’s not just financial; downtime impacts patient safety, delaying critical treatments and putting lives at risk.
When your systems are down, every second counts. Take the example of the Microsoft Microsoft outage in July of 2024 caused by a CrowdStrike issue, which disproportionately affected the healthcare industry, resulting in $1.94 billion in losses (individual companies faced average losses of $64.6 million.)
Downtime impacts not only finances but also patient safety. Disruptions in critical systems like EHRs and patient management platforms delay time-sensitive treatments, leaving life-saving medications or procedures stuck in queues. This leads to complications, worsened outcomes, and increased mortality.
In fact, during the Crowdstrike outage, healthcare organizations lost access to systems like Epic, forcing them to reschedule appointments and surgeries, divert ambulances, and close outpatient clinics. Healthcare leaders noted that the outage impacted every aspect of patient care.
System outages also threaten data integrity. Without access to patient records, lab results, or imaging data, healthcare staff risk losing vital information. Files can become corrupted, and in some cases, data may be permanently lost. Ransomware attacks add an additional layer of risk by locking users out of critical systems, potentially withholding access to life-saving information.
Your responsibility also extends to maintaining regulatory compliance, whether under HIPAA or GDPR. System outages not only disrupt operations but can expose organizations to substantial fines and legal risks.
A prime example is a 2022 HIPAA violation, where North Memorial Health paid $1.55 million due to inadequate safeguards and lack of a business associate agreement (BAA), resulting in a breach that affected 290,000 patients. This illustrates how critical it is to maintain strict security protocols and ensure compliance with HIPAA’s stringent requirements for managing data integrity and system availability.
Beyond financial penalties, downtime during compliance-related incidents erodes trust with both patients and regulatory bodies. A 2024 Gartner survey indicated that regulatory shifts were the top concern for healthcare organizations, with failure to comply leading to significant reputation damage.
Why healthcare IT needs hybrid observability powered by AI
As healthcare organizations continue to adopt a blend of on-premises and cloud-based systems, maintaining operational continuity and ensuring patient safety depends on having a unified view of all critical systems. Hybrid observability powered by AI, like that provided by LogicMonitor Envision, ensures continuous monitoring across healthcare applications, safeguarding patient safety and maintaining operational efficiency.
By collecting and analyzing data from events, metrics, logs, and traces, this approach offers unparalleled insights into the health of critical healthcare applications. For healthcare IT teams, AI-driven observability helps proactively identify system issues, reduce the risk of downtime, and ensure the continuous availability of essential services such as EHRs, telehealth, and medical imaging. Additionally, it optimizes resource use across your infrastructure, ensuring that patient care remains uninterrupted and operational efficiency is maximized, all while enhancing compliance with regulatory standards.
Comprehensive monitoring across critical healthcare IT systems
A full observability platform like LM Envision is essential for preventing downtime and disruptions across key areas of healthcare IT, including:
- EHR and patient management systems: Platforms like Epic, Oracle Health, Meditech, and AlteraHealth form the foundation of patient data management, handling everything from appointments to billing. Monitoring these systems ensures their availability and security, reducing the risk of data loss or downtime that could disrupt critical healthcare operations.
- Telehealth services: Remote patient consultations are increasingly common in modern healthcare. Monitoring ensures communications technology remains stable, allowing doctors and patients to stay connected without interruptions to care.
- Medical imaging systems: Technologies like X-rays, CT scans, MRI, and ultrasound generate vital diagnostic data. Monitoring helps maintain uninterrupted access to these systems, ensuring timely diagnoses and treatment planning.
- Pharmacy and lab systems: Seamless communication between hospitals, pharmacies, and labs is crucial for timely prescriptions and test results. Monitoring tracks performance and detects issues in these systems, preventing delays that could impact patient treatment.
- Compliance and regulatory reporting: Compliance tools are essential for tracking audits, employee training, and risk assessments. Monitoring ensures system uptime, helping healthcare organizations meet HIPAA, GDPR, and other regulatory requirements.
- Network infrastructure: Effective data transfer across laboratories, specialists, and other healthcare services is critical. Monitoring ensures networks remain strong and secure, preventing bottlenecks that could disrupt care.
- Data warehouses and analytics platforms: Healthcare analytics platforms like IQVIA, Optum, and IBM Watson Health aggregate and analyze large sets of patient data. Monitoring ensures these platforms remain functional, supporting improved clinical outcomes and operational efficiency.
- IoT devices: Wearable devices like HUGS Infant Monitoring or heart monitors rely on constant data transmission to ensure patient safety. Monitoring these devices in real-time can detect potential outages that could jeopardize patient care.
By integrating these critical systems into an observability platform like LM Envision, you gain the power to keep everything running smoothly—from the smallest IoT devices to your entire EHR infrastructure.
Benefits of a comprehensive IT solution for healthcare
Healthcare organizations that use hybrid observability powered by AI platforms like LM Envision realize the following benefits:
- Safeguard patient safety by helping ensure that critical systems like EHRs and patient management systems are always available, improving wait times and preventing delays in patient care.
- Improve data integrity through monitoring to ensure patient records, lab results, and imaging data remain intact, accurate, and available when they’re needed.
- Simplify regulatory compliance by helping healthcare facilities adhere to HIPAA and other regulations by restricting access and monitoring changes to sensitive data.
- Ensure system integration by observing the separate components of various healthcare applications in a single pane of glass to ensure smooth data flow between systems.
- Reduce downtime and MTTR through early issue detection within critical systems so healthcare organizations can proactively prevent unplanned downtime and easily improve healthcare system uptime.
- Reduce costs through cloud cost management, dynamic resource discovery and management, and predictive analytics and AI-driven insights. With these tools, healthcare organizations can:
- Track and manage cloud resource usage, identify underutilized resources, and receive optimization suggestions to reduce unnecessary expenses.
- Automatically discover and monitor all resources across cloud-based, on-premises, or hybrid environments, efficiently allocating and releasing resources as needed.
- Anticipate capacity needs, forecast potential issues, and efficiently allocate resources, identifying patterns and preventing bottlenecks before they impact operations.
Real-world success with IT solutions for patient management in healthcare
From healthcare facilities to pharmaceutical manufacturers, medical device companies to insurance providers—LogicMonitor has partnered with all kinds of healthcare organizations to consolidate siloed tools, services, and applications into a single pane of glass.
RaySearch Laboratories and LogicMonitor: Advancing cancer treatment together
At RaySearch Laboratories, the fight against cancer is personal. With a mission to improve cancer treatment through innovative software, RaySearch supports thousands of clinics worldwide in their battle against this devastating disease. For them, every second counts in delivering cutting-edge oncology solutions to patients who desperately need them.
As RaySearch grew, so did the complexity of their IT environment. Burriss found himself spending 50-60% of his time sifting through logs to troubleshoot issues, time that could have been better spent on system upgrades and improving user experience. In a field where every moment matters, this inefficiency was unacceptable.
Enter the LogicMonitor Envision platform. By implementing this unified observability solution, RaySearch achieved:
- Comprehensive visibility: Burriss and his team can now monitor everything from servers to workstations to networking equipment in one dashboard.
- Rapid issue resolution: What once took 2-3 hours of troubleshooting now takes just 10 minutes. This dramatic reduction in resolution time means less downtime for critical systems and more time for innovation.
- Proactive maintenance: With the time saved on troubleshooting, Burriss and his team have been able to focus on learning new skills and being proactive with system maintenance, ensuring that RaySearch’s IT infrastructure is always at peak performance.
- Enhanced customization: LM Envision’s extensive out-of-box features and customization options allow RaySearch to tailor their monitoring to their specific needs, ensuring no gap in their IT oversight.
For RaySearch, where the personal stories of cancer survivors and those still fighting fuel their mission, every improvement in efficiency translates to potential lives saved.
By partnering with LogicMonitor, RaySearch has strengthened its IT foundation, allowing them to focus on what truly matters – developing pioneering software that advances cancer treatment worldwide. In this way, LogicMonitor isn’t just providing an IT solution; it’s playing a crucial role in the personal fight against cancer that drives every member of the RaySearch team.
LogicMonitor for healthcare
A healthy IT environment in healthcare facilities is central to providing critical services quickly and accurately. Outages can affect the quality of patient care, increase operating costs, and expose an organization to compliance and legal issues.
LogicMonitor offers IT solutions designed for the healthcare environment that provides a comprehensive view of your healthcare infrastructure environment. Built to improve system reliability through real-time monitoring, robust visualizations, and automation features, it enables you to monitor, deploy, adapt, and reduce risk across your healthcare IT systems so your healthcare organization can benefit from an evolving healthcare IT landscape.
NetFlow Traffic Analyzer is an advanced analytics tool that monitors network traffic flows in real-time. It provides network administrators with insights into bandwidth usage and performance, helps identify and clear network congestion issues, and enhances security by detecting suspicious activities. By leveraging flow data, it enables effective network management and optimization.
Data can seem meaningless when reasons for collecting and viewing it aren’t obvious. Network monitoring spots network and functionality problems, including traffic jams, and offers reasons for slow performance. Correcting these issues means better traffic flow, which is vital to keeping networks operating efficiently.
Importance of network traffic monitoring
Thinking that traffic levels and types of traffic don’t matter because slowdowns are not occuring is not accurate. Small bumps in traffic can cause networks to crash, or at the very least, cause critical slowdowns. A network traffic analyzer makes network bandwidth monitoring easy and determines whether it is sufficient to handle additional traffic when necessary.
A couple other beneficial ways of using NetFlow Analyzer are for measuring packet loss and determining throughput. The interface offers valuable data that grants better understanding of traffic congestion issues at specific levels.
More information about monitoring network traffic is available in the article How to Monitor Network Traffic with NetFlow.
Benefits of using NetFlow Analyzer
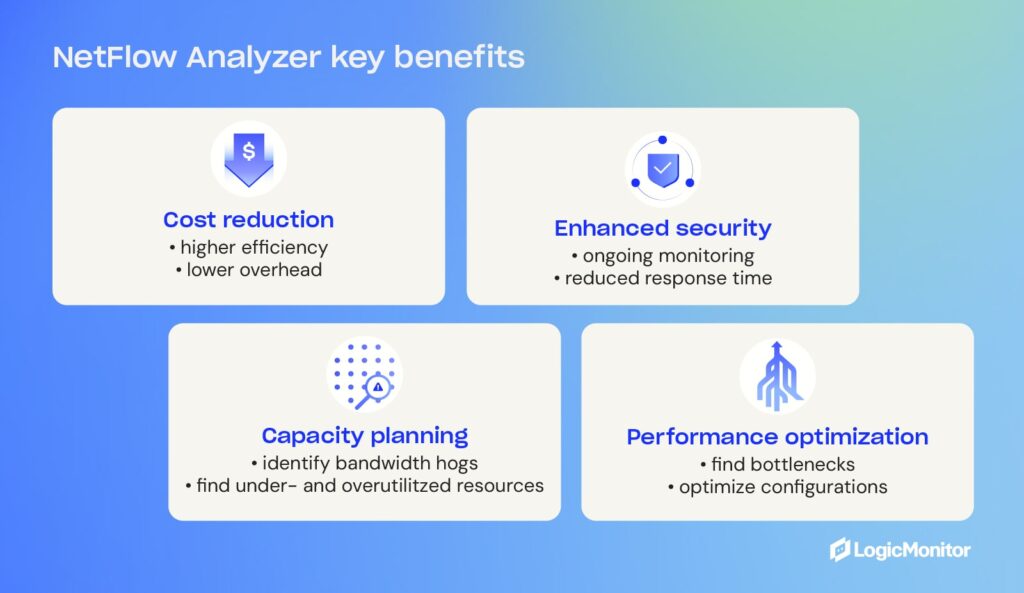
- Capacity planning: By analyzing NetFlow data, administrators have a cost-effective resource to identify underutilized or overutilized network resources, allowing identification of bandwidth hogs, network capacity efficiency, and optimal performance monitoring.
- Performance optimization: With the ability to monitor traffic patterns, NetFlow Analyzer helps identify bottlenecks and optimize network configurations to provide a seamless user experience and minimize downtime and latency.
- Enhanced security: Continuous network traffic analysis allows quick response to potential security breaches.
- Cost reduction: Improved network efficiency means employees get more done, resulting in higher levels of efficiency and lower overhead costs.
This step-by-step guide explains more about Viewing, Filtering, and Reporting on NetFlow Data.
Enhance network security with traffic analysis
Traffic analyzers provide valuable insights for incident response and forensic investigations and play a crucial role in enhancing network security. By monitoring traffic flows, administrators can detect and investigate suspicious activities, such as unauthorized access attempts, malware infections, or DDoS attacks.
NetFlow Analyzer takes preemptive measures by monitoring network traffic and catching potential problems before they start. Finding small issues and correcting them before they become larger issues is one way network traffic analyzers protect entire networks from unexpectedly crashing.
Network administrators already using NetFlow Analyzer might benefit from these troubleshooting tips.
How does NetFlow Analyzer work?
NetFlow Analyzer operates by continuously generating data from network devices that export information about individual network flows. These flows represent unidirectional streams with similar characteristics, such as source and destination IP addresses, ports, and protocol types.
By leveraging flow data analysis, NetFlow Analyzer enables network administrators to monitor and optimize network performance, detect and troubleshoot network issues, plan network capacity, and ensure the efficient utilization of network resources. NetFlow analysis in a series of steps that includes initial data collection and a comprehensive report that helps network management teams make informed decisions.
Step-by-step process
- Data generation: NetFlow-configured network devices export flow monitoring information.
- Data collection: Flow data is gathered from multiple network devices, such as NetFlow, sFlow, J-Flow, IPFIX, or NetStream.
- Data storage: Pending further analysis, collected flow traffic data is stored in a database or file storage system, like MySQL or PostgreSQL, or Elasticsearch.
- Data analysis: Flow data is processed and analyzed to extract valuable metrics and information, including patterns, trends, and anomalies in network traffic, that help identify sources of congestion or network performance issues.
- Reporting and visualization: Insights about network traffic behavior becomes available for presentation in pre-built or customizable reports, graphs, and visualizations.
Implementing NetFlow Analyzer
NetFlow Analyzer is implemented through integration with network devices. Data is collected and processed before being presented in intuitive dashboards. Available data can be reviewed in ready-made reports that can be customized for presentations. Reports are handy for administrators to visualize network traffic patterns, drill down into specific flows, set up alerts for anomalies, and plan for capacity, troubleshooting, and security analysis.
Get more information about configuring monitoring for NetFlow.
Use LogicMonitor for enhanced network monitoring
The LogicMonitor platform excels in setting up alerts with static or dynamic triggers based on defined thresholds from analyzed NetFlow data. This powerful feature ensures proactive identification and swift resolution of network issues. This guide on Troubleshooting NetFlow Monitoring Operations offers more about LogicMonitor’s tools.
Conclusion
Using traffic analyzers like NetFlow Analyzer is essential for gaining deep insights into network performance and security. Having a scalable and adaptable monitoring platform helps organizations grow and networks evolve seamlessly. With LogicMonitor’s comprehensive suite of network monitoring tools, including NetFlow Analyzer, organizations can achieve unparalleled visibility and control over network infrastructures.
With LogicMonitor, teams can proactively identify and resolve network issues, optimize resource allocation, and ensure the smooth operation of critical business applications.
More detailed insights and practical guides on leveraging NetFlow Analyzer for growing networks are available in these resources:
Microservices are becoming increasingly popular and are considered to be the next flexible, scalable, and reliable approach. Without a doubt, many developers are rethinking their application development methods. However, while many have been quick to jump on the microservices bandwagon, moving from monolithic architecture is not a decision that you should make lightly.
Before you decide the best way forward in your application development endeavors, it’s important that you understand the differences between legacy/monolithic architecture and microservices applications and the inherent pros and cons that each one holds. So, let’s dive in.
Contents
- What Is a Legacy Application?
- What Is a Monolithic Application?
- What Are The Pros and Cons of Monolithic Applications?
- What Is a Microservices Application?
- What Are The Pros and Cons of Microservices?
- When and Why Should You Choose Monolithic Development?
- When and Why Should You Choose Microservices Development?
- Combining monolithic and microservices: A hybrid approach
- What are the pros and cons of hybrid approaches?
- When to consider a hybrid approach?
- Choosing the right architecture for your application
What is a legacy application?
While monolithic applications are often referred to as legacy applications and vice versa, the two concepts are different. Many legacy applications are monolithic applications, but the term “legacy” actually refers to the state of development.
Typically, legacy applications are not being actively improved anymore, but they are being maintained enough to keep them running for the users who rely on them. Legacy applications eventually get phased out–either because the limited development of features and the user interface poses constraints for users or because the operations team decides they no longer want to maintain it.
In any case, migrating away from legacy applications and replacing them with something newer has many advantages for a business, but sometimes that approach presents just as many challenges. Rarely does a business rely on a legacy application because it lacks better options. Usually, there are better options, but moving to them is difficult because their business workflows are so tightly coupled with the legacy app.
What Is a monolithic application?
Many legacy applications fall under the umbrella of monolithic applications because monolithic development was extremely popular. Monolithic development creates single-tier applications where every component the application requires is built into itself.
The design of a monolithic application means that making changes to a feature is complicated. There are so many dependencies within the large applications that even a small update is time-consuming, and it requires all users to download an entirely new version for things to work. That’s why most monolithic applications are approached with a waterfall software development process where changes might be released annually or semi-annually.
Pros and cons of monolithic applications?
While the concept of monolithic applications might seem to contradict many modern best practices of application development, there are certain use cases where a monolithic approach might be ideal. Understanding the pros and cons of monolithic applications will help you decide if there’s ever a good time for you to take this approach.
Pros of monolithic applications
- Monolithic applications are simple to build, test, and deploy, with regard to software engineering. Because everything is housed together, developers will favor how easy it is to actually launch the application initially, but maintenance down the road is a different concern.
- Horizontal scaling is possible. Many people think that scaling a monolithic application is difficult. Still, they can actually scale horizontally fairly easily, and teams just need to run several copies of the app behind a load balancer to meet demand. Of course, this is most easily done in one direction because it’s hard to scale back once you’ve scaled up.
- Fewer cross-cutting concerns. Given that monolithic applications have one codebase for everything, there are fewer cross-cutting concerns when it comes to logging and monitoring performance.
- Improved performance. Since all the components in a monolithic application can share memory, they can boost performance because it’s faster than using service-to-service communications.
Cons of monolithic applications
- By nature, monolithic applications are fixed and linear instead of modular, and this contributes to the tight coupling of components. Entanglement and coupling impact the team’s ability to manage, scale, and update the application over time.
- One error can bring the whole thing down. Reliability is a major problem with monolithic applications. Because of the tight coupling of components, if one thing goes wrong in any module, it might make the entire application unusable.
- Updates require the entire application to be redeployed. Because there’s one large codebase with components so tightly coupled together, developers must re-deploy the entire application for every update.
- Technology limitations. In order to design a monolithic application, developers must use the same technology stack throughout the application. Making changes to this tech stack down the road will prove costly.
What is a microservices application?
Microservices are not just an approach to development but a greater approach to systems software architecture that will have a ripple effect throughout an entire company. The concept is appealing, and it can offer a myriad of advantages, but that has led a number of businesses to adopt microservices without fully thinking through the complications of doing so.
To put it simply, microservices applications are applications that are loosely coupled. Instead of creating an all-encompassing application, like a monolith, the microservices approach seeks to break each application down into standalone functionality components, dubbed a “microservice.”
Most often, microservices are packaged into containers, which are runtime environments that only contain the elements absolutely necessary to run the microservice. This gives developers, for example e-commerce developers, the freedom to pick and choose microservices and piece them together like a puzzle, allowing applications to be assembled. With microservices, each service can be added, changed, or entirely removed independently of the other microservices that make up an application.
Pros and cons of microservices
The loose coupling and independence of microservices have made them a de facto standard for DevOps, but it’s important to realize that DevOps and microservices aren’t the right fit for everyone. Let’s explore the pros and cons of microservices to help you decide if it’s the right approach for your development projects.
Pros of Microservices Applications
- Microservices are highly scalable. One of the biggest advantages of using microservices is that each component (i.e., microservice) can be scaled up individually and independently of the others, which makes optimizing resources very straightforward.
- Loose coupling simplifies changes. Since each microservice is loosely coupled to the others, development teams can easily test each component on its own and make changes to them over time.
- Improved fault isolation. When one microservice breaks, it won’t take down your entire application. In fact, you’ll be able to work with that broken microservice independently and get it up and running again faster.
- Language and tech agnostic. With microservices, you can select the best programming language or platform for each individual service, which makes utilizing the best-matched skill sets and new technology easy.
Cons of Microservices Applications
- Microservices go beyond development. Microservices architecture impacts systems, tools, methods, and many other components. Implementing microservices successfully starts with having a team that can support them.
- Tracking and monitoring can be extremely difficult. Breaking your apps down into multiple components makes development easier, but it makes tracking and monitoring things like performance and errors much more difficult and costly. To offset this, it is recommended to invest in a comprehensive container monitoring platform to gain full visibility into your microservices and containerized applications.
- Implementation leads to many anti-patterns. Many teams end up completely offsetting the advantages of implementing microservices by failing to properly plan out the implementation process and effectively change their approach and infrastructure. That’s why moving to microservices takes a great deal of time and research.
When to choose monolithic architecture
With the rise of microservices popularity, many developers have been quick to dismiss “traditional” development approaches like monoliths. But microservices are not a one-size-fits-all solution.
Overall, you’ll want to choose a monolithic architecture if:
- You’re working with a small team. If you’re working on your own or with a small team, don’t put the complexity of microservices on your to-do list. A monolith will be able to meet your needs without making you change your entire approach to development.
- You’re creating a simple application. A small application does not have the requirements in regards to flexibility or scalability to justify pursuing microservices. A monolith approach will help you by keeping everything together.
- You know nothing about microservices. Microservices require an incredible amount of research and practice. You won’t see any business value if you or your team aren’t already experts in microservices.
- You want to launch quickly. A monolith application will help you develop and launch the solution as soon as possible, and it can reduce your initial costs and help you validate the idea sooner.
When to choose microservices development
It’s easy to be enticed by all the benefits of microservices architecture and the potential that this development approach offers. However, microservices simply aren’t feasible for everyone. In fact, microservices applications can be needlessly costly and hard to monitor.
Before you choose microservices for your applications, it’s important to remember that implementing microservices isn’t an easy feat and it’s not something you should take lightly. Make sure you can check these boxes:
- Your entire team has microservices expertise. You and your team have to possess the skills and knowledge necessary to effectively implement microservices architecture and follow the best practices. You also need relevant experience in things like DevOps, containerization, and domain modeling.
- You have the appropriate resources. Appropriately implementing and managing microservices requires multiple dedicated teams. So, beyond expertise, make sure you have enough resources ready to devote to the endeavor.
- You’re working with a complex application that needs to scale. Microservices architecture really shines when working with highly complicated applications that demand superior scalability. You’ll be able to add new features with ease and accommodate a large user base without missing a beat.
Combining monolithic and microservices: A hybrid approach
While the debate between monolithic and microservices architectures often presents them as mutually exclusive, many organizations find that a hybrid approach can offer the best of both worlds. By blending elements of monolithic and microservices architectures, businesses can strategically leverage the simplicity and straightforward deployment of monoliths alongside the flexibility and scalability of microservices.
What is a hybrid approach?
A hybrid approach involves integrating microservices into a primarily monolithic application or maintaining some monolithic components while developing new features as microservices. This strategy allows teams to modernize at their own pace, without the need for a full-scale migration to microservices all at once. For instance, a core set of stable features might remain in the monolith, while newer, more dynamic components are developed as microservices to enhance agility and scalability.
What are the pros and cons of hybrid approaches?
This approach is particularly appealing for businesses looking to modernize their systems without the high upfront costs and risks of a complete overhaul. However, navigating a hybrid model isn’t without its challenges, and careful planning is essential to manage the increased complexity and integration demands.
Pros of a hybrid approach
- Hybrid models enable a gradual shift from monolithic to microservices architecture, reducing the immediate complexity and risks associated with a full migration. Teams can modernize specific application components step-by-step, prioritizing the most critical areas first.
- By retaining core monolithic elements, companies can avoid the extensive disruptions often associated with re-architecting an entire application. This ensures continuity and stability, especially for legacy systems that are deeply integrated with existing business processes.
- In a hybrid setup, microservices can be used to offload performance-critical or frequently updated components. This allows businesses to scale those particular services independently, without having to overhaul the entire application.
Cons of a hybrid approach
- Managing a hybrid architecture can introduce its own set of complexities. Teams must maintain the operational integrity of both monolithic and microservices components, requiring a careful balance of tools, skills, and processes.
- Ensuring seamless communication and data consistency between monolithic and microservices components can be challenging. Hybrid systems often require robust API management and integration strategies to handle the increased interactions between different architectural styles.
When to consider a hybrid approach
A hybrid approach can be particularly beneficial when dealing with large, complex legacy systems that cannot be easily decomposed into microservices. It’s also a good fit for organizations looking to explore the benefits of microservices without committing to a full transition immediately. By adopting a hybrid strategy, teams can take a more measured and risk-averse path to modernizing their application architecture.
Ultimately, the choice to adopt a hybrid approach should be guided by your specific application needs, team capabilities, and long-term goals. By carefully planning and implementing a hybrid architecture, businesses can leverage the strengths of both monolithic and microservices models to set their applications up for long-term success.
Choosing the right architecture for your application
The question of monolithic vs. microservices is being asked more and more every day, but don’t let the excitement of microservices fool you. While microservices have a number of use cases, you shouldn’t be so quick to dismiss monolithic applications–especially if you’re working with a small app or small team. From here, it’s up to you to choose the best option for your next development project.
Microsoft Entra ID, formerly known as Azure Active Directory, is Microsoft’s enterprise cloud-based identity and access management (IAM) solution. It provides secure access to resources like Microsoft 365, syncs with on-premises Active Directory, and supports authentication protocols such as OAuth, SAML, and WS-Federation. Entra ID enhances security through features like Multi-Factor Authentication (MFA), Conditional Access, and Identity Protection, making it a comprehensive tool for managing user identities and access in a cloud-first environment.
In July 2023, Microsoft rebranded Azure Active Directory to Microsoft Entra ID to improve consistency with Microsoft’s other cloud products. The goal was for Microsoft to offer a comprehensive identity management solution beyond just traditional directory management services. Microsoft Entra includes other products like identity governance, privilege access management, and decentralized identity solutions. Unifying these services under the Entra brand allows Microsoft to offer a more integrated and holistic approach to identity management.
What was Azure Active Directory?
Azure Active Directory was a directory service built by Microsoft in 2000 and released in the Windows 2000 Server edition. As later versions of Windows Server were released, the directory was improved, and additional services were tacked on (like Active Directory Federation Services). Teams with subscriptions to Microsoft 365, Office 365, or Dynamics CRM already had access to an edition of Azure AD.
First and foremost, Azure AD helped organizations manage identities. Rather than team members connecting to many different components directly, they could connect to Azure AD instead. This freed companies from the burden of on-premise security management. Instead of spending time and money on in-house security measures that may not be foolproof, enterprises used Azure for free or at a very low cost. They received state-of-the-art security that had been perfected over time. In addition to identity management, Azure’s other big claim to fame was user access management.
As Azure became more complex and multifaceted, oversight and management became more challenging. However, with Azure monitoring, teams could track all Azure metrics and ensure maximum ROI for their Azure spending. This gave teams a robust, lean system to help them grow and conserve time, money, and resources.
Microsoft Entra ID key features
Now, there’s Microsoft Entra ID, a comprehensive cloud-based identity management solution. It provides a robust set of features that helps businesses manage and secure user identities across modern digital environments, including:
- Single Sign-On (SSO): Allows users to access multiple applications and servers with one set of credentials instead of multiple login credentials, improving the user experience.
- Multi-Factor Authentication (MFA): Enhances security by requiring users to use two verification methods (email/text access codes, authenticator application codes, and hardware authentication) before accessing data.
- Granular access controls: Allows organizations to set granular or conditional access policies based on user, device, location, and real-time risk detection.
- Identity Protection: Helps prevent identity-based risks by using machine learning algorithms to detect suspicious sign-ins and other fraudulent activity.
- Privileged Identity Management (PIM): Allows organizations to use just-in-time privileges with approval workflows to minimize the number of people accessing sensitive data.
The Entra ID product suite offers more than great features for businesses. It also has security features built into the core offering, helping businesses secure data, protect customers, and comply with regulations.
It does this in a few ways:
- Customizable access controls to help organizations limit access to data and the scope of potential data breaches
- Features to help businesses comply with regulatory requirements like GDPR
- Encryption of data at rest and in transit
- Detailed logging for security analysis
- Regular security audits and penetration testing
One big benefit of working with Entra is that you can use other software in the Microsoft ecosystem. Entra integrates seamlessly with other Microsoft products, such as Microsoft 365, Azure Services, Dynamics 365, and the Power Platform.
Microsoft Entra also works well for developers, allowing them to build applications and authenticate seamlessly. It supports:
- Industry-standard protocols like OAuth 2.0 and OpenID Connect
- SDKs and APIs to integrate custom applications with Entra ID
- B2C capabilities for managing customer identities
Businesses that use Microsoft Entra get this comprehensive set of features—and more—that allow them to streamline identity management in their organization. It helps improve security, streamline access management, and enhance the overall cybersecurity posture.
Active Directory vs. Azure AD vs. Entra ID
While often used interchangeably, there is a difference between Active Directory and Azure AD. Azure Active Directory evolved from the cloud-based identity and access management solutions of its time. First released in 2000, Microsoft built Active Directory Domain Services to offer enterprises more control over infrastructure management. Single users could log in and manage various infrastructure components from one place, marking a turning point in directory management technology.
Azure AD was like an upgraded version of Active Directory, providing Identity as a Service (IaaS). IaaS is a cloud-based authentication service operated by an offsite provider that ensures that users are who they say they are.
Entra ID is the evolution of Azure AD. It takes the benefits of IaaS and adds features that help businesses integrate with modern cloud resources and hybrid environments. It has the capabilities of Activity Directory and Azure AD (user logins, user roles) and adds modern tools like OAuth for developer access, risk-management features, identity protection, and privileged access.
Entra ID is new and offers more flexibility and features than Azure AD and Active Directory, making it the clear solution for businesses that want a reliable service that offers more. But it’s important to understand what extra it offers. Here are a few ways it stands apart from traditional directory services.
Scope and vision
Azure AD and Active Directory were primarily focused on on-prem and cloud-based identity and access management. Entra ID is more comprehensive and is included in the entire Entra product family. It has other features like Entra Permissions Management and Entra Verified ID to help businesses build a more comprehensive identity management solution.
Product features
Azure AD and Active Directory contained many features that help businesses manage user identity by assigning IDs and roles to users. Entra ID offers a more comprehensive set of features and improvements in decentralized management, multi-cloud features, and advanced security and compliance capabilities.
Integrations
Active Directory was an identity management solution, and Microsoft Azure AD added to that by offering integrations with Microsoft’s cloud services. Entra ID has more flexibility. It not only integrates with Microsoft’s cloud services but also extends beyond Microsoft’s ecosystem to offer better support in multi-cloud and hybrid environments.
Security approach
Azure AD’s security approach was based on cloud-based identity security, and Active Directory used Lightweight Directory Access Protocol (LDAP) to manage on-prem authentication. Entra ID is broader and includes security features like threat detection, identity governance, and risk-based conditional access for different scenarios.
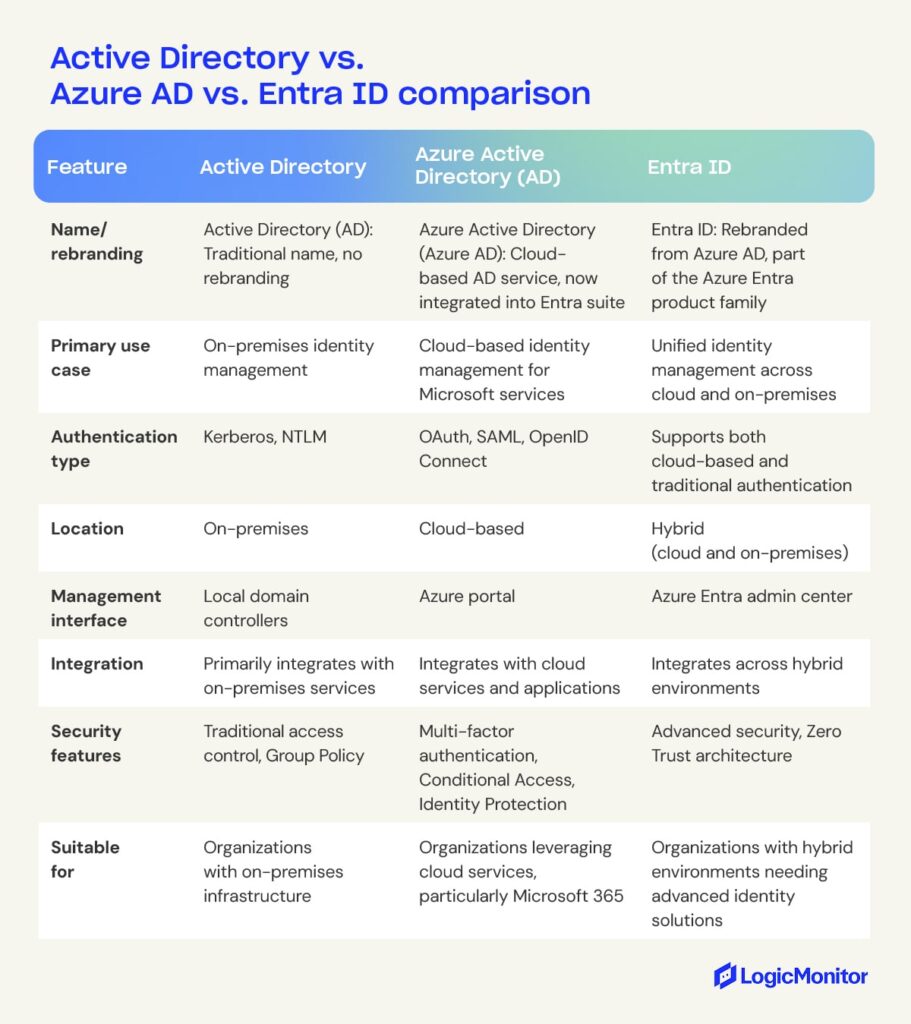
What are the benefits of Microsoft Entra ID?
Many teams operate in an increasingly hybrid model, which means companies must be able to move fluidly between onsite and remote resource management. Each team member must be empowered to access what they need regardless of location, which raises new security concerns. When many devices attempt to gain access, how do admins know whether they are legitimate users or rogue cyber attackers?
As infrastructure diversity grows, organizations need to uplevel their authentication methods and make sure privileges are in the hands of only those who need them. Entra ID offers precisely this, along with other key benefits, for modern organizations that want to prioritize both flexibility and safety. Rather than a traditional network access security perimeter, Microsoft provides authentication at the layer of organizational identity.
Access to various applications is simplified
With features like single sign-on, IT administrators can access many different apps from the same login. This is done either through authentication or federation. Entra ID also provides a more granular level of control compared to Azure AD, which helps in multi-cloud environments.
Users save time with self-service features
Team members can reset passwords by responding to extra security questions. This means authority isn’t required to unlock user accounts whenever something happens. Users can also create and manage new groups and associated memberships. Dynamic groups are groups where membership is automatically given according to a user’s attributes.
Security is achieved through multiple features
Entra ID provides a two-step verification process for users. Different users may be granted conditional access according to device type, network, user roles, and even the risk level of signing in. Extra protection is also available through advanced detection of identity risks and enhanced PIM.
Collaboration for B2B and B2C is streamlined
Teams can add partners to various projects and share pertinent information. If a business has its own app, customers can log in, and Entra ID will manage their identities.
Detailed reports give more control over user activity
Administrators are never in the dark with real-time data and access to high-quality reporting. They can access accounts that might be in danger and identify spam accounts. Activity logs are given in tenant reports.
How to set up Microsoft Entra ID
Organizations can set up Microsoft Entra ID using a few simple steps:
- Sign in to the Azure portal to access your Microsoft account
- Create an Entra ID tenant by searching for Entra ID and selecting “create Tenant”
- Configure basic settings like organization name and domain
- Set up a custom domain if available
- Create new user accounts in Microsoft Entra (or sync existing Active Directory accounts if coming from an on-prem installation)
- Set up groups and user roles to restrict access to only what’s needed
- Configure security settings like MFA for enhanced security
These steps will allow you to set up a simple Entra ID solution. Depending on your needs, additional steps are available, such as integrating pre-existing applications like Office and custom apps and creating reporting to gain insights into the Entra environment.
Microsoft Entra ID editions
Microsoft Entra ID is available in four versions: Free, Entra ID P1, Entra ID P2, and Microsoft Entra Suite.
Free
The free version is accessible once a business signs up for a Microsoft service, such as an Office 365 subscription. Users of the free Entra ID get a taste of the platform’s capabilities and how it provides value in the era of cloud-based technology. These capabilities include:
- Scalability: Free Entra ID supports up to 50,000 objects (users, roles, and assignments) and up to 300,000 for verified domains.
- Registration of Devices: Devices can be registered in Entra ID’s free version to support work-from-home employees or those who bring their own devices to work.
- Security Reports: While not the most comprehensive reports available in Entra ID, the free version includes standard reports that help teams monitor security.
- Microsoft Entra Connect: This is available in all editions.
- PowerShell: A command environment that utilizes cmdlets to automate things in the management of systems
The free edition is ideal for testing but not for a live environment because it doesn’t have key security features. Many teams get comfortable with the free version and upgrade to the premium as their needs advance.
Premium 1 and Premium 2
There are two premium versions of Entra ID, known as P1 and P2. P1 opens users up to an entire realm of new controls, like:
- Advanced Security Reports
- Advanced Application Use Reports run by machine learning
- Self-Serve Group Management
- System for Cross-domain Identity Management support
- Multi-factor Authentication
- User Licenses for Microsoft Identity Manager
Premium 2 is a step up for advanced enterprise technology management. P2 has all the basic functions of P1, with eight added functions. These additional functions fall under the categories of threat protection and identity governance. With P2, users can:
- Receive tailored recommendations to boost security
- Calculate levels of risk
- Provider greater capability to investigate risks when detected
- Set up limited timeframes for specific resource access
- Receive an audit history
- Manage access to groups and apps for both internal and external users
- Implement risk-based access controls
- Enable privilege identity management
Entra ID Governance
Entra ID governance is an advanced set of features for P1 and P2 customers. It contains additional features like:
- Lifecycle workflows
- Identity governance dashboard
- Advanced entitlement management
Office 365 is free, and extra features are included in the following editions: E1, E3, E5, F1, F3. Premium 1 costs $6 per user per month, Premium 2 costs $9 per user per month, and ID Governance costs $12 per user per month. Both Premium editions come with a 30-day free trial. Get more visibility and insight into your Azure Cloud costs.
The future of cloud computing
Microsoft Entra ID is anything but static. Features are added and updated regularly for superior functionality. Security needs are changing quickly as cyberattacks become more sophisticated and companies transition to remote work flexibility. As the second-largest cloud-based service provider, Entra ID and Microsoft Entra External ID equip teams to get ahead of their competition in cloud computing.
Interested in maximizing Azure ROI, gaining visibility, and sealing security vulnerabilities? Monitoring your company’s entire Entra ID infrastructure can give you a single-pane view of all your critical business operations.