For Managed Service Providers (MSPs), handling multiple clients’ IT environments means handling vast amounts of sensitive data, critical systems, and privileged access. Role-based access control (RBAC) is essential for data security and customer confidence to ensure that only the right people can gain access to sensitive information. As part of Cost Optimization, LogicMonitor has introduced RBAC into our Cloud Billing capability for access guardrails around displaying multi-cloud billing information and summaries.
Billing account level RBAC
With RBAC in Cloud Billing, an administrator can control the billing account permissions and access for roles, users or end customers. MSPs can provide customers access to view and interpret specific cloud billing information pertinent to their environments while safeguarding cloud billing data from other customer accounts.
Getting started with RBAC in Cloud Billing
Setting up RBAC in Cloud Billing is easy and will only take a few minutes to secure your data.
- Log in, select permissions, and navigate to the Cost Optimization tab.
(Note: Recommended best practice is to grant all account access only to the administrator role.)
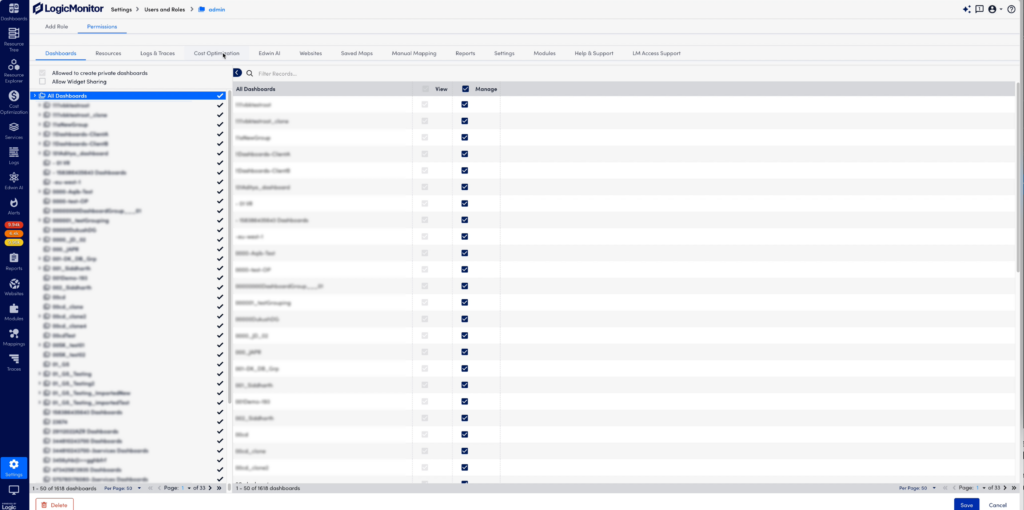
- In the Billing section under Cost Optimization, select the individual accounts to grant the user access. Filter on accounts you want to have access to and save the permission.
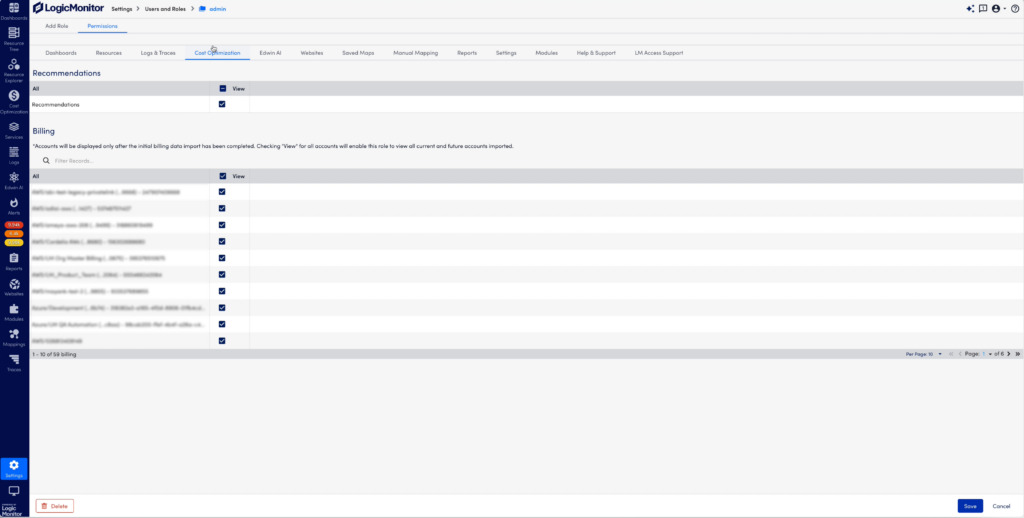
- Filter on account names or numbers to select specific accounts for billing data access. Save the selection to update role access.
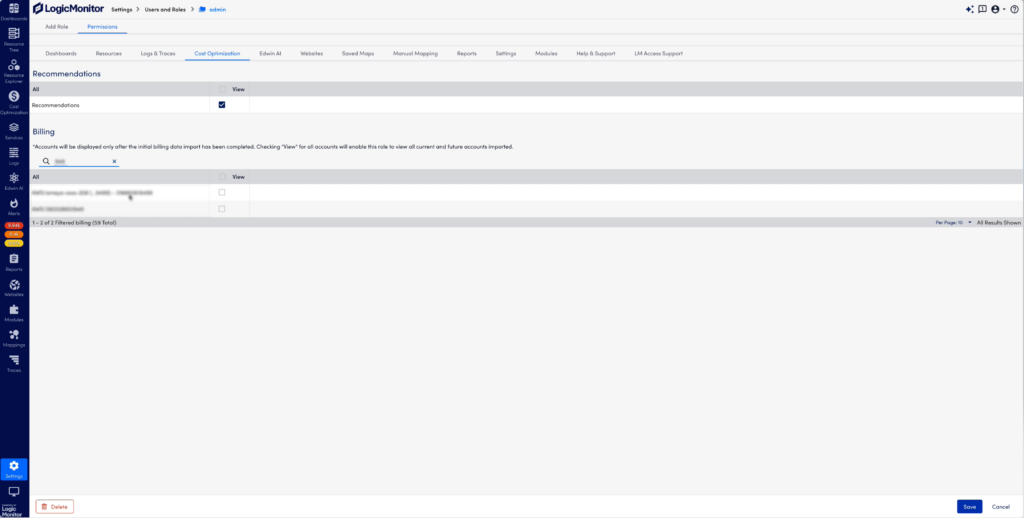
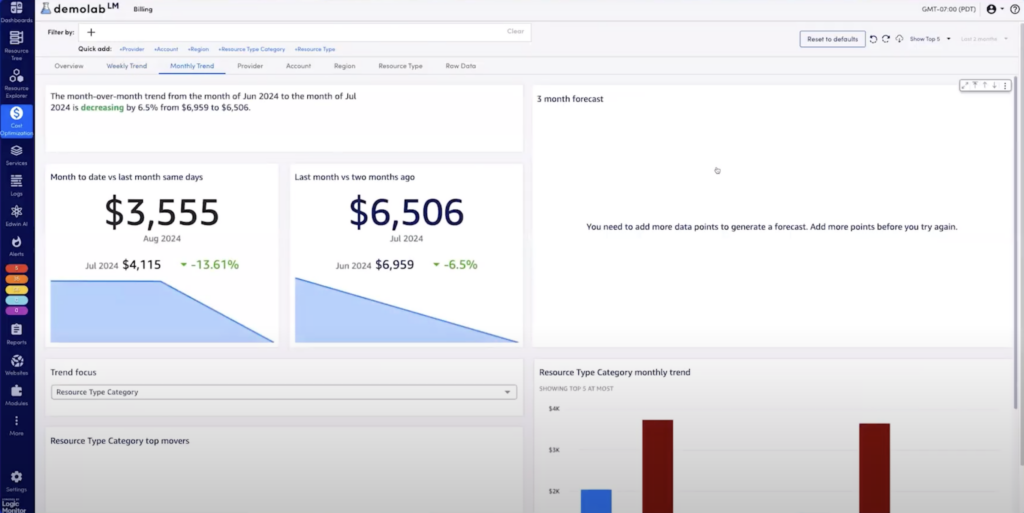
- Navigate to the Billing page under Cost Optimization to see the selected accounts that the user has permission to view.
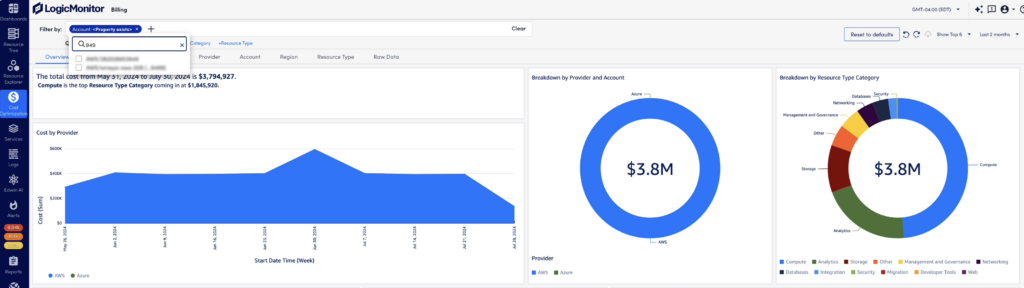
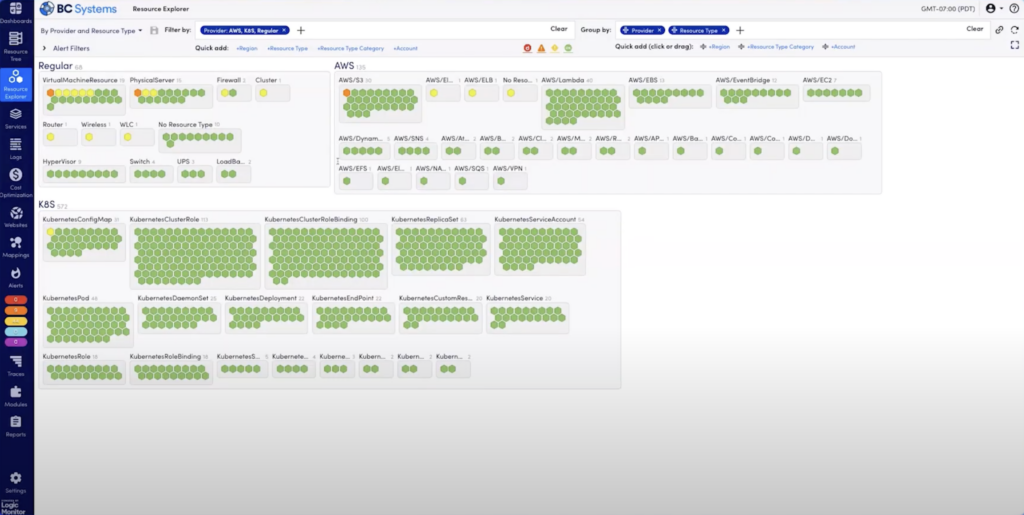
- While all dashboard views will be scoped to the individual accounts that have been enabled for access, the Accounts tab is one example that illustrates this clearly. Here, the user can only see the accounts in the data set according to their access.
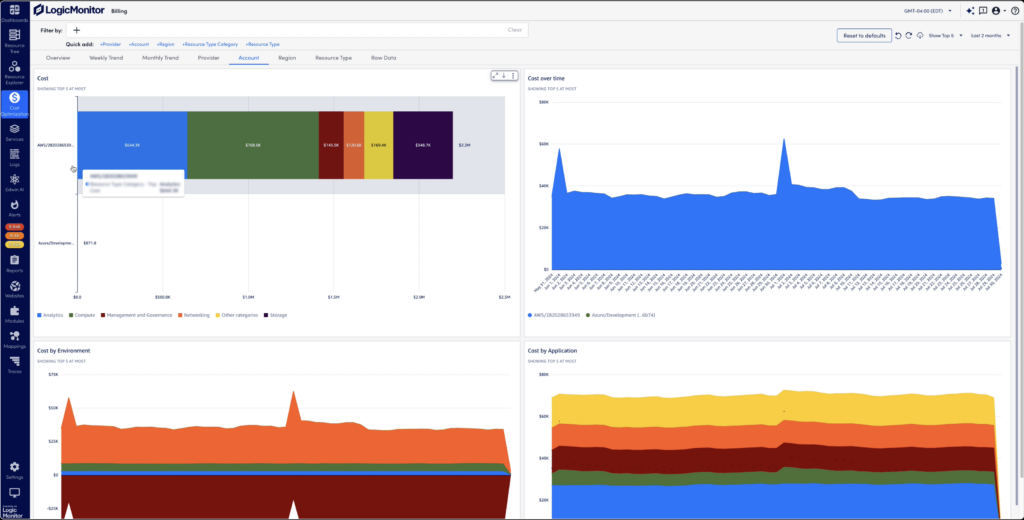
With Cloud Billing, users can see complete, detailed views of costs from Azure and AWS cloud services in a single view. They can analyze spend allocation with filtered tags including account, region, resource type, and more. With this detailed level of billing information, users can easily interpret cost trends to uncover where, when, and why cloud billing changes occurred.
Wrapping up
Incorporating RBAC into LogicMonitor’s Cost Optimization Cloud Billing ensures MSPs can offer their clients secure, granular access to billing account information, safeguarding sensitive data while promoting transparency. By enabling MSPs to control account-specific access and streamline billing visibility, RBAC empowers users to make informed decisions about their cloud spend across cloud services. This feature drives efficiency, improves security, and strengthens customer trust.
Contact us to learn more about how RBAC in Cloud Billing can enhance your cost management strategy and see a demo in action.
IT monitoring is a complex field with several approaches to manage monitoring and alerts. Most of the current monitoring solutions provide Static Threshold-Based alerting, where IT Operations staff are notified when resource utilization breaches the defined threshold. The problem with Static Thresholds is that these are manually adjusted, and tuning it to meet the specific environment and needs of an organization is a major challenge for IT Operations teams.
Dynamic thresholds, on the other hand, offer a more adaptive approach, automatically adjusting thresholds based on real-time data collection and reducing the noise of unnecessary alerts. However, they are not a one-size-fits-all solution and may not always be the best option in every scenario.
In this article, we’ll explore the pros and cons of both static and dynamic thresholds, providing insights on when to use each to best fit your monitoring needs.
When to choose dynamic thresholds
Understanding the need for varying thresholds
Identifying the proper thresholds for performance counters is no easy task. Moreover, tuning also limits the flexibility for application. It effectively means the same threshold is used across many servers despite those servers running different applications. For example, a 70% CPU utilization for a busy server is normal and doesn’t need to generate an alarm, whereas, for a relatively underutilized server, even 50% CPU utilization could mean something is wrong. Also, the same asset (such as a server or firewall) does not exhibit the same performance during different hours of the day or days of a week simply because the load is different.
My favorite example is the active directory server, which typically attracts a lot of traffic during morning hours when people log in but goes quiet during off-business hours, including weekends. Setting a reliable static threshold is always a challenge for environments where the load is not constant and shows some seasonal characteristics.
Managing alert fatigue: How dynamic thresholds help
Manually adjusting the threshold takes time and until it is achieved perfectly, real issues are not alerted by the monitoring solution. Monitoring solutions might report a lot of false positives, flooding the mailboxes of IT Operations teams with false alarms. The alert fatigue caused by the noise of false positives increases the risk of missing out on true positives.
Dynamic thresholds not only adapt to real-time data but also enable more proactive issue and anomaly detection, allowing IT teams to address potential problems before they escalate.
Handling cyclic variations with dynamic thresholds
Static Thresholds are also not very good with cyclic variations. There could be normal weekly and monthly variations in the performance counter, which is acceptable as per the needs of the business, but maintaining different thresholds for specific periods manually is time-consuming and prone to false alarms.
When to use static thresholds
Smart monitoring solutions analyze the pattern of metrics, learn what is normal in the environment, and generate alerts only when things (read metrics) are outside of the already established normal. These solutions need to be aware of cyclic variations and should cater to changes in the pattern of metric during various cycles. Since tuning is automatic, it is less of a hassle. Infrastructure monitoring tools that visualize the patterns and help to automatically create thresholds are less time-consuming than those that require manual adjusting.
Having said that, there are some scenarios where it makes more sense to use Static Thresholds. For example, when you want to be notified that a metric value changes from a previous value, i.e. on delta. In this case, it’s best to use Static Thresholds, as Dynamic Threshold works on data streams, not on the rate of change in consecutive values. Additionally, using Dynamic Thresholds on status values like API response (200, 202, 404, etc.) codes will not be helpful because response codes are not numerical values, and the confidence band generated on these will be misleading.
How LogicMonitor uses dynamic thresholds to reduce alert noise
The most prominent problem IT monitoring teams experience with Static Thresholds is the deluge of alerts and being able to understand what is truly useful and actionable out of the abundance of noise. LogicMonitor solved this problem in a phased manner with the first phase, reducing alert noise. We built a system that analyzes patterns of metrics, generates Dynamic Thresholds, and leverages these thresholds to reduce alert noise. When Static Thresholds are poorly set (or inherited from the default settings), the monitoring solution will generate countless alerts, and most of them will be useless. Now, we are using confidence bands generated by sophisticated machine learning algorithms, aka Dynamic Thresholds, to stop this alert noise. When an alert is triggered, and the value falls within the confidence band, our system will not route that alert. The alert will effectively be suppressed.
We use two independent components to achieve this alert reduction feature: one is an algorithm-centric service that generates confidence bands at regular intervals, and the second one is our sophisticated alerting system, which consumes this confidence band and, based on this, decides whether to route the alert or not.

This alert suppression feature was released to our customers in December 2019. While phase-1 was all about suppression, phase-2 is about generating the alerts by exploiting the bands generated by the ML algorithm. In phase-2 we are bringing the capability to define Dynamic Thresholds and generate alerts based on this definition. This gives users a powerful ability to tune the alert severity by quantifying how far the current reading deviates from the normal or baseline identified by our ML algorithm.
When alert suppression and alert generation are combined, false positives are minimized and true positives are maximized. LogicMonitor users will be getting the best of both worlds – alerts generated based on poorly set Static Thresholds will be suppressed, reducing noise, and when the metric value goes beyond a threshold, our Dynamic Threshold-based alert engine will generate an alert. We have built a sophisticated user interface to define Dynamic Thresholds and we are also providing a visual aid to help tune these settings.
Users can choose to generate a warning alert when 60% of values from the last five polls deviate by one band from the upper.
For example:
Confidence Band : (low:20, high:60, middle:40)
HighBand : (high – middle) : 20
LowBand : (middle – low) : 20
So, if for the last five polls, values are 65, 82, 81, 70, 84. Here, three values [82,81,84] (60%) are one band away from high (60), and our engine will trigger a warning alert.
Alert Engine works on a sliding window pattern, considering the last number_of_polls values for each evaluation.
Users can use the interactive chart displayed in the following image to tune the Dynamic Threshold definition.

LogicMonitor has also enhanced our alert workspace, now each alert generated using Dynamic Thresholds will be accompanied by a confidence band graph with additional information in it. This graph will also be sent out in email notifications.

With this feature, LogicMonitor’s AIOps team has built a system that provides more value to customers and reduces countless hours spent manually adjusting Static Thresholds. We will continue to enhance this feature and our confidence band generator system to provide more value to customers in the future.
Implementing dynamic thresholds: A step-by-step guide
Implementing dynamic thresholds can greatly enhance your IT monitoring by reducing noise and focusing on meaningful alerts. Here’s a step-by-step guide to help you implement dynamic thresholds effectively:
Step 1: Initial configuration
Start by identifying the key performance metrics that are critical to your environment. This includes CPU utilization, memory usage, network latency, and other performance indicators that typically vary based on workload. Configure your monitoring solution to collect and analyze datasources for these metrics continuously.
Step 2: Leverage historical data
Dynamic thresholds rely on historical data to establish patterns of normal behavior. Use historical data spanning different time periods—such as weeks or months—to capture cyclic variations. For instance, analyze daily, weekly, and seasonal trends to set a solid baseline. This baseline will be crucial for the system to automatically adjust thresholds according to the typical behavior observed during different cycles.
Step 3: Fine-tune threshold sensitivity
Not all alerts are created equal. Adjust the sensitivity of your dynamic thresholds to align with the criticality of each metric. For example, set tighter thresholds for metrics where deviations can lead to immediate service impacts and looser thresholds for less critical metrics. Use a sliding window pattern to evaluate metric deviations over recent data points, allowing your system to respond swiftly to real-time changes while avoiding overreaction to minor fluctuations.
Step 4: Integration with existing monitoring systems
Ensure that your dynamic thresholding integrates seamlessly with your existing IT monitoring tools. This might involve configuring APIs, plugins, or other connectors to feed data into your monitoring solution. It’s essential to keep your monitoring environment cohesive so that alerts generated from dynamic thresholds are visible and actionable alongside alerts from static thresholds or other monitoring rules.
Step 5: Continuous monitoring and adjustment
Dynamic thresholds are not a set-and-forget solution. Continuously monitor the performance of your dynamic thresholds and adjust them as your environment evolves. Regularly review alerts and threshold calculations to ensure they still reflect current operational patterns. Implement a feedback loop where alerts and responses are used to fine-tune the system further, enhancing its accuracy over time.
Take the next step with LogicMonitor
Ready to reduce alert noise and improve your IT monitoring with dynamic thresholds? Discover how LogicMonitor’s AIOps Early Warning System can help you streamline incident management and optimize performance.
Cloud migration–often also referred to as digital transformation or cloud modernization–is a critical process organizations undertake to enhance their IT infrastructure. Whether moving from traditional data centers to the public cloud (“lift and shift”) or transitioning from public cloud VMs to PaaS services (“refactoring”), cloud migration presents a set of common challenges that can impact project success.
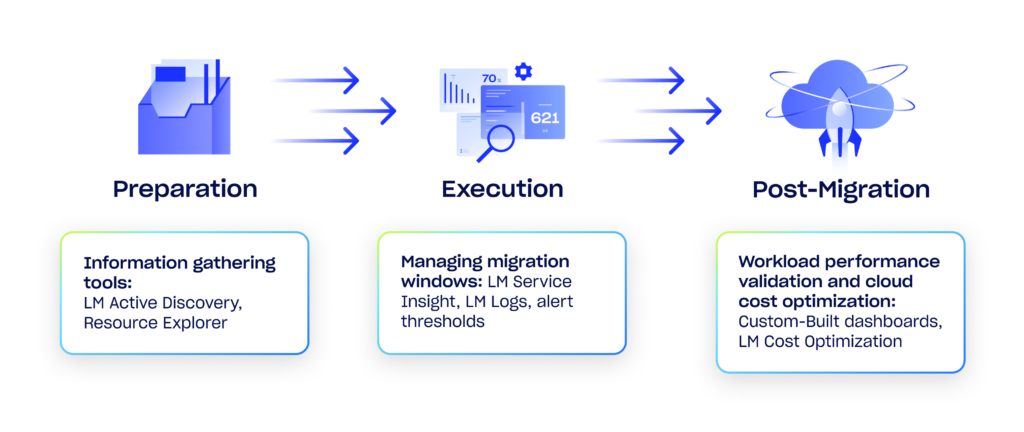
In this blog, we will explore these challenges across the three key migration phases: preparation, execution, and post-migration, and discuss strategies to overcome them.

1. Preparing for cloud migration: information gathering
One of the most time-consuming and error-prone aspects of cloud migration is the information-gathering process. This phase is crucial for uncovering and documenting all important relationships and dependencies between infrastructure components. Failure to understand these dependencies can lead to unplanned impacts on user experience and business continuity.
Example: You work for a global retail company preparing to migrate its core e-commerce platform to the cloud. During the preparation phase, your IT team is tasked with documenting the dependencies between the platform’s various components, including web servers, payment gateways, and inventory management systems. Due to the complexity of the architecture, some critical dependencies between the payment gateway and the order processing system are overlooked. This oversight results in significant downtime during the migration, as transactions fail to process correctly, causing revenue loss and customer frustration.
How to overcome: Utilize automated tools like LogicMonitor’s Active Discovery to automatically detect web server services, database services, and other critical software running on servers and VMs. Active Discovery also collects a huge set of “metadata” about the resource and logical relationships with other resources (logical topology). All of this collected info is used to create “inventory reports” that are a critical step of the preparation process. Using this programmatic approach reduces the chance of human error in this process and reduces the amount of work hours needed to complete it. Additional Tip: Group and filter your infrastructure resources using Resource Explorer to better organize the data needed for migration.
2. Execution phase: Managing migration windows
Once the migration process begins, teams often face the pressure of completing it and validating its success within a specific maintenance window. Any unexpected issues during this time can cause the migration to be paused or rolled back, leading to project delays. Enabling migration teams to triage and solve unplanned events during live migration quickly is critical to maintaining planned project timelines.
Example: You work for a financial services company migrating its customer data analytics platform to the cloud. The migration is scheduled during a weekend maintenance window to minimize disruption. However, halfway through the migration, your team encounters an unforeseen issue—an unexpected spike in data transfer errors that can’t be diagnosed quickly. Your team is forced to roll back the migration to avoid further disruption, wasting valuable time and delaying the project by several weeks. The rollback also leads to unplanned overtime costs and delays in launching new customer features.
How to overcome: Leverage out-of-the-box alert thresholds, LM Service Insight, and LM Logs to proactively identify and address issues as they arise. These tools help quickly triage problems, enabling teams to maintain the planned project timelines.
- Out-of-the-box alert thresholds ensure that you will be proactively notified of problems during migration.
- LM Service Insight helps you immediately understand which business services are impacted by alerts that are generated by the “OOB” alert thresholds (above).
- LM Logs log anomaly detection provides you with clues as to the root cause of alert conditions so that you can have a chance to address the problem during planned migration maintenance windows.

3. Post-migration: Workload performance validation
After the migration, validating the performance of workloads is a complex and time-consuming task. It involves gathering performance metrics from multiple sources, and discrepancies in data can lead to undetected negative impacts on application performance.
Example: You work for a healthcare provider that has just migrated its electronic health records (EHR) system to the cloud. Although the migration appeared successful, several weeks later, doctors and nurses start reporting that the system is sluggish, especially during peak hours. Patient records are taking longer to load, which is impacting patient care and leading to frustration among staff. Upon investigation, your team realizes that performance validation after the migration was incomplete, leading to undetected issues with database queries that are now causing bottlenecks.
How to overcome: Streamline performance validation by leveraging LogicMonitor’s hybrid observability to create purpose-built dashboards for workload performance comparisons. This helps ensure that any performance degradation is quickly identified and resolved.
4. Post-migration: Cloud cost optimization
After organizations have successfully migrated systems to the cloud, cloud cost optimization becomes a critical focus. Keeping cloud costs under control is essential to capturing the expected return on investment (ROI). However, optimizing cloud environments for cost involves significant complexity. This process requires a thorough analysis of workload metrics and accurate forecasting to ensure the cloud infrastructure is tuned for cost efficiency.
Example: You work for a manufacturing company that recently migrated its production management and supply chain systems to the cloud. The move was expected to streamline operations and reduce IT costs by leveraging cloud scalability. However, after a few months, you notice that its cloud expenses far exceed initial estimates. The complexity of cloud billing, involving costs for data storage, IoT sensor data processing, and real-time analytics, makes it difficult to determine exactly where the overspend is occurring. The lack of clear visibility into how different workloads are contributing to the cloud bill hinders your company’s ability to optimize spending. As a result, the financial strain begins to impact your company’s ability to invest in new machinery and process improvements.
How to overcome: Organizations can leverage LogicMonitor’s Cost Optimization capabilities to address this challenge. These tools simplify the process of analyzing and managing cloud costs by providing detailed insights into billing and usage patterns. The Billing Analysis views allow teams to break down their cloud expenses, identifying cost drivers and opportunities for savings. Additionally, the Recommendations view offers actionable suggestions for optimizing cloud resource usage, such as rightsizing instances or adjusting storage options, ensuring that the cloud environment remains cost-efficient.
Wrapping up
Cloud migration is a complex but essential process for modern organizations looking to stay competitive. By addressing common challenges in the preparation, execution, post-migration validation, and cost optimization phases, you can significantly increase the chances of a successful migration. Tools like LogicMonitor’s LM Active Discovery, LM Service Insight, LM Logs, and LM Cost Optimization are invaluable in navigating these challenges efficiently.
If you’re a systems administrator, there’s a good chance you’ve heard of Ansible—a powerful tool for automating IT tasks. Whether you’re new to Ansible terminology or looking to brush up on your knowledge, understanding the key terms and concepts is crucial to using the tool effectively.
In this guide, we’ll provide a clear overview of Ansible and Ansible terminology, covering everything from its origins to its most recent features. By familiarizing yourself with the essential terminology, you’ll be well-equipped to start leveraging Ansible’s capabilities to streamline your workflows right away.
How Ansible works
Ansible is a configuration management tool that automates the provisioning and deployment of applications and infrastructure. It is designed to be simple to use and easy to extend, making it an ideal tool for managing complex deployments.
Ansible works by connecting to your servers via SSH and then executing tasks on those servers.
You can think of Ansible as a remote execution tool, like SSH, but with some important differences.
- First, Ansible is designed to be idempotent, meaning that if a task is run more than once, it will have the same result each time.
- Second, Ansible is agentless, meaning that it does not require any software to be installed on the servers that it manages.
- Third, Ansible is designed to be easily extensible. There is a wide range of community-developed modules that can be used to add support for new technologies and systems.
Essential Ansible terminology
Let’s go through some of the key Ansible terminologies:
Playbooks
A Playbook is an expression of Ansible’s configuration, deployment, and orchestration language. They can describe a policy you want your remote systems to enforce or a set of steps in a general IT process.
- Example: A playbook might be used to install and configure Apache web servers on multiple remote hosts. The playbook defines tasks such as updating the package manager, installing Apache, and starting the service.
- Use Case: Automating the setup of a LAMP stack across several servers in a development environment ensures consistency and saves time compared to manual installations.
Server
Remote servers that you manage with Ansible are called Managed Hosts. Once you install Ansible on a management machine, you will use SSH to connect to remote servers.
- Example: If you have a fleet of Ubuntu servers that need regular updates, the managed hosts would be these servers, and Ansible would connect to them via SSH to perform updates.
- Use Case: Keeping all managed hosts up-to-date with security patches by running a scheduled playbook that applies updates automatically.
Target Machine
The machine where Ansible is run is called the Control Node. The target machines can be virtualized or physical systems.
- Example: A developer’s laptop or a dedicated automation server acts as the Control Node from which Ansible commands and playbooks are executed.
- Use Case: A centralized Control Node can manage hundreds of servers, streamlining administrative tasks like application deployment and system configuration from a single point.
Task
A task is a unit of work Ansible performs. Tasks are organized into plays, which are then executed on target machines.
- Example: A task could be as simple as installing a package, like apt: name=nginx state=latest, or restarting a service.
- Use Case: Automating the setup of a web server with multiple tasks such as installing NGINX, setting up a firewall rule, and ensuring the service starts on boot.
Machine:
A machine is a physical or virtual server that Ansible can manage.
- Example: Machines can include cloud-based virtual machines (like AWS EC2 instances), on-premises servers, or even network devices.
- Use Case: Ansible can manage a mix of physical and virtual machines in a hybrid cloud environment, making it easier to deploy updates across different infrastructures.
Modules
Modules are small codes Ansible uses to perform tasks on target machines.
- Example: The apt module is used to manage packages on Debian-based systems, while the user module can create or modify user accounts.
- Use Case: Automating routine administrative tasks, such as creating users, setting permissions, or deploying application code, by utilizing the appropriate modules for each task.
Roles
Roles are collections of related tasks and supporting files that can be used to easily provision complex environments.
- Example: A role might include tasks, templates, and variables needed to set up a database server, like MySQL, including installing the database, creating users, and setting configuration files.
- Use Case: Using roles to standardize the configuration across different environments, such as development, staging, and production, ensures consistency and reduces the risk of configuration drift.
Variables
Variables are used to store values that can be referenced in plays and tasks. Variables can be defined in playbooks, inventory files, and variable files.
- Example: A variable could store the version of a software package to be installed, like nginx_version: ‘1.18.0’, which can then be referenced throughout the playbook.
- Use Case: Using variables to customize deployments, such as setting different configurations for development and production environments without changing the playbook structure.
Understanding Ansible Playbooks
Ansible Playbooks are instructions that define what actions should be taken on a remote server or group of servers. They can configure, deploy, and manage systems and applications. Playbooks are written in YAML format and are very easy to read and understand.
Playbooks can perform various tasks, such as installing software, configuring services, or even rolling out entire application stacks. Playbooks are typically run from the command line using the ansible-playbook command.
Ansible playbooks are very flexible and can be used to automate many tasks. Here are five main use cases for Ansible playbooks:
- Configuration Management
- Software Deployment
- Continuous Integration and Delivery
- Application Orchestration
- Security and Compliance
What are Ansible machines?
Ansible machines are essentially software-defined machines that can be used to manage and automate tasks across your infrastructure. Ansible machines are built on top of existing physical or virtual machines, providing a consistent and repeatable way to manage your infrastructure.
Ansible machines are typically used to manage server deployments, provisioning, and configurations. They can also be used to automate application deployment and orchestration. Ansible machines are often used with other DevOps tools, such as Puppet, Chef, and SaltStack.
Steps to set up an Ansible machine
If you want to set up an Ansible machine, there are a few things you need to do.
- First, you need to install the Ansible software on your machine. This can be done using a package manager like apt or yum.
- Once Ansible is installed, you need to create an inventory file. This file will list all of the machines that Ansible should manage.
- Next, you need to create a playbook. This is a YAML file that contains a list of tasks that Ansible should run.
- Finally, you need to run the ansible-playbook command to execute the playbook.
Different types of Ansible machines
Ansible machines are classified into several types depending on their functionality. The most common types are Control, Remote, and Target machines.
- Control machine: A control machine is the central node in an Ansible infrastructure. It is used to manage all the other machines in the network. The control machine must have a copy of the Ansible project code and playbooks.
- Remote machine: A remote machine is any machine that is not the control machine. Remote machines are managed by the control machine using SSH.
- Target machine: A target machine is a remote machine being provisioned or configured by Ansible. Target machines can be of any type, including physical servers, virtual machines, containers, etc.
What are Ansible tasks?
Ansible tasks are small pieces of code that can be used to automate workflows and processes. There are three types of tasks: simple, complex, and conditional.
- A simple task is a single line of code that performs a specific action.
- A complex task is a multi-line task that can perform multiple actions.
- A conditional task is a task that only runs if certain conditions are met.
Using handlers in Ansible
A handler is an Ansible keyword that triggers a particular action on a remote server. Handlers are usually associated with notify directives, which tell Ansible to run a handler when a task changes state.
For example, if you have a task that restarts a service, you may want to use a handler to restart the service only if the task has changed state. This way, you can avoid unnecessary restarts and keep your remote servers running smoothly.
To create a handler, you need to use the Ansible handler module. This module allows you to specify the name of the handler, the action to be taken, and the remote server on which the handler should run.
Common Ansible commands
Ansible commands are the basic building blocks for automating infrastructure management with Ansible. By running simple Ansible commands or playbooks (YAML files that define groups of hosts and tasks to be run), entire server deployments can be set up or torn down in moments.
Ad-hoc
How you could use Ansible commands for some common tasks.
Task 1: Start and Stop a Service
If you need to start or stop a service on a remote server, you can use the following command:
$ ansible -m service -a “name= state=”For example, if you need to start the Apache service on a remote server, you would use the following command:
$ ansible server1 -m service -a “name=httpd state=started”Task 2: Install a Package
If you need to install a package on a remote server, you can use the following command:
$ ansible -m yum -a “name= state=present”For example, if you need to install the Apache HTTP Server on a remote server, you would use the following command:
$ ansible server1 -m yum -a “name=httpd state=present”Key Ansible functions and commands
Ansible commands are very powerful and can help you automate many tasks. Below, we will discuss the most commonly used Ansible commands.
- ansible-playbook: This is the most important Ansible command used to run playbooks. Playbooks are a set of instructions or tasks that need to be performed on a remote host or a group of hosts.
- ansible-doc: This command is used to view documentation for Ansible modules.
- ansible-galaxy: This command is used to install roles from Galaxy, a repository of community-contributed roles.
- ansible-vault: This command is used to encrypt and decrypt sensitive data.
- ansible-console: This command is used to launch an interactive Ansible session.
- ansible-pull: This command is used to pull playbooks from a remote Git repository.
- ansible-inventory: This command is used to generate an inventory file.
Understanding Ansible variables
Ansible variables help you define values that you can reference in your playbooks. Variables can be used to store values that you want to reuse throughout your playbooks, and they can be used in conditionals and loops to dynamically change the behavior of your playbooks.
In Ansible, there are two types of variables: facts and vars. Facts are variables automatically populated by Ansible from the information it gathers about the managed system. Vars are user-defined variables that can be used to store any value, including strings, numbers, lists, and dictionaries.
Introduction to YAML in Ansible
YAML is a human-readable data serialization format often used for configuration files. It is easy to learn and understand and can be used in conjunction with other languages, such as JSON or XML. Ansible uses YAML because it is easy to read and write, and computers can easily parse it.
How YAML tags work in Ansible
YAML tags are a powerful tool for Ansible that allows you to specify the type of data stored in a variable. This is especially useful when working with complex data structures like lists or dictionaries. By tagging the data, you can ensure that Ansible knows how to interpret it properly.
Final thoughts and next steps
Mastering Ansible terminology is the first step toward unlocking the full potential of this powerful automation tool. By understanding key concepts like Playbooks, Roles, and Modules, you can streamline your IT operations and manage configurations with greater efficiency. For further exploration of Ansible’s capabilities, including detailed guides on playbooks, tasks, handlers, and variables, be sure to check out the official documentation.
LogicMonitor can further enhance your automation journey by providing comprehensive monitoring and observability solutions, helping you maintain visibility and control over your automated infrastructure.
You might think that SD-WAN and firewalls are two completely unrelated technologies. However, integrating these innovations improves network availability, optimizes network performance, and adds an extra layer of security capabilities to your organization.
In this blog post, you will learn more about SD-WAN and firewalls, and why combining them can be a game-changer for your network infrastructure.
How Firewalls and SD-WAN work together
Firewalls and SD-WAN provide network security and management benefits but do it in different ways. A firewall enforces rules determining the security of outgoing and incoming network traffic, while SD-WAN enhances and manages traffic by directing it through the best available route. While many people working in IT use these technologies separately, you can integrate them for more secure and successful network performance.
Steps to integrate Firewalls and SD-WAN
Combining a firewall with an SD-WAN solution requires multiple steps. First, you must determine your network’s security and performance requirements and choose a firewall that integrates with an SD-WAN device. Then you need to physically connect your chosen firewall with the device and configure security policies on the firewall. That helps you decide which network router traffic to approve or block. You also need to determine network optimization procedures in your SD-WAN device.
Testing your integration and monitoring your network is critical. The best network monitoring tools, like LogicMonitor’s LM Envision platform, evaluate and visualize the performance and security of your entire network infrastructure, helping you identify and minimize issues that could impact your organization. LogicMonitor’s platform provides real-time network monitoring, letting you troubleshoot problems as they happen.
Benefits of combining Firewalls with SD-WAN
Combining firewalls and SD-WAN provides multiple benefits for network security and management. Integrating these technologies improves security by safeguarding internal and perimeter network layers. Your firewall protects your network infrastructure from external threats, while your SD-WAN device protects against dangers from incoming traffic.
Integrating firewalls with SD-WAN will also streamline network management, allowing you to focus on other IT tasks. You can benefit from a centralized network management system that ensures availability and reduces component failures.
Next, let’s take a look at the individual benefits of these two technologies:
Understanding Firewalls
Definition
A firewall is a network security device or software that observes and manages incoming and outgoing network traffic based on your preferred security parameters. It serves as a gatekeeper between your network and another network, like the Internet. Using a firewall can prevent unauthorized access to your network.
Functionality
Firewalls function in different ways. Firewalls monitor network packets and compare them to your security protocols, deciding which packets should pass through your network. It also prevents your network from accessing specific ports, which is an old-school way of making it more difficult for bad actors to infiltrate your network and steal sensitive data.
Other firewall functionality includes network address translation (NAT), which allows an internal network device to hide its IP address on the internet. NAT technically can hide an internal network device’s IP, but the primary purpose of NAT is to allow many (internal) hosts to access another network (usually the public internet) with the same address, so NAT is not quite “firewall” functionality.
In a modern environment, firewall solutions that go along with secure SD-WAN typically operate on zones and applications and abstract a lot of the IP/Port concepts of older firewalls.
Types
Firewall types include stateful inspection firewalls that inspect network packets and monitor connections between devices. Application layer firewalls examine network traffic at the application layer of a network based on the services and applications you use. Next-generation firewalls have extra advanced security features such as URL filtering and intrusion prevention. Cloud firewalls have recently become more popular and monitor network traffic in cloud applications.
Importance in network security
Firewalls and antivirus are important because they protect your valuable data centers from hackers and ensure your network is safe and reliable. Bad actors can distribute malware and distributed denial of service attacks after finding network vulnerabilities, making firewalls one of the most important additions to your tech stack.
Understanding SD-WAN
Definition
SD-WAN stands for Software-defined Wide Area Network. It uses software to spread network traffic across a wide area network and maintain network speeds and connectivity.
Functionality
SD-WAN functions by controlling how network traffic passes through locations. SD-WAN typically requires physical hardware and uses software to decide the best route for network traffic in real-time based on performance and bandwidth.
Traditional WAN at scale usually requires large amounts of money for MPLS circuits, which are like toll roads that provide reliable, safe, critical internet connections between two points.
SD-WAN is highly regarded because it takes many “commodity” internet connections (COX business accounts, home connections, satellites, MPLS, etc.), and it automatically manages traffic between them to give you a user experience like MPLS for much less cost and hassle.
Benefits
SD-WAN improves network performance. Ultimately, SD-WAN enhances traffic so the applications and service providers you use work properly. It also offers multiple security advantages. You can create security procedures through a single virtual platform, making it easy to review network activity and identify threats.
Importance in network management
Another benefit is simplified network management. You can customize and manage WANs with software rather than dealing with a traditional WAN through physical hardware. That can save time and costs for your organization and make it easier to administer and operate your network.
SD-WAN vs. Firewalls
| Feature | SD-WAN | Firewall | Combined Use |
| Primary Function | Optimizes network traffic and performance. | Secures network by monitoring and blocking threats. | Enhances both network performance and security. |
| Key Benefit | Improves connectivity and reduces costs. | Protects against cyber threats. | Provides a balanced approach to security and performance. |
| Use Cases | Multi-site connectivity, cloud access. | Perimeter security, internal segmentation. | Best for businesses needing both optimization and security. |
| Deployment | Cloud or on-premises, managed centrally. | Hardware or virtual, at network perimeter. | Integrated, often within a unified platform. |
| Performance Impact | Optimizes routes for lower latency. | May slow down traffic due to inspection. | Balances security with performance needs. |
When to use SD-WAN, Firewalls, or both
Choosing between SD-WAN, firewalls, or a combination of both depends on your organization’s specific network needs, security requirements, and overall IT strategy. Here’s a guide to help you determine the best approach for different scenarios:
When to use SD-WAN
SD-WAN is ideal for organizations that need to optimize their wide-area networks (WANs) for better performance and cost efficiency. Consider using SD-WAN in the following scenarios:
- Multiple Branch Locations: If your business operates across multiple locations, SD-WAN can simplify WAN management by providing centralized control and automated traffic routing across diverse connection types like broadband, LTE, and MPLS.
- Cloud-First Strategies: Organizations that rely heavily on cloud applications and services benefit from SD-WAN’s ability to provide direct, optimized access to cloud providers, bypassing traditional backhaul paths that can cause latency.
- Cost Reduction Needs: SD-WAN can significantly reduce operational costs by utilizing cheaper broadband connections alongside traditional MPLS, effectively balancing performance and cost without sacrificing reliability.
- Performance Optimization: For companies looking to improve application performance, SD-WAN’s ability to dynamically route traffic through the best available path ensures that critical applications receive the bandwidth and low latency they need.
When to use Firewalls
Firewalls are essential for any network security strategy, providing a first line of defense against cyber threats. You should prioritize standalone firewall solutions in the following situations:
- High-Security Environments: If your organization handles sensitive data or operates in a highly regulated industry (e.g., healthcare, finance), standalone firewalls offer the advanced threat prevention and compliance features necessary to protect critical assets.
- Internal Network Segmentation: Firewalls are effective for segmenting internal networks, creating security zones that restrict access to sensitive areas, and preventing lateral movement by attackers within the network.
- Dedicated Perimeter Security: For businesses with traditional network architectures that rely on a strong perimeter defense, firewalls provide robust security features such as deep packet inspection, intrusion prevention, and application-layer filtering.
- Complex Security Requirements: When your network demands intricate security policies, detailed monitoring, and customized access controls, standalone firewalls offer the depth of security management that SD-WAN alone cannot provide.
When to use both SD-WAN and Firewalls
Integrating SD-WAN with firewalls can provide the best of both worlds—optimized network performance and robust security. Consider combining both technologies in these scenarios:
- Comprehensive Security and Performance: Organizations that need to maintain high performance across their network while ensuring strong security should integrate SD-WAN and firewalls. This combination helps in dynamically routing traffic efficiently while protecting against cyber threats at multiple layers.
- Hybrid and Multi-Cloud Environments: For businesses leveraging hybrid cloud or multi-cloud environments, integrating SD-WAN and firewalls ensures secure, optimized connections between on-premises infrastructure and various cloud services, enhancing both connectivity and security posture.
- Retail and Distributed Enterprises: Retail chains, franchises, and other distributed enterprises with many endpoints can benefit from SD-WAN’s simplified management and firewalls’ ability to protect sensitive transactions and customer data across all locations.
- Remote Workforces: As remote work becomes more prevalent, combining SD-WAN and firewalls can secure remote connections, ensuring employees have reliable, fast, and secure access to corporate resources from any location.
Conclusion: Maximizing network performance with SD-WAN and Firewalls
Firewalls and SD-WAN have many differences, but combining them can improve network performance, management, and security. Doing so can prevent cyberattacks and ensure your applications operate smoothly, providing a robust solution that meets both connectivity and security needs. You can create a resilient and efficient network infrastructure that supports your business objectives by leveraging both technologies.
Continuous monitoring is essential to maximize the benefits of integrating SD-WAN and firewalls. LogicMonitor’s LM Envision platform provides full visibility into your entire network infrastructure, offering real-time insights and proactive alerts in a single pane of glass. This ensures you can swiftly identify and resolve issues, keeping your network secure and optimized.
Azure Stack HCI (hyperconverged infrastructure) is a robust solution that integrates Windows and Linux virtual machines (VMs) or containerized workloads. It can do this with seamless connectivity to Microsoft Azure for enhanced cloud-based services, comprehensive monitoring, and streamlined management.
This hybrid solution modernizes on-premises data centers by integrating them with cloud services for improved performance, scalability, and security.
How Azure Stack HCI works in cloud computing
With a hybrid cloud approach, your business can take control of its cloud journey, seamlessly integrating on-premises hardware with cloud services at a pace that suits your unique needs and timelines. This is thanks to seamless integration with Azure services like Microsoft Entra ID (formerly Azure Active Directory), Azure Monitor, Azure Backup, and more.
This integration ensures a consistent experience across on-premise and cloud infrastructures. You use the same management tools as an administrator across all your services. As a result, Azure Stack HCI is one of the fastest ways to get up and running with cloud computing.
This also means there can be significant cost savings when using Azure Stack HCI instead of making a hard switch from on-premise hardware to the cloud. At implementation time, you can use existing servers or commodity hardware, and then you can gradually move to cost-effective cloud solutions.
Beyond these benefits, Azure Stack HCI offers robust security features. With hyper-converged infrastructure, you can easily achieve virtual machine encryption and network micro-segmentation. Compared to implementing the same functionality in hardware, you can more easily manage HCI solutions and be more cost-effective.
How does Azure Stack HCI work?
Azure Stack HCI works by combining the functionality of traditional hardware elements (computing, storage, networking) into a single HCI solution with virtualization. On a practical level, you can administer all of these components through the Windows Admin Center.
Windows Admin Center is a web-based management console for managing a complete IT infrastructure. Since components like networking and storage are virtualized in an HCI environment, it’s much faster and less expensive to get up and running compared to the old ways of buying hardware, installing it, and maintaining it.
So, if an IT administrator wants to deploy a new instance of Microsoft SQL Server, creating a new virtual machine using storage from the Azure cloud is effortless. Similarly, you can quickly deploy a Docker application in a new Linux instance.
The tight integration with other Azure services simplifies the setup of other critical components, like authentication against Entra ID and defining network topology. With all the essential tasks of managing an IT environment available at a sysadmin’s fingertips, it empowers an organization to deploy new solutions rapidly.

Why choose Azure Stack HCI?
Azure Stack HCI offers a robust set of benefits that make it an excellent choice for organizations looking to modernize infrastructure and take advantage of hybrid cloud computing. Here are a few of the key benefits companies can expect to see:
- Hybrid cloud infrastructure: Offers seamless integration between on-premise infrastructure and cloud services, allowing organizations to maintain control over sensitive data while still taking advantage of cloud capabilities.
- Edge computing capabilities: Process data closer to the source, reducing latency and improving the performance of edge applications.
- Azure service integration: Get integration with various Azure services that make life easier, like Azure Backup, Azure Security Center, Azure Monitor, and others.
- Cost management and optimization: Allows organizations to use existing hardware to manage costs and a flexible pricing model that helps them grow into their cloud infrastructure.
- Robust security and compliance: Includes advanced security features like shielded virtual machines, encrypted networks, and Security Center integrations to help organizations protect their data and comply with regulations.
- Scalability and flexibility: Allows teams to easily scale their resource usage based on current needs and quickly adapt when the situation changes.
- Performance enhancements: Includes technology like Storage Spaces Direct and Software-Defined Networking to deliver high performance to both traditional and cloud environments.
The key features of Azure Stack HCI
HCI technologies greatly simplify security, scalability, and management. However, Azure Stack HCI’s hybrid cloud functionality makes it stand out from the crowd. With built-in integration with Microsoft’s Azure cloud service, you can easily transition from on-premise, hardware-defined infrastructure to a modern cloud-based environment.
Azure Stack HCI offers all the standard features of HCI solutions.
Virtualization
Two popular virtualization options Azure HCI offers are Hyper-V and containerization. Hyper-V allows for multiple virtual machines on the same server, while containerization allows teams to set up containerized workflows using the Azure Kubernetes Services (AKS) and similar software.
Software-defined infrastructure
Azure HCI also allows organizations to use software to define the infrastructure for networking and storage, where the configuration is abstracted away from the underlying hardware. These features allow teams to change infrastructure in real-time and programmatically based on current needs without investing in new hardware, licenses, and other expenses.
Edge computing
Edge computing allows the deployment and management of workloads closer to data generation points, reducing system latency and performance. Azure HCI includes Azure Arc, allowing organizations to connect their management services to on-premise, edge, and cloud services.
Security
Azure HCI comes secure out of the box, including consistent Secure Boot, UEFI, and TPM settings. It also contains security features that make things easier:
- Windows admin security tool
- Device and credential guard
- Bitlocker and SMB encryption
- Windows Defender antivirus
Azure HCI also has resources to help organizations comply with security standards, including PCI, HIPPA, and FIPS.
Simple management
Azure HCI offers an easy management portal for organizations to set up and modify their IT infrastructure. The Azure Portal gives an overview of HCI clusters, allowing teams to monitor systems at scale and manage Azure Services. Windows Admin Center is also available, giving teams the ability to manage individual virtual machines and edge services. Additionally, it provides many resources to collect resource metrics to see what resources your environment uses.
Performance optimization
Azure HCI offers many performance tools to help teams manage high-demand environments. It offers many solutions that help teams monitor performance across their infrastructure and increase performance. Some common performance tools available are high-performance disks for quick file access and data optimization and GPU partitioning for AI and machine learning jobs.
Azure Stack HCI management and deployment options
While the Windows Admin Center greatly simplifies IT deployments, Azure Stack HCI offers other flexible management options. Depending on your company’s existing cloud footprint and the abilities of your sysadmins, some of the other management and deployment options might be a better fit.
For example, organizations already using some Azure cloud services can use Azure Portal to manage their Azure Stack HCI components. Administrators experienced with Microsoft’s PowerShell can also use that environment to create programmatic and script deployment and management tasks.
Azure Stack HCI supports a specialized form of scripts known as Deployment Scripts, which provide advanced deployment automation options. This can be especially handy for larger organizations that want to scale their Azure Stack HCI footprint faster.
Companies that invest in virtualization solutions can also utilize some of their preexisting tools, including VMWare Center and System Center. The ability to use the tools that administrators are already familiar with is another reason that Azure Stack HCI can be a cost-effective way to migrate your organization’s infrastructure into the cloud.
Deploying Azure Stack HCI
Deploying Azure HCI will require some basic information:
- Server name
- Domain name
- Computer account names
- Organizational unit (OU)
- Static IP address
- RDMA networking
- VLAN ID
- Site names (for stretched clusters)
Steps to deploy Azure Stack HCI
There are several steps to deploy Azure HCI once you make a plan and gather the data for deployment:
- Initial setup: Install Windows on each node and configure the networking. Run the Azure HCI OS setup wizard to begin the installation.
- Cluster creation: Use Windows Admin Center to create the cluster and validate the configuration.
- Azure registration: Register the created clusters with Azure and set up Azure Arc for management.
- Integrate with existing systems: Configure Azure hybrid services and install Azure monitoring and management tools. Connect systems with pre-existing on-prem systems.
Deployment best practices
Deploying Azure HCI may be complex, especially if you have a large deployment. Several best practices are available that will help ensure a smooth installation.
- Thoroughly plan the deployment, including the network infrastructure, storage requirements, and software requirements.
- Document the deployment process to ensure you can repeat it in the future.
- Create a small-scale deployment to test before deploying at scale.
- Keep all systems updated with patches before deployment.
- Verify the minimum server requirements and that all servers have the same make and model (64-bit Intel Nehalem or AMD EPYC, minimum 1.4 GHz, 32 GB of RAM per node, 4 GB of RAM per TB of cache, high-bandwidth, low-latency network connection).
Use cases for Azure Stack HCI
In addition to the ability to quickly roll out IT infrastructure and applications, Azure Stack HCI has an almost unlimited number of use cases.
You can use Azure Stack HCI to create private clouds that offer a company the benefits of cloud computing with the security of on-premise installations. This is especially important for regulated industries like finance and healthcare. HCI allows organizations to store data securely, such as Electronic Health Records (EHR), financial data, and customer information.
You can also use it to make a high-performance computing cluster for demanding scientific and engineering applications by quickly creating virtual clusters. Doing this helps researchers create clusters to perform tasks like complex calculations, weather modeling, and genomic sequencing.
Azure HCI is also beneficial to any organization in the content distribution business. It can serve as the content delivery network, delivering text, images, and videos to customers worldwide using edge servers to manage delivery.
Adding remote offices to a corporate network with Azure Stack HCI is also easy. Using the Azure cloud as a bridge, remote workers can have the same experience as being on a corporate network, thanks to Azure Stack HCI’s virtualized networking solutions.
Azure Stack HCI is also well-suited to creating a DevOps environment for modern application development, testing, and deployment. It allows you to quickly deploy new apps and services and automate testing and debugging processes.
Learn more about Azure integrations
Are you ready to enhance your IT infrastructure by using Azure? Visit our Azure Monitoring Solutions page to learn more about how LogicMonitor can help you seamlessly integrate Azure with your current infrastructure.
VMware NSX is a comprehensive virtual networking and security platform that transforms how organizations manage and secure digital infrastructure by providing advanced network virtualization and security services. VMware NSX offers scalability and flexibility that meet the demands of growing businesses.
Plus, it helps bolster software-defined data center capabilities. This detailed overview covers core components, features, benefits, and real-world applications of VMware NSX, the comprehensive virtual networking and security platform built from VMware’s vCloud Networking and Security and Nicira’s Network Virtualization Platform.
What is network virtualization?
Network virtualization creates a layer between physical hardware and applications and services that rely on it. This layer allows third-party vendors like VMware to deliver networking hardware and software virtually, which means physical infrastructures are not needed to control network traffic. Decoupling software-defined networking operations from hardware offers numerous benefits, including eliminating the need for on-premises hardware and reducing costs associated with maintaining routers, switches, and physical equipment.
How VMware NSX works
VMware NSX achieves complete network virtualization by utilizing network automation and encapsulation. This process involves wrapping network traffic within protocols that traditional physical networking hardware supports, such as Generic Routing Encapsulation (GRE). It then divides physical networks into separate and independent virtual networks, eliminating the need for expensive in-house equipment while allowing the use of physical networking hardware through gateways that connect to VMware NSX’s virtual network. At the heart of VMware NSX is the NSX networking data center, which virtualizes various networking elements such as firewalls, VPNs, and load balancing.
Core components of VMware NSX
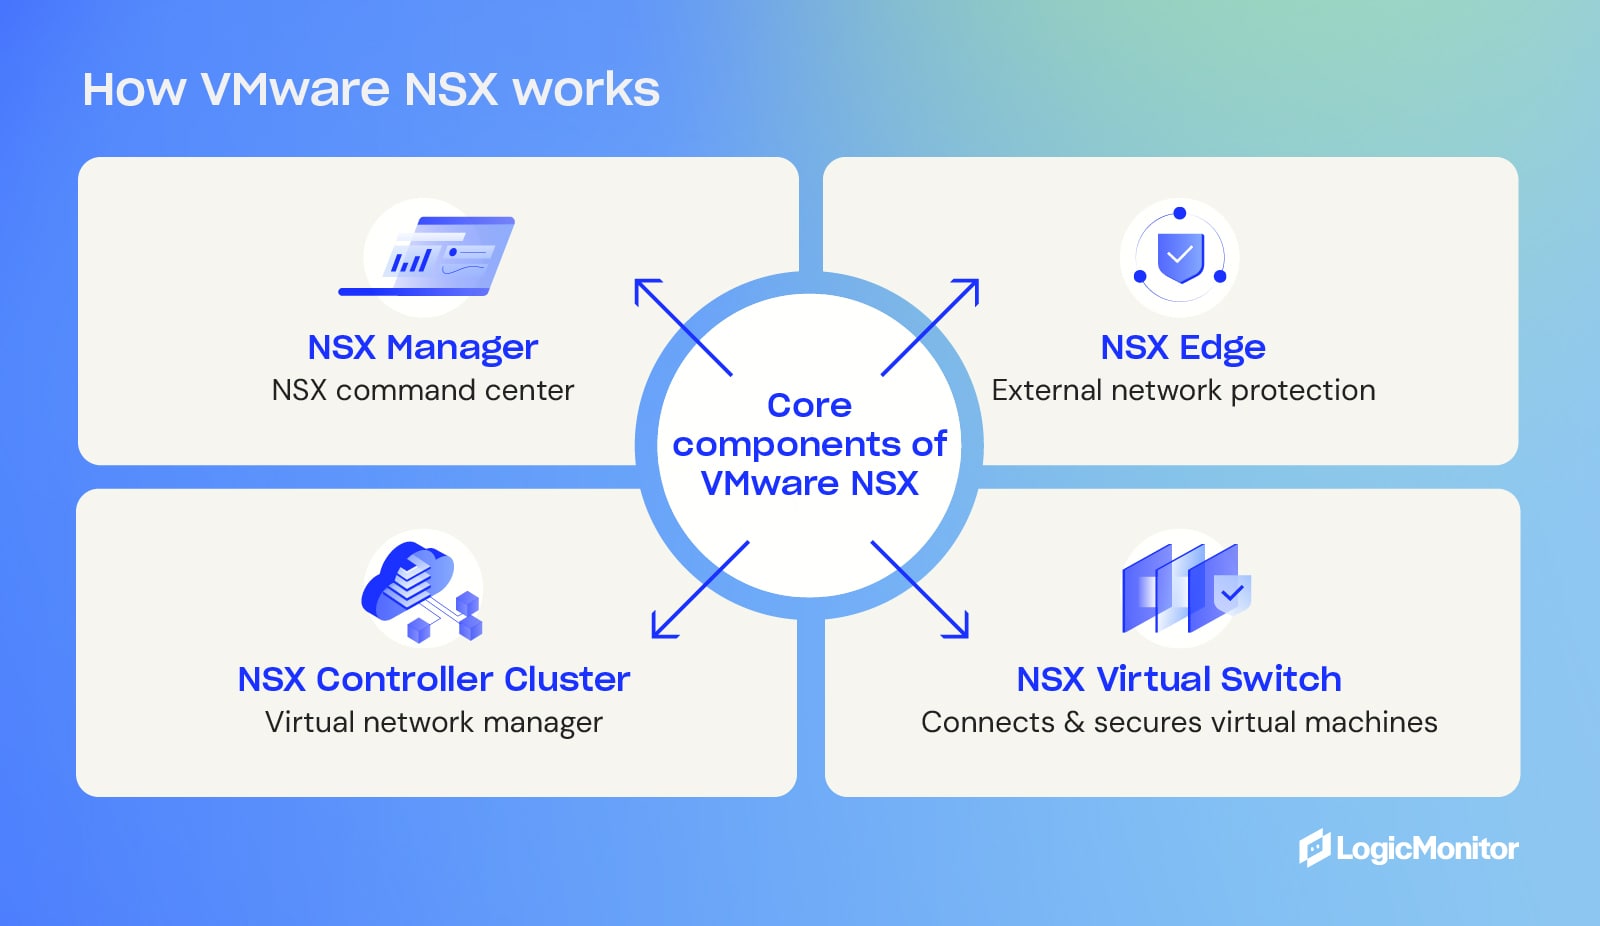
VMware NSX includes several key components that facilitate network virtualization:
- NSX Manager: This is the command center for the NSX platform, providing centralized control and monitoring using a web-based user interface and virtualization management.
- NSX Controller Cluster: Helps manage and control virtual networks by mediating the interaction between monitoring, communication, and traffic control.
- NSX Virtual Switch: Connects and manages virtual machines within a server, ensuring communication and security.
- NSX Edge: This service serves as firewall management and gateway-access security, combining an edge services gateway, and distributed logical router with the ability to assign IP addresses and use network address translation (NAT) to hide addresses from external networks.
Features of VMware NSX
VMware NSX offers an array of features that enhance networking capabilities:
- Logical switching and distributed routing: Provides logical switching capabilities with L2 logical networks that isolate workloads across multiple virtual networks and distributed routing through a distributed logical router (DLR) that connects interfaces with hosts when VM connectivity is required; virtual distributed switches utilize VXLAN technology to transit ESXi hosts in a cluster over an L3 fabric.
- Load balancing: Distributes incoming network traffic across different backend servers to help manage heavy traffic loads and ensure smooth network performance.
- VPN and distributed firewall: Provides L2 and L3 VPN solutions to create tunnels between pairs of NSX Edge devices in isolated data centers and securely connect to remote data center networks.
- Network function virtualization: Replaces network hardware with virtual machines, allowing virtual networks to operate on standard servers via hypervisors, providing a more cost-effective approach compared to investing in hardware devices.
Benefits of integrating VMware NSX
VMware NSX seamlessly integrates with numerous third-party companies, expanding its functionality and compatibility. A few notable integration partners include Arista Networks, Dell EMC Open Networking, and Juniper Networks. Integrating VMware NSX into a tech stack offers several benefits, including the following:
Enhanced network security
VMware NSX provides robust network security features, such as IDS/IPS, NTA/NDR, and sandboxing, to protect against ransomware and other malicious threats. The platform ensures consistent networking by synchronizing configuration and operational state across all sites. In addition, NSX offers micro-segmentation, allowing the division of data centers into different segments for enhanced security policies and control during data center virtualization.
Scalability and flexibility
VMware NSX allows the scaling of network designs to accommodate increasing workloads in businesses. The platform’s virtual private cloud (VPC) enables scalable NSX security and networking services while also providing flexibility to implement isolation as needed.
Streamlined data center design
With VMware NSX, data centers are no longer limited by physical equipment. They can be customized and optimized in a cloud network based on specific business requirements. Additionally, NSX offers various use cases for multi-cloud environments, including data center extension and multi-data center pooling.
Improved speed and agility
VMware NSX automates the deployment of network resources, reducing the time required to set up networking infrastructure in a virtual environment. The platform allows virtual network deployment across public clouds and private clouds, data centers, physical servers, and container platforms, enhancing the agility of network resources.
In addition to these essential components VMware NSX provides, it offers a wide array of features that simplify networking and enhance overall performance.
Real-world applications of VMware NSX
Various industries use VMware NSX to enhance network infrastructure:
- Media and Entertainment: NSX ensures high performance and security for media streaming and content delivery. Its robust features allow it to manage traffic even as viewership spikes, making it an ideal solution for large-scale streaming operations.
- Financial Services: VMware NSX provides a secure and scalable network infrastructure for financial transactions and data management. Services across the financial sector utilize NSX technology to create infrastructures that maintain compliance while quickly adapting to ever-changing markets. Financial institutions like Deutsche Bank rely on its performance for rapid scaling and easy integration.
- Healthcare: VMware NSX enables the secure and efficient handling of sensitive patient data and medical applications. Prominent electronic medical record (EMR) companies like Epic rely on its performance and security.
Is VMware NSX worth investing in?
As a trusted leader in virtualization solutions, VMware offers a highly effective product with VMware NSX. The platform provides features like load balancing, logical switching, distributed routing, and network function virtualization. By integrating VMware NSX into tech stacks, organizations can enhance network security, scalability, and streamline data center design.
Get detailed information on how to maximize VMware NSX investments at VMware Integration.
Transform your IT infrastructure today
Check out LogicMonitor’s detailed guides and resources to learn more about network virtualization and the benefits of VMware NSX. Get insights from the 2023 G2 Network Monitoring Grid Report.
Microsoft’s cloud object storage service, Azure Blob Storage, is designed for storing large amounts of unstructured data, like text, video, and audio. It provides scalable and cost-effective storage solutions for businesses that have large amounts of invaluable data that need to be stored but follow no organization.
Ensuring unstructured data is easily accessible and manageable is how Microsoft Azure Blob Storage provides solutions for companies that need to store large quantities of disorganized information.
What is Azure Blob storage?
Imagine two people—Paul and Lindsay—storing accessories. John arranges his accessories by color on shelves while Lindsay tosses hers into a pile. Lindsay’s approach is like Azure Blob Storage: she can throw any accessory into the pile without arranging anything. In this way, Lindsay can grow her stack almost exponentially, while Paul will eventually run out of shelf space.
Storing large volumes of data without hierarchy or organization is, unfortunately, a necessary evil for large companies, even though sifting through unorganized data is challenging. And that’s where Azure Blob Storage delivers more than alternative cloud storage options.
Blob is the shortened term for ”binary large object.” Azure Blob Storage is Microsoft’s cloud platform that allows developers to store large amounts of unstructured data or data that doesn’t fit into a specific data model or definition, like text or binary data.
One of the key features of Microsoft Azure Blob Storage is that it allows large file transfers through a file system network by splitting files into smaller pieces when uploaded. Once uploaded to the cloud server, the large files appear together in one file. Large files of unstructured data might include audio, video, text, and other data that is accessible through an Internet connection.
Key applications of Blob Storage
- Sharing videos, documents, or images through a browser
- Storing video and audio
- Updating and storing log files
- Data backup, restore, archiving, and disaster recovery
- Internet of Things (IoT) data storage
- Data analysis
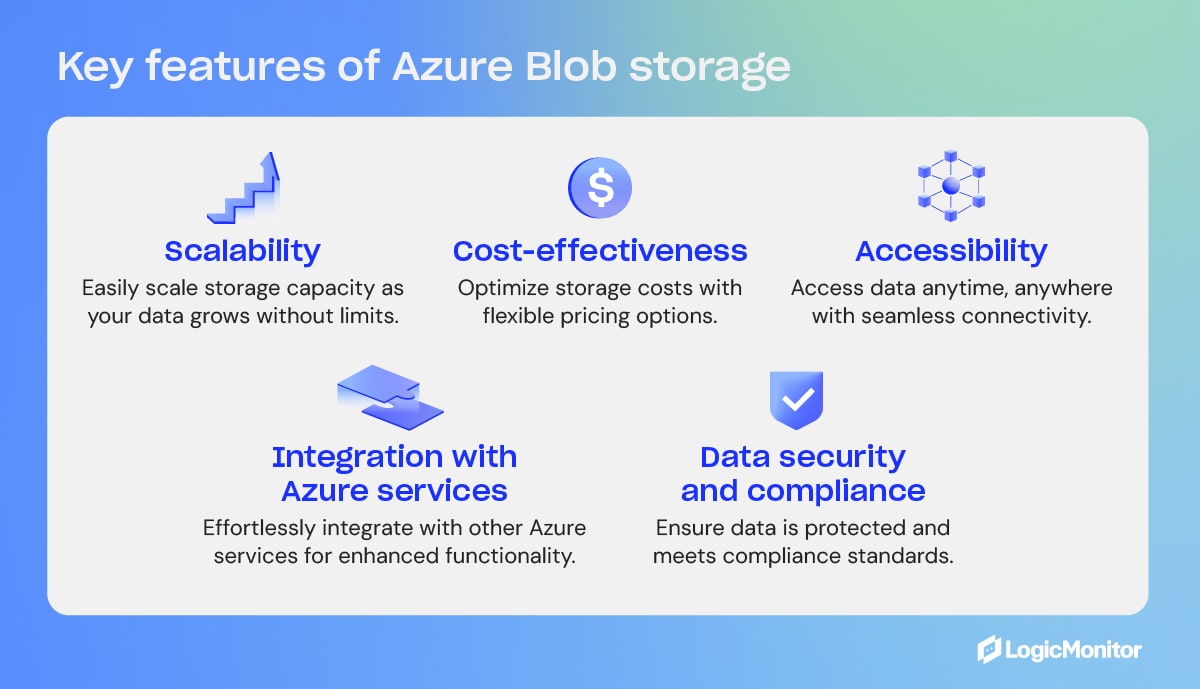
Key Features of Azure Blob Storage
- Scalability
- Cost-effectiveness
- Accessibility
- Integration with Azure services
- Data security and compliance
What is Blob Storage in Azure?
Blob Storage is not a stand-alone product but a feature within the broader Azure platform. Blob is one of the core storage solutions that Azure offers, designed to hold large amounts of unstructured data, such as text or binary data. As part of Microsoft’s Azure web services, Blob Storage integrates with other Azure services.
Access methods
Objects in Azure Blob Storage are accessible via HTTP/HTTPS anywhere in the world through Azure Storage REST API, Azure CLI, Azure PowerShell, or an Azure Storage client library. Client libraries are available in different languages, including .NET, Node.js, Java, Python, PHP, Ruby, and Go. Azure Blobs are manipulated with .NET code.
Blob containers
Blob containers work like drawers and make file management easier. One container can store audio files, while another stores video files. Furthermore, one storage account can include unlimited containers, and a container can keep unlimited blobs.
Containers are self-contained, and each container can hold up to 500 TB.
The names of containers must have a valid IP address in order to form a unique resource identifier (URI). Microsoft offers these guidelines when naming containers:
- Keep names between three and 63 characters long
- Start names with a letter (lowercase only) or number
- Use dashes (-) without spaces; do not use two or more dashes consecutively
Types of blobs in Azure Blob Storage
Microsoft Azure Blob Storage includes three types of blobs: block blobs, append blobs, and page blobs. Once a blob is created, its type cannot be changed. Blob updates are specific to appropriate operations. Here is an overview of the different types of blobs and what they do.
Block blobs
- Best for storing media files, text files, documents, and binary files. They can be different sizes (4000 MiB max.) and contain up to 50,000 blocks.
- Use case: Blocks uploaded to storage accounts are associated with specific block blobs and become part of blobs when a list of blocks, including new block IDs, is committed. Blocks remain uncommitted until they are saved or discarded. Uncommitted blocks can total up to 100,000.
Page blobs
- Collection of 512-byte pages used for random read and write operations.
- Use case: Page blobs are created by writing the maximum size a blob will grow on a page blob. Unlike block blobs, write-to-page blobs are committed directly to a blob. The total size of a page blob is 8 TiB.
Append blobs
- Designed for append operations like storage and log file updating.
- Use case: Add blocks to the ends of blobs using the “Append Block” operation. Existing blocks cannot be updated or deleted. Blocks can be different sizes, with a maximum of 4 MiB each, and include up to 50,000 blocks.
You can append blobs using the command line:
1. Install the Azure SDK for Python.
If you haven’t installed the Azure SDK, you can do so using pip.
pip install azure-storage-blog2. Set up the Azure Blob Storage connection.
You’ll need your storage account name, account key, and the container name of where your blob is located or where you want to create it.
from azure.storage.blob import BlobServiceClient, BlobClient, ContainerClient

# Replace with your values
account_name = "your_storage_account_name"
account_key = "your_storage_account_key"
container_name = "your_container_name"
blob_name = "your_blob_name"

# Create a BlobServiceClient
blob_service_client = BlobServiceClient(account_url=f"https://{account_name}.blob.core.windows.net/", credential=account_key)

# Get the ContainerClient
container_client = blob_service_client.get_container_client(container_name)

# Get the BlobClient for the Append Blob
blob_client = container_client.get_blob_client(blob_name)
3. Get or create an append blob.
If an append blob doesn’t exist, you can create one. If it already exists, you can append data to it.
# Create the Append Blob if it doesn't exist
blob_client.create_append_blob()
4. Append data to the blob.
You can now append, adding new data at the end of the blob.
# The data you want to append
data = "This is the data to append\n"

# Append data to the blob
blob_client.append_block(data)
5. Confirm the append operation.
You can take this additional optional step to verify that your data has been correctly appended to the blob.
# Download the blob's content
downloaded_blob = blob_client.download_blob()
print(downloaded_blob.readall().decode('utf-8'))
Alternatively, to perform the append operation using the command line, you can install Azure Portal or Azure Storage Explorer, which gives you the ability to perform the operations using a graphic interface.
Storage and pricing tiers
Data storage costs depend on two factors: transaction costs and storage costs. As a company’s data grows in the cloud, it can be organized based on how frequently it is accessed and how long it will stay in the cloud. Azure Blob Storage offers three access tiers to store blob data depending on use, with pricing options to match your needs.
- Hot tier: Best for storing operational use data that is frequently accessed or modified; good option for migrating prep data to cool access tier; online access; highest storage cost; lowest access cost.
- Cool tier: Best option for occasionally accessed data, like backup and disaster recovery files, infrequently used data that requires availability, and large data sets that need cost-effective storage. 30 days of storage are recommended, and online access is available. The cool tier has lower storage and access costs than the hot tier.
- Archive tier: Offline option for storing rarely accessed data (once in 180 days), like long-term backups, secondary backups, raw data, compliance data, and archival data; lowest storage cost but higher data retrieval costs and latency than the hot and cool tiers.
Changing storage tiers
Tiers can be changed by calling the REST API Set Blob Tier, which is the best option for switching from hot to cool, or by calling the Copy Blob operation, which is suggested for moving archival blobs online or switching from cool to hot. Changing from hot to cool (or vice versa) or to archive initiates changes instantly, but changing an archived blob to a hot or cool tier requires rehydration, which can take up to 15 hours.
Blob storage security
Cloud encryption encodes data as it travels between cloud-based storage units and their respective locations. All blobs, regardless of type, undergo encryption before being stored in Microsoft’s Azure Blob Storage cloud. In addition to cloud security, Azure Blob Storage offers ways to specify who can access data.
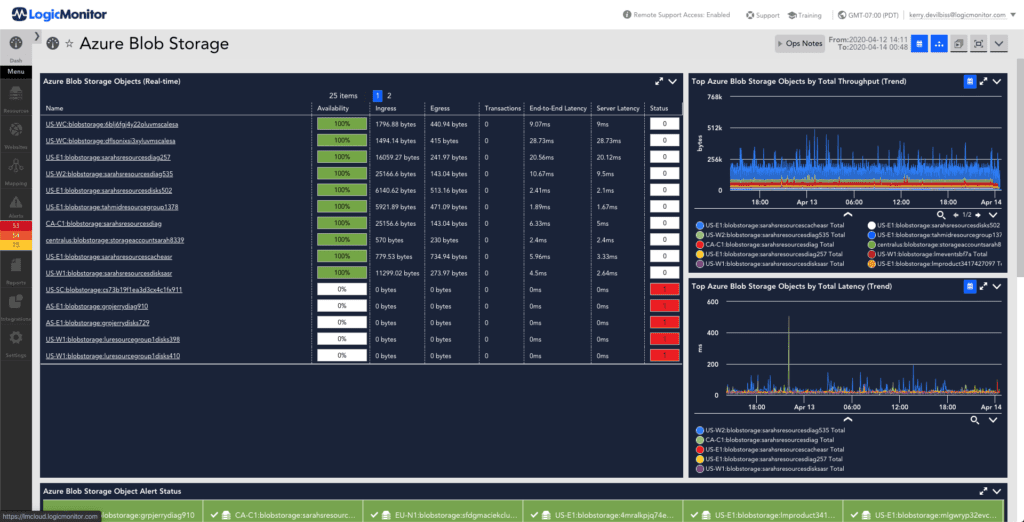
Getting started monitoring Azure Storage with LogicMonitor
LogicMonitor is an industry leader in monitoring networks and web services. These steps will help you apply LogicMonitor to Azure storage services.
- Your LogicMonitor setup for Azure storage begins with registering your LogicMonitor account with Microsoft Identity Access Management (IAM) and adding your Azure storage account and environment to LogicMonitor.
- Once you’ve given LogicMonitor access to your Azure storage, you’re ready to create and customize your data sources to fit your organization’s needs.
- With your storage options configured the way you like, consider your organization’s needs and size resources as necessary to optimize your storage performance.
Comparing Azure Blob storage with other top web services
Azure Blob shares the market with a number of other similar web services. Its fiercest competitors are Amazon Web Services’ Simple Storage Service (AWS S3) and Google Cloud Storage (GCS). AWS S3 and GCS are each designed to perform cloud-based web services, each with its own capabilities and drawbacks. When compared to Azure Blob, these features stand out.
Key similarities
Azure Blob, AWS S3, and Google Cloud Storage all utilize an object storage model in which data is stored as objects held in containers. All three services are scalable with high availability. Each web service offers strong zone and trans-regional redundancy and provides varied tiers of service to fit the needs and budgets of its clients.
Key differences
While they may seem quite similar on the surface, a deeper dive reveals some notable differences that make each more suitable than the others for different purposes.
Pricing structure
Each web service supports a free tier of service, each with its own special limitations.
- AWS S3 pricing includes storage costs, request costs, and data transfer costs. AWS also has charges for features like Glacier retrieval times and S3 Transfer Acceleration.
- Google Cloud Storage includes storage class costs, operation costs, data retrieval, and data transfer costs, with simplified pricing across different storage classes.
- Azure Blob Storage: Pricing is based on storage tier, read/write operations, data retrieval, and data transfer costs. Azure offers lower storage costs for the Cool and Archive tiers but has higher read and retrieval costs.
Object types
AWS S3 primarily focuses on a flat namespace for storing objects, and GCS uses a similar storage model. Azure Blob offers three types of blobs: block blobs, append blobs, and page blobs, each serving a different purpose.
Service integration
AWS S3, GSC, and Azure Blob each integrate best with services and infrastructures designed specifically for them.
Data management
AWS S3 and GCS support bucket policies for data access and management, while Azure Blob relies on Azure Active Directory (AAD) for identity management, RBAC (Role-Based Access Control) for access control, and Shared Access Signatures (SAS) for temporary access.
Who uses Azure and Azure Blob?
As an industry-leading web service, Azure boasts a robust clientele of well-known and respected organizations from around the world across all Azure platforms. Industries such as manufacturing, finance, and even video game creators rely on Azure to keep the flow of data steady and secure.
Given the scale of these companies that rely strongly on Azure services, they very likely utilize Azure Blob for many key functions in their operations.
- In Japan, the Kubota Corporation’s engine engineering department implemented Azure’s high-performance cloud computing, streamlining innovation and maintenance times.
- The National Bank of Greece built an Azure-powered AI solution that significantly reduced document processing times and dramatically improved documentation processing accuracy.
- In the U.S.A., the gaming company Hi-Rez Studios moved to Azure Kubernetes and Azure SQL, substantially expanding their scaling capabilities. Since these implementations in 2018, Hi-Rez has adopted numerous other Azure services that have improved its back-end services and enhanced its public-facing products.
Blob storage is optimal for storing data
Microsoft Azure Blob Storage is a scalable, cost-effective solution for storing large volumes of unstructured data. With an almost unlimited storage capacity, Azure Blob Storage offers excellent options for storing data that needs no hierarchy. Being cloud-native means companies can access data anywhere an Internet connection is available. Plus, Azure Blob Storage is cost-effective, providing tiered pricing according to data access needs.
In short, it’s the storage solution that gives companies an advantage over the competition when it comes to managing data efficiently in the cloud and meeting data storage needs.
Explore an array of LogicMonitor’s comprehensive cloud-monitoring solutions to dive into advanced features and integration options.
Welcome to the second installment of our Resource Explorer series. In this blog, we’ll discuss the practical aspects of getting started with LM Envision Resource Explorer. If you’re new to Resource Explorer or want to learn more about its benefits and features, we recommend checking out our first blog in the series.
For those ready to roll up their sleeves and start using this powerful resource management tool, let’s jump into the step-by-step guide on navigating, customizing, and maximizing Resource Explorer in your environment.
Navigating to Resource Explorer
Navigating to Resource Explorer is easy.
- Make sure the New UI is turned ON. It’s at the top of the navigation bar.

- Open Resource Explorer. Select it by Resource Explorer on the left-side navigation panel (your panel may be organized differently).

Understanding Resource Explorer views
Getting into a Resource Explorer dashboard is easy with a few preset views. There are two control areas in Resource Explorer: Filters and Groups.
- Filters will control what data is shown
- Groups control how data is shown
You can type the name of any tag into either area, and typeahead assist will guide you. This includes LogicMonitor properties, cloud tags, custom properties (such as from property sources), and CMDB-enriched tags. Add tags to either control and the system will automatically suggest some tags to help you get started.

In this example, the Cloud IaaS view is filtered to only IaaS resources (virtual machines) from the cloud providers. Choose Resource Type and select to include those you wish.
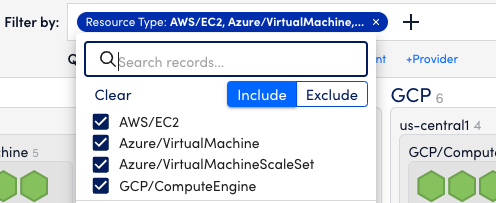
In this example, the views are grouped by the cloud provider, operating region, and resource type. You can drag to reorder those tags if you want them to reflect different things. You can also save your views.

Saving your views
Once you’ve set up the right filters and groups, you can save the views to always be available. The following setup steps only need to be done once.
- Click the top-left of the view where it says Cloud IaaS in the following screenshot (yours will be different) to see the saved views.
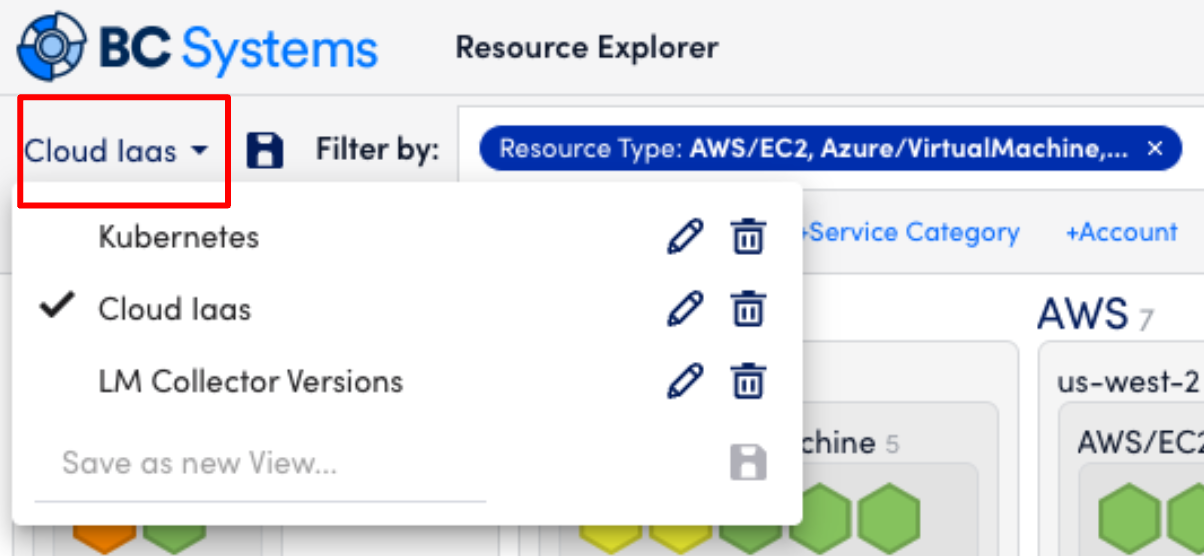
- You can save your own views. Presently, saved views are not shared across users.
Let’s walk through how to make a new saved view.
Making a saved view for all my resources
- “X” out existing filters and groups.
- Save a new view. Do not click the disk icon to the left of the filter; you will overwrite the existing saved view.
- Instead, click the current view name to open the dialog. At the bottom, type in a new name and save it. Name it All Resources.
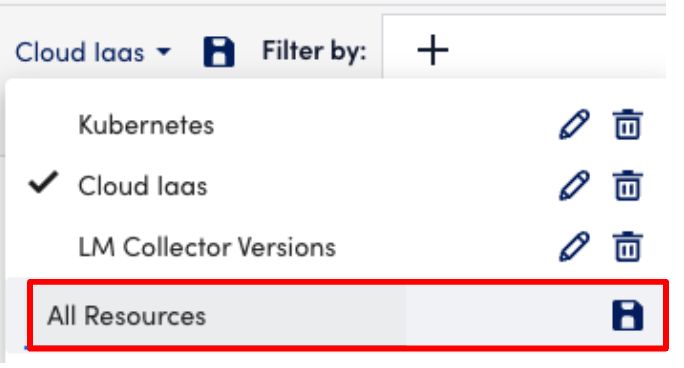
Making a saved view for only resources with active alerts
Maybe you only want to see the alerts that require attention. Are problematic resources all in one place or spread evenly? Different troubleshooting patterns emerge visually.
- Click to turn off the green resources.
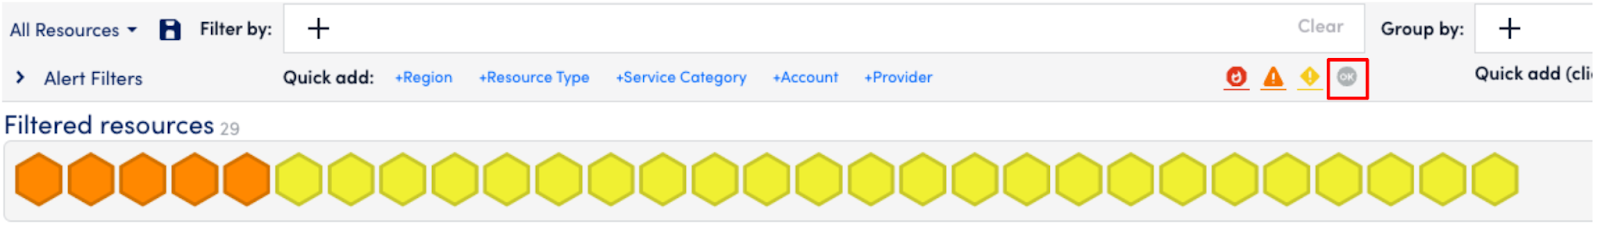
- Save this as another new view (don’t click save yet). Open the All Resources dialog and make a new name at the bottom. Then click the save icon for the new named view.
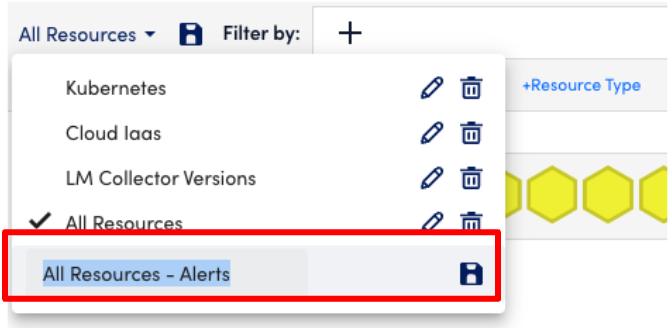
Making a saved view that organizes alerts by the teams that own them
You might have a tag for a department, owner, or something else. Use what you have to create views that matter to you.
- Click in the Group By and add department.
- Save the view like above but as All Resources – Grouped Alerts.
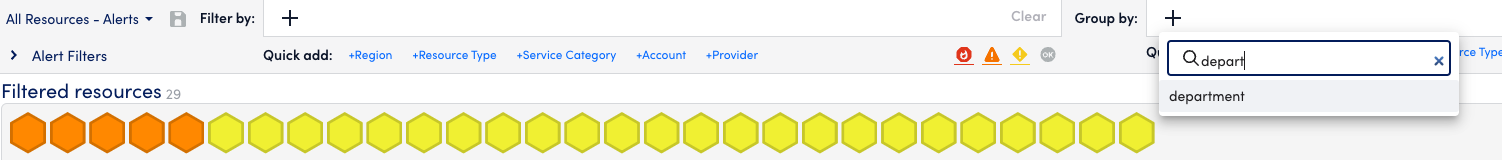
- It should now look like this:
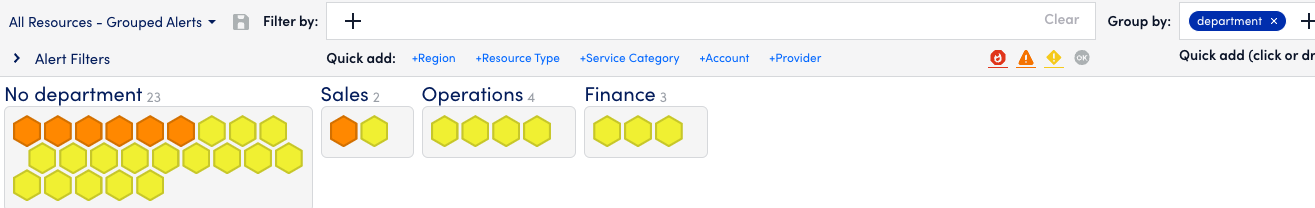
- Edit that view once more by adding Provider to the Grouping.
- Optional: Filter out No Department from the view if you wish.
- Save the view again (you can click the disk directly this time to overwrite).
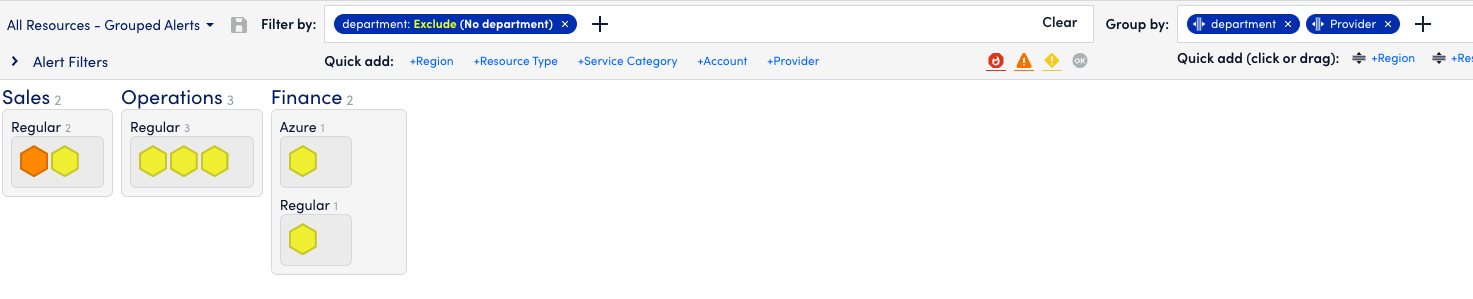
Making a saved view for all my resources, grouped by on-prem vs. cloud
- “X” out all the groups and filters again. Turn on the green resources again.
- On the Group By control, click the Provider choice in the Quick Add section.
- Repeat and add Resource Type.
- Save this as by Provider.
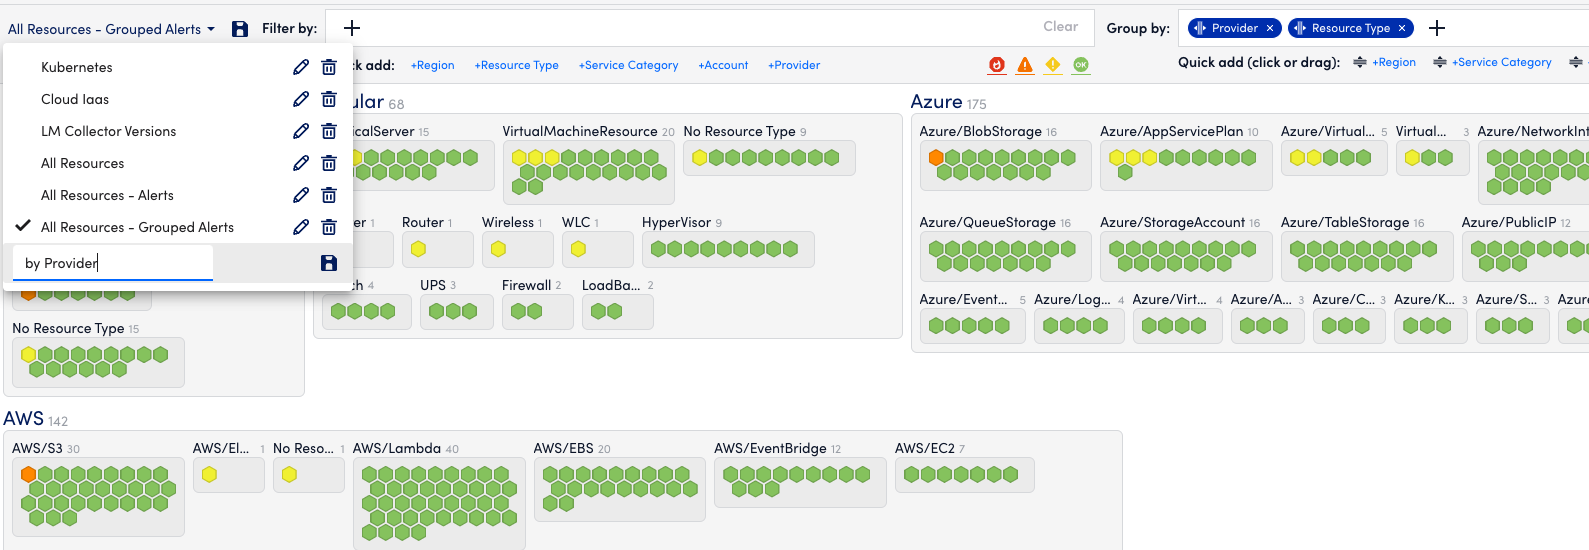
Organize network components by location, type, and model

Resource Explorer can be used to discover networking performance.
With this type of view, you can easily discover how network problems are unfolding.
To get the view above, which organizes your Meraki network components by location, type, and model, you would first filter by “meraki.api.network.name” and ensure that the property exists. Then group by the following:
meraki.api.network.name
Resource Type (which is an alias to multiple normalized tags!)
Auto.meraki.model
auto.os.version.description
Known for its built-in reliability and cross-platform compatibility, FluentD addresses one of the biggest challenges in big data collection—the lack of standardization between collection sources.
With a decentralized ecosystem, FluentD offers a way to seamlessly collect logs from applications on Kubernetes. The free open-source data collector is positioned to support big data as well as unstructured and semi-structured data sets for better usage, understanding, and analysis of your log data.
This post defines FluentD, shows examples of its use in business, and provides tips on how to get started with FluentD in Kubernetes.
What is FluentD?
A cross-platform software project developed for Treasure Data, FluentD, helps solve the challenge of big data log collection. Licensed under Apache License v2.0 and written in Ruby, the program bridges the gap between data collection sources by supporting both Linux and Windows.
FluentD tracks Windows event logs with the latest versions and helps unify the collection and consumption of data, providing a better understanding of how it can be used effectively for business. After logs are read and matched with a tail input plug-in and then sent to Elasticsearch, Cloudwatch, or S3, FluentD can collect, parse, and distribute the log files.
With a seamless sync between Kubernetes, FluentD promotes better monitoring and managing of services and infrastructure. Kubernetes allows you to fine-tune your performance as you look for faults.
Who uses FluentD?
Companies such as Amazon Web Services, Change.org, CyberAgent, DeNA, Drecom, GREE, and GungHo use FluentD for its easy installation and customization with a plugin repository for most use cases. The program offers visualization of metrics, log monitoring, and log collection. Furthermore, as an open-source software project, its community of users is dedicated to making continuous improvements.
How does FluentD log?
FluentD in Kubernetes helps collect log data from data sources using components that compile data from Kubernetes (or another source) to transform logs and then redirect data to give an appropriate data output result. In turn, data output plug-ins help collect and repurpose the data so that log data can be better analyzed and understood.
FluentD architecture
FluentD is designed to be a flexible and light solution with hundreds of plug-in options to support outputs and sources. FluentD in Kubernetes offers a unifying layer between log types. As plug-ins are built and used with FluentD, more ways to analyze application logs, clickstreams, and event logs become available.
You can break FluentD down into several components.
Plugin ecosystem
One of FluentD’s greatest strengths is its extensibility. It has plugins available that allow integrations with most third-party applications (AWS, Azure, Elasticsearch, MySQL, and others). These allow FluentD to collect data, process it in the FluentD engine, and output it to the storage environment of your choice.
There are many types of plugins available to use:
- Input: Collect logs from various sources, including HTTP, REST APIs, and other sources.
- Output: Allow output forwarding to a wide range of destinations, such as SQL databases, cloud services, and other log ingestion services.
- Filtering: Helps custom processing and transformation of log data by removing events, adding fields, and hiding data.
- Parser: Helps FluentD parse data in different formats, such as JSON and CSV.
- Formatting: Allows users to create custom output formats based on their needs or use pre-existing formats.
- Buffer: Used to temporarily store input streams in memory or files.
- Storage: Store FluentD’s internal state in memory, storage, or key-value stores like MongoDB or Redis.
- Service discovery: Helps users extend service discovery to meet their unique needs.
- Metrics: Store FluentD’s internal metrics locally.
Buffering mechanism
FluentD’s buffering mechanism is what allows it to efficiently process large amounts of log data quickly and get data where it needs to go. It needs effective buffering to ensure all data gets processed and nothing gets lost in translation.
It does this with effective processing usage using chunks, memory storage, backpressure mitigation, and retry mechanisms.
- Chunks: Chunks are small groups of records (normally around 2 MB each) created to allow for easier processing.
- Memory: The space FluentD uses to process chunks. It is normally in system memory because of its speed, but it is configurable based on the user’s needs.
- Backpressure mitigation: Process to help high-load environments by limiting the amount of memory used using mem_buffer_limit and file system buffering.
- Retry mechanism: Helps FluentD process failed processing requests and marks a chunk as irrecoverable if it can’t be processed.
Configuration files
FluentD uses a hierarchical file structure to handle system configuration. It uses configuration files that contain directives for input sources, output sources, matching, system directives, and routing.
One of FluentD’s strengths is its dynamic run configuration—you don’t need to reboot the entire system to enforce changes. This allows for easier configuration and testing of new environments.
FluentD also allows for complex routing based on your logs and unique situations. It offers tags and labels in configuration files to help direct output to the right source.
Resource optimization
Environments using FluentD can use a lot of resources—especially when processing large amounts of data or working in resource-constrained environments.
FluentD offers a few solutions to help these situations:
- Fluent Bit: A lightweight log forwarder ideal for edge nodes that connect to cloud infrastructure
- FluentD Forwarder: A stripped-down version of FluentD designed for resource-constrained environments
Why is FluentD important?
FluentD includes a unified logging layer, making logs accessible and usable as they are generated—allowing them to quickly view logs on monitoring platforms like LogicMonitor. On top of that, data sources can be decoupled to iterate data faster, creating avenues for more effective and efficient uses. Here are the top reasons why FluentD in Kubernetes is the best open-source software for data collection:
- Simple to set up and customize with plugins: FluentD features a 10-minute setup time and includes more than 500 plug-ins that support volumes of use-case scenarios.
- Free and open source: FluentD in Kubernetes is available for use without restriction and is flexible enough to meet most company needs.
- Reliability and high performance: More than 5,000 companies already depend on FluentD for its dependable and high-quality data collection results.
- Community support: The FluentD in Kubernetes community offers dedicated support for its growth and development through several resources, including GitHub and StackOverflow discussions, docs, a dedicated Slack channel, Twitter and Facebook pages, and a bug/feature tracker.
- Compatible: FluentD works to standardize and support cross-platform syncing of data for big data compatibility, analysis, and reuse.
Best practices for FluentD
FluentD is rated one of the easiest to maintain and install data collection tools compared to other choices like Scribe and Flume. Regardless of the tool, the goal is to get the fastest and most streamlined data-collecting experience. These best practices cover FluentD’s quick setup, which leads to quick optimization of logs and processing.
Avoid extra computations
FluentD is designed to be simple and easy to use, but adding extra computations to the configuration could make the system less robust, as it may struggle to maintain and read data consistently. It’s typically well-advised to streamline data as much as possible throughout data processing, and FluentD is no different. While FluentD is flexible enough to handle even demanding data requirements, maintaining a simple data-collecting system is best.
Use multi-process input plugins
If you find that your CPU is overloading, try a multi-process. Multi-process input plug-ins allow the spin-off of multiple processes with additional configuration requirements. While multiple child processes take time to set up, they help prevent CPU overload and bottlenecks of incoming FluentD records.
Reduce memory usage with Ruby GC parameters
Ruby GC parameters tune performance and configure parameters. RUBY_GC_HEAP_OLDOBJECT_LIMIT_FACTOR lowers values and improves memory usage (default is 2.0).
How does FluentD in Kubernetes work?
FluentD is deployed in Kubernetes as a DaemonSet so that each node has one pod. As a result, logs are collected from K8s clusters and can be read from the appropriate directories created for Kubernetes. In addition, logs can be scrapped, converted to structured JSON data, and pushed to Elasticsearch via the tail input plug-in.
FluentD in Kubernetes + LogicMonitor
FluentD allows the analysis of a myriad of logs regardless of the organization. The program’s flexibility and seamless cross-platform compatibility offer superb communication of real-time data analysis without the danger of integrating bad data or experiencing the torture of a slowdown.
LogicMonitor is determined to provide effective solutions for teams using FluentD for logging.
LogicMonitor’s Envision platform offers a comprehensive hybrid observability solution for organizations that need help monitoring hybrid environments. Its integration with FluentD will allow your organization to unlock FluentD’s potential and take advantage of everything it can offer.
Contact LogicMonitor to learn more about our Log Analysis today!