Achieve Greater Network Visibility with LogicMonitor and Cisco SD-WAN
SD-WAN not only provides intelligent routing benefits, it allows IT managers to deploy internet-connectivity quickly, reliably, and securely. Learn more!
SD-WAN (Software-Defined Wide Area Networking) centralizes and automates the configuration of network devices and how they route traffic. This is increasingly important as not all network traffic is created equal; there are specific business-critical applications that are relied on more heavily than others. In addition to intelligent routing benefits, SD-WAN also allows IT managers to deploy internet-connectivity quickly, reliability, and securely.
As one of the most requested integration requests from our global enterprise and MSP customers, LogicMonitor has always focused on building the most extensive monitoring coverage within the Cisco portfolio. With our continued expansion of Cisco SD-WAN, we have cemented our partnership even further.
LogicMonitor customers will now have greater visibility in their networks, an immediate view of how their network is affecting service delivery, and drastically reduced alert noise with LogicMonitor’s advanced intelligence capability.
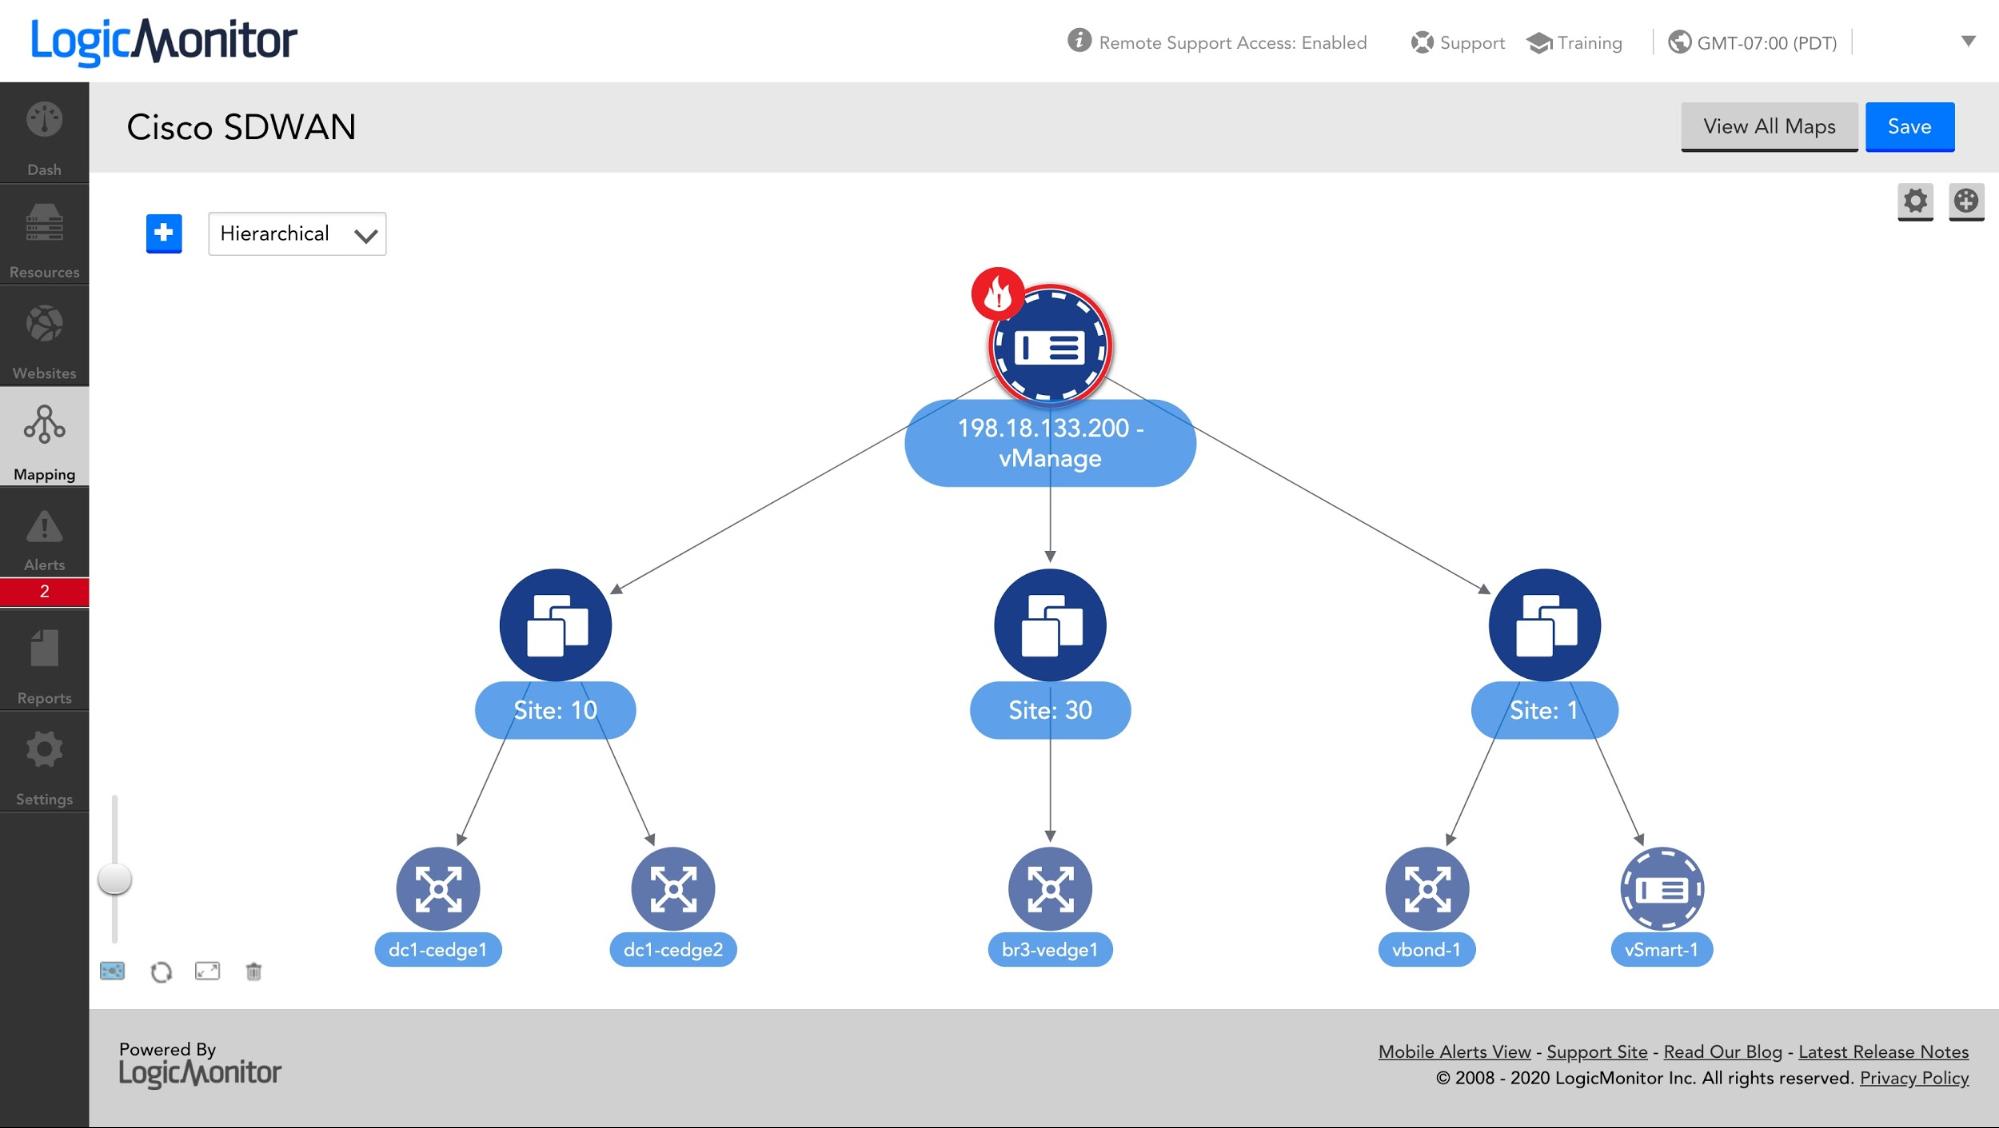
Map Topology of vManage Environments
vManage is the console to manage and configure Viptela devices. LogicMonitor collects metrics from vManage and the configured devices.
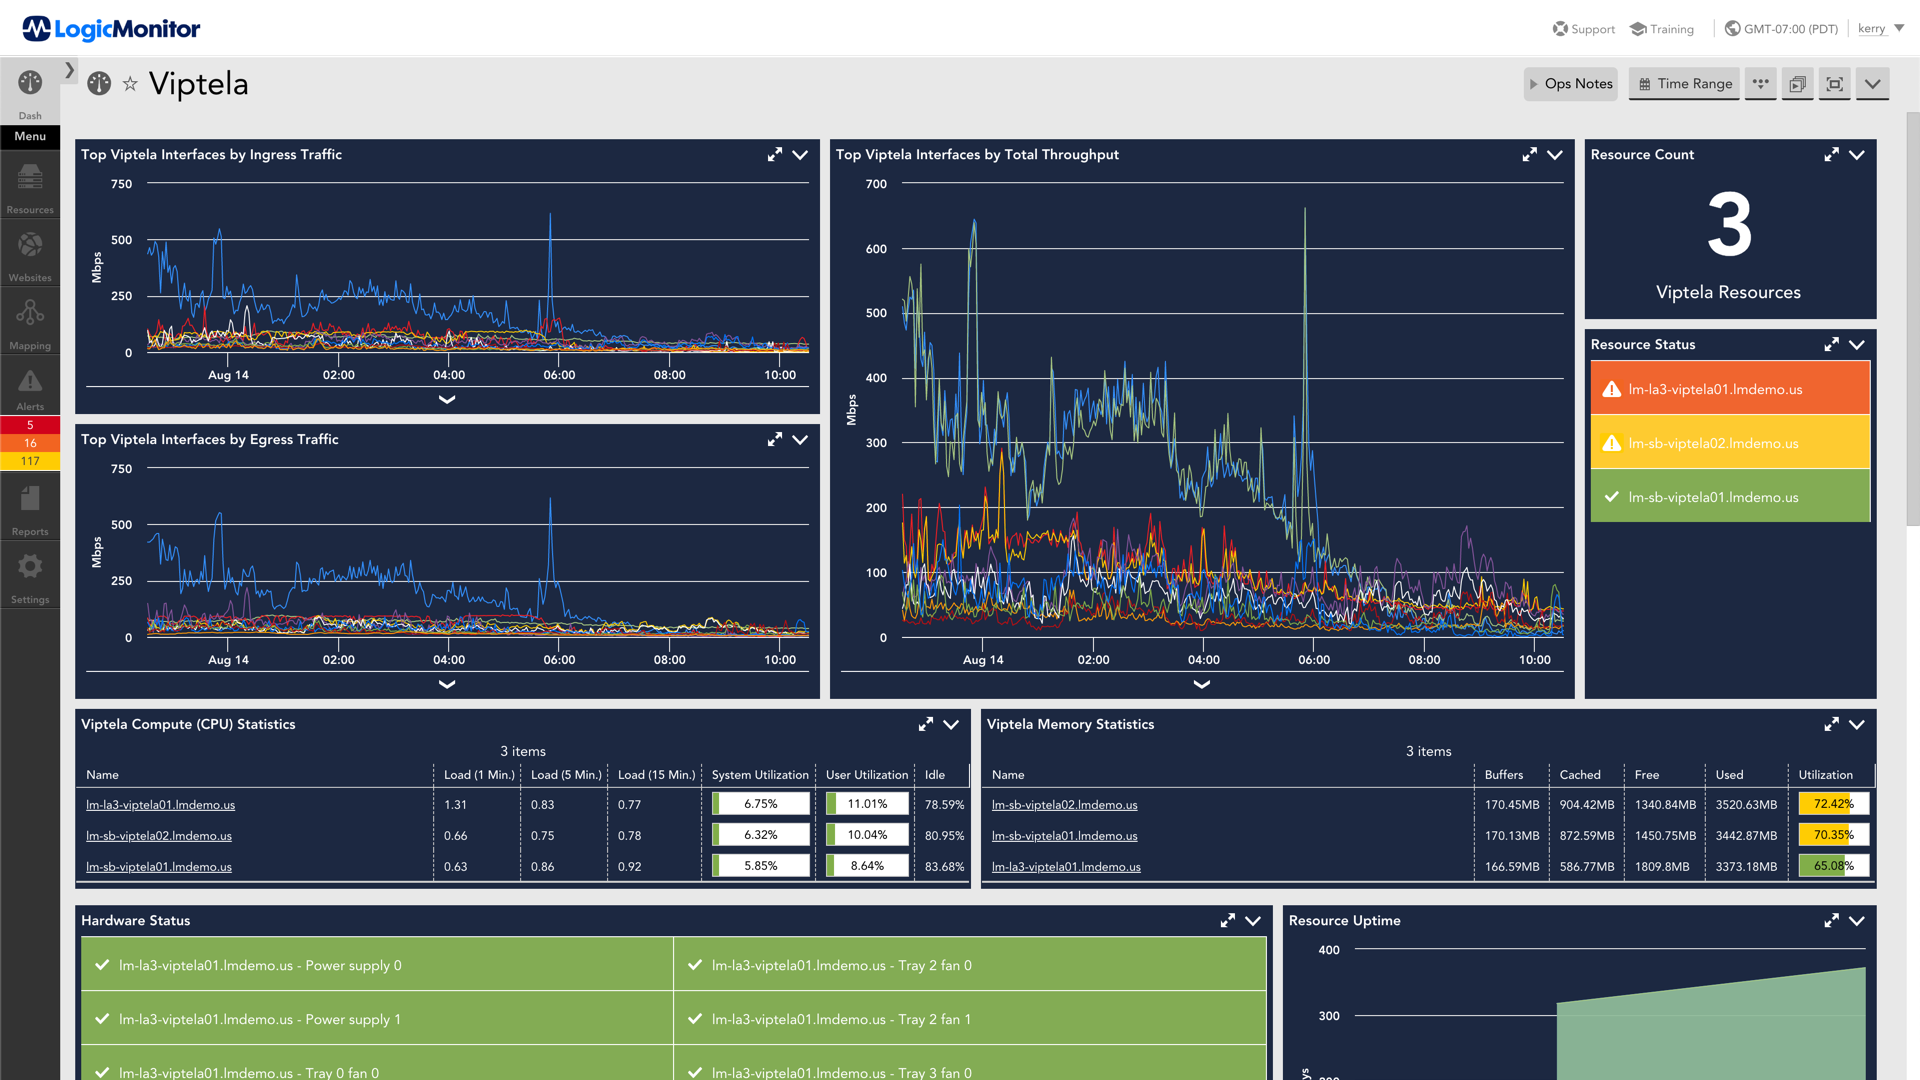
View Health and Performance Across Viptela
Viptela is typically chosen by larger companies with more complex hybrid network architecture because of the more granular networking approach. Aside from the data collected from the API, LogicMonitor collects additional metrics via SNMP. All of the Viptela components are monitored out of the box: vSmart controller, vEdge routers, vBond Orchestrator, and vManage.
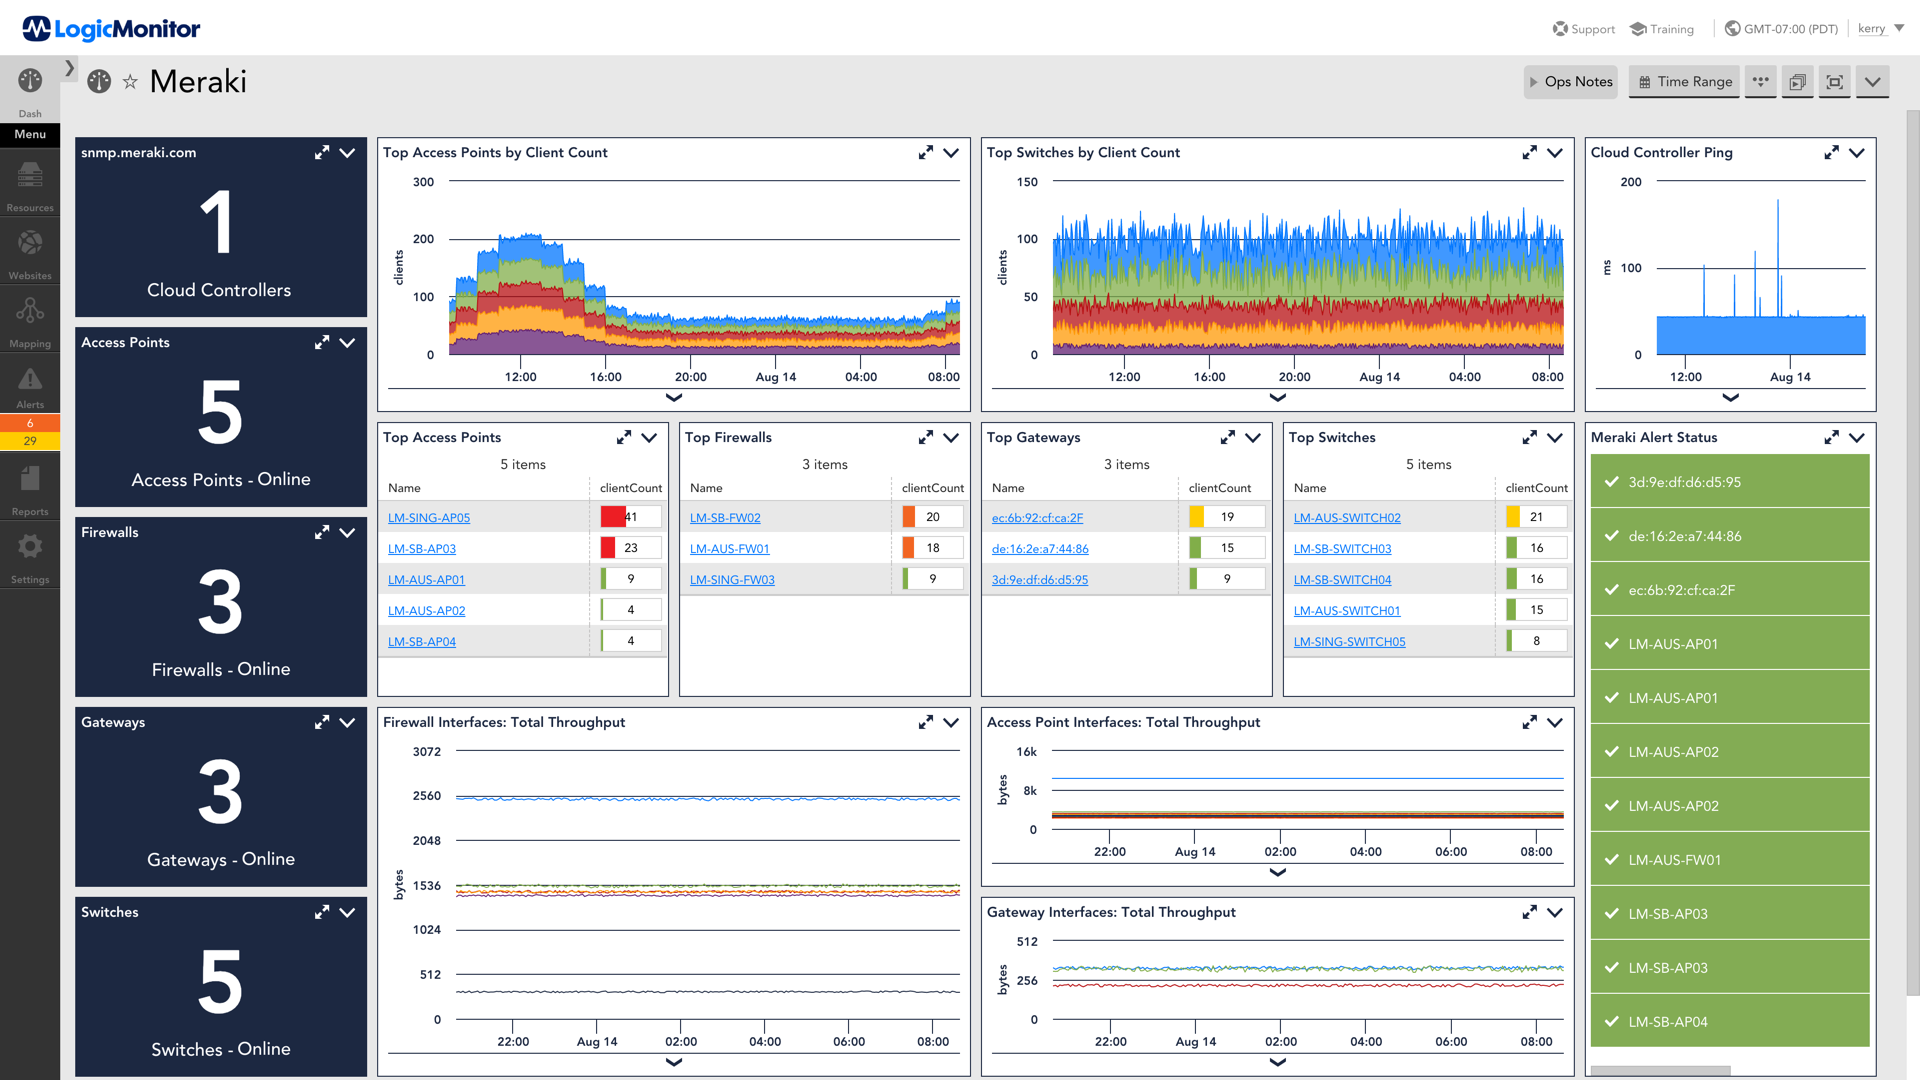
View Health and Performance Across Meraki Access Points
Meraki is favored in small to medium businesses since it is easier to set up and requires fewer people to manage. The list of supported Meraki device types are access points (MR), cloud-managed access points, security appliances (MX), switches (MS), and teleworker gateways (Z). The data is collected via SNMP.
If you have any questions regarding these new monitoring integrations, please reach out or contact your CSM for more information. Or you can try LogicMonitor for free.