What are discovery filters?
Datasource Instance Filters control what objects are allowed to populate as instances on a device level. These filters are used to retain the desired alerting and data collection, but prevents LogicMonitor from creating alerts on non-critical infrastructure. From every object discovered by Active Discovery, only objects that satisfy the filter criteria will be added into monitoring. Filters can be found in the Active Discovery section of multi-instance Datasource definitions.
Use Case: WMI instance filtering
It is a common practice to reconfigure existing non Active Discovery datasources and apply them automatically to multiple devices. The WinServices- datasource is often cloned and edited to be Active Discovery enabled and used to selectively monitor certain Windows services. For example, filtering can be used to monitor all services containing “Windows” in the name and that are set to automatically start.
Consider the output of the WMI query used for this class. Here is the beginning of a very long list of services, obtained from a test device, by calling the win32_service class:
$ !wmi h=10.37.13.177 select * from win32_service
>>>>>>>
SYSTEMCREATIONCLASSNAME=>Win32_ComputerSystem
STATE=>Stopped
STATUS=>OK
DESCRIPTION=>Adobe Acrobat Updater keeps your Adobe software up to date.
STARTED=>false
STARTMODE=>Disabled
ACCEPTSTOP=>false
DISPLAYNAME=>Adobe Acrobat Update Service
DESKTOPINTERACT=>false
TAGID=>0
EXITCODE=>1077
CREATIONCLASSNAME=>Win32_Service
NAME=>AdobeARMservice
WAITHINT=>0
STARTNAME=>LocalSystem
PATHNAME=>"C:\Program Files (x86)\Common Files\Adobe\ARM\1.0\armsvc.exe"
INSTALLDATE=>
CHECKPOINT=>0
SERVICESPECIFICEXITCODE=>0
ACCEPTPAUSE=>false
CAPTION=>Adobe Acrobat Update Service
PROCESSID=>0
SYSTEMNAME=>WIN-DOES
SERVICETYPE=>Own Process
ERRORCONTROL=>
Since all services will display the same class attributes regardless of actual value, they can be used in a filter to monitor only those services that are relevant.
|
Attribute |
Operation |
Value |
Comment |
|
DISPLAYNAME |
Contain |
Windows |
Only services containing ‘Windows’ in the display name |
|
STARTMODE |
RegexMatch |
Auto |
Only services set to automatically start |
Please note that each additional filter line is evaluated with the logical AND operator; a potential instance must satisfy both requirements here.
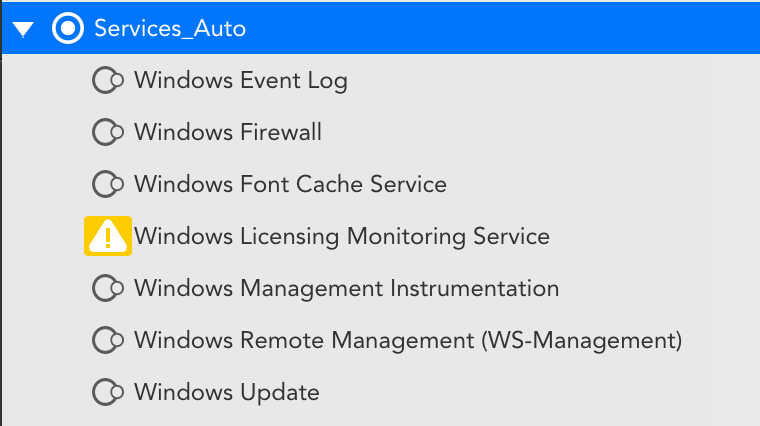
This filters out the services by display name, and leaves us with those we want:
Use Case: Script instance filtering
The same method can apply to datasources that outputs instances in a different format. For example, the recently released VMware_vSphere_VMsnapshots. This datasource performs discovery through an embedded Groovy script, which will create and apply Instance Level Properties:
// Get props/ILP
def props_hash = ['auto.config.alternate_guest_os_Name': vm?.config?.alternateGuestName,
'auto.config.annotation' : vm?.config?.annotation,
'auto.config.firmware' : vm?.config?.firmware,
'auto.config.guest_os_full_Name' : vm?.config?.guestFullName,
'auto.config.guest_os_id' : vm?.config?.guestId,
'auto.config.managed_by' : vm?.config?.managedBy?.type ?: "false",
'auto.config.modified' : vm?.config?.modified?.getTime(),
'auto.config.template' : vm?.config?.template,
'auto.guest.guest_os_family' : vm?.guest?.guestFamily,
'auto.guest.guest_os_full_name' : vm?.guest?.guestFullName,
'auto.guest.guest_os_id' : vm?.guest?.guestId,
'auto.guest.hostname' : vm?.guest?.hostName,
'auto.guest.tools_version' : vm?.guest?.toolsVersion,
'auto.guest.tools_version_status' : vm?.guest?.toolsVersionStatus2,
'auto.hardware.memory_mb' : vm?.config?.hardware?.memoryMB ?: 0,
'auto.hardware.num_cpu' : vm?.config?.hardware?.numCPU ?: 0,
'auto.hardware.num_cores_per_socket' : vm?.config?.hardware?.numCoresPerSocket ?: 0,
'auto.hardware.num_virtual_disks' : vm?.summary?.config?.numVirtualDisks ?: 0,
'auto.hardware.num_ethernet_cards' : vm?.summary?.config?.numEthernetCards ?: 0,
'auto.resource_pool' : vm?.resourcePool?.name,
'auto.resource_pool_full_path' : resource_pool_array.reverse().join(' -> '),
'auto.snapshot_count' : vm?.layoutEx?.snapshot?.size() ?: 0,
'auto.cluster' : esxhost?.parent?.name,
'auto.cluster_full_path' : cluster_path_array.reverse().join(' -> '),
'auto.runtime.host' : esxhost?.name,
'auto.runtime.connection_state' : vm?.runtime?.connectionState,
'auto.runtime.power_state' : vm?.runtime?.powerState]
For reference, here is what the ILPs look like for an instance before filtering is applied. 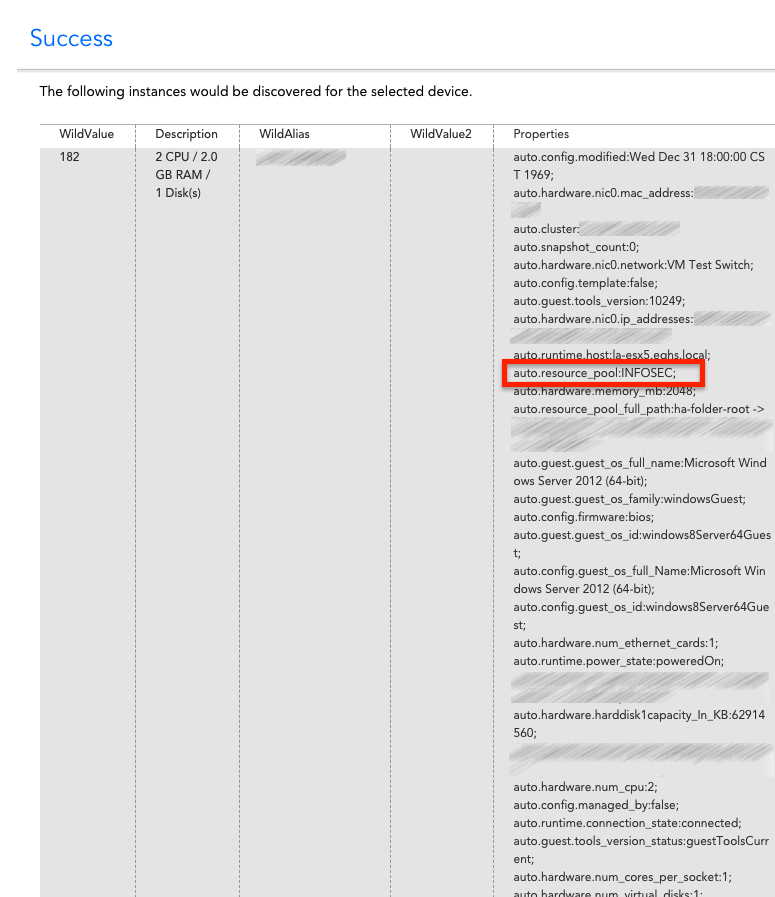
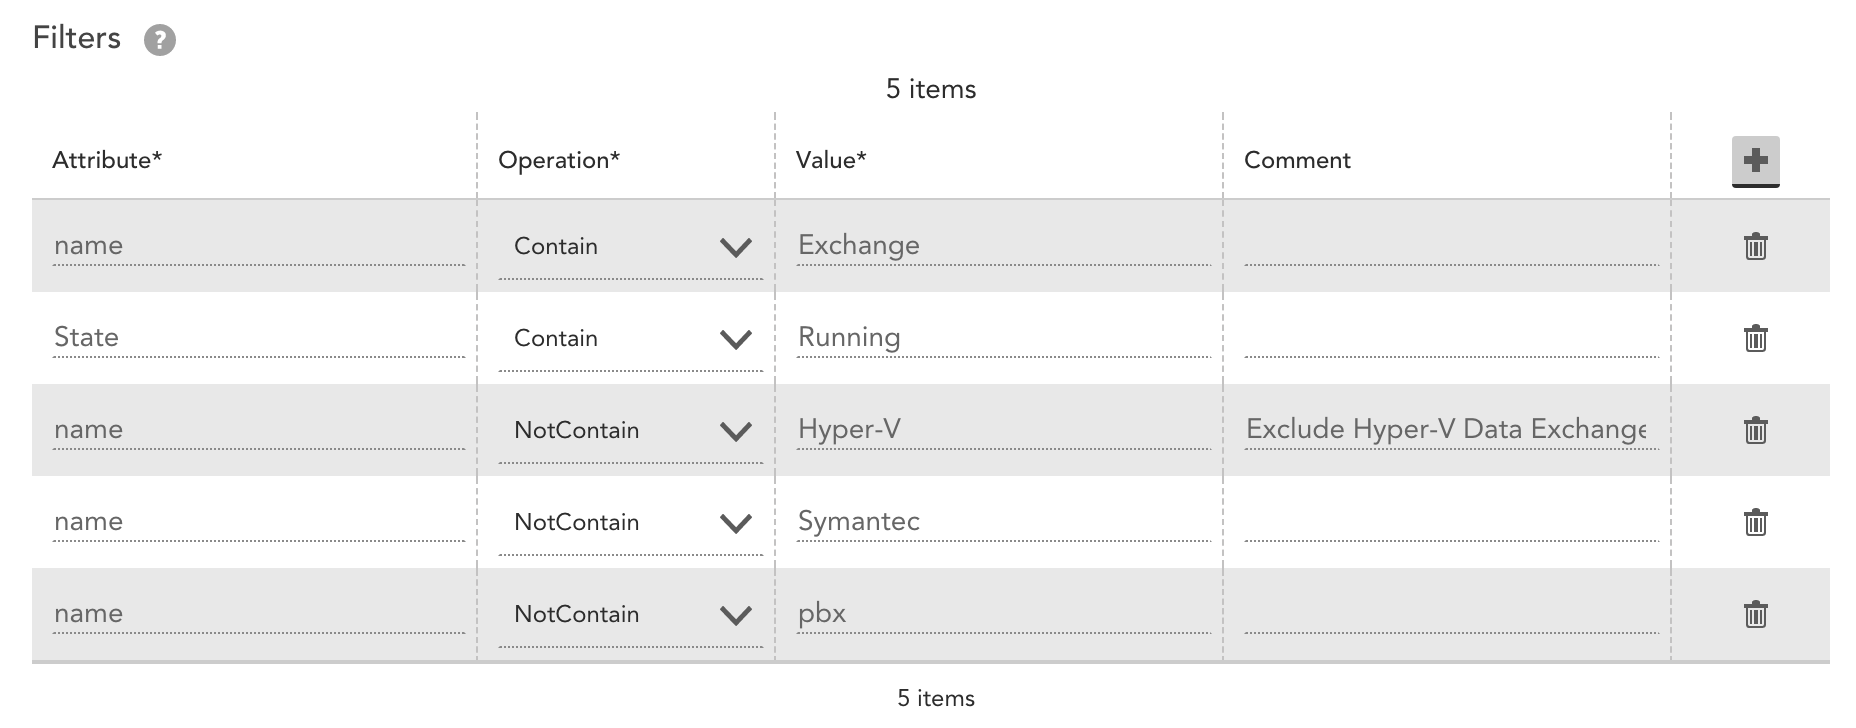
Since each of these Instance Level Properties are provided with each instance that is discovered, LogicMonitor can call these properties using filters. As an example use case: “A customer was interested in excluding Virtual Machines from two lab resource pools. Since this customer was not interested in the alarms that were generated and did not want to collect data from the test environments.
|
Attribute |
Operation |
Value |
Comment |
|
auto.resource_pool |
RegexNotMatch |
INFOSEC |
Excludes any instance with a resource pool name of either of these two labs |
Use Case: Troubleshooting SNMP filtering
Sometimes a default filter can create confusion to a customer expecting an instance but not seeing it. For example, our
| Attribute |
Operation |
Value |
Comment |
| .1.3.6.1.4.1.789.1.5.4.1.2 |
RegexMatch |
\.snapshot|\.\. |
Volume name contains snapshot, or “..” if no snapdir is set. |
| .1.3.6.1.4.1.789.1.5.4.1.15 |
NotEqual |
0 |
Ignore volumes of zero size. |
| .1.3.6.1.4.1.789.1.5.4.1.2 |
Contain |
/vol/ |
Include volumes only (not aggregates) |
A common scenario is only seeing one snap volume displayed, when more are expected. Using the SNMP OID set on the datasource definition, perform a manual walk to get the full list of instances:
$ !snmpwalk SOMEHOST .1.3.6.1.4.1.789.1.5.4.1.2
Walking OID .1.3.6.1.4.1.789.1.5.4.1.2 from host=SOMEHOST, version=v2c, port=161, timeout=3 seconds:
1 => aggr2
10 => /vol/cache1img3/.snapshot
11 => /vol/cache1img4/
12 => /vol/cache1img4/.snapshot
13 => /vol/cache1img5/
14 => /vol/cache1img5/.snapshot
15 => /vol/cache1img6/
16 => /vol/cache1img6/.snapshot
17 => /vol/cache1img7/
18 => /vol/cache1img7/.snapshot
19 => /vol/cache1img8/
2 => aggr2/.snapshot
20 => /vol/cache1img8/.snapshot
21 => /vol/cachepreprod/
22 => /vol/cachepreprod/.snapshot
23 => /vol/cache1imgtest/
24 => /vol/cache1imgtest/.snapshot
3 => /vol/new_root/
4 => /vol/new_root/.snapshot
5 => /vol/cache1img1/
6 => /vol/cache1img1/.snapshot
7 => /vol/cache1img2/
8 => /vol/cache1img2/.snapshot
9 => /vol/cache1img3/
© LogicMonitor 2026 | All rights reserved. | All trademarks, trade names, service marks, and logos referenced herein belong to their respective companies.