An Introduction to Dynamic Topology with LogicMonitor
Explore how dynamic topology helps teams troubleshoot faster, see dependencies clearly, and replace static maps with live, always-updated infrastructure views.
Modern infrastructure is anything but static. Between hybrid clouds, containerized apps, and changing service layers, it’s hard to know what’s connected to what or what crashes when something goes down.
That’s where dynamic topology comes in. Instead of relying on static diagrams, it maps your infrastructure relationships in real time. This way, IT teams can visualize dependencies and maintain service continuity across complex, distributed environments.
In this guide, we’ll break down how dynamic topology works, what to look for in a solution, and where it delivers the most value in daily operations.
TLDR
Dynamic topology gives IT teams a live view of how infrastructure connects so you can troubleshoot faster and operate with confidence.
Static diagrams fall short in hybrid infrastructure.
Dynamic topology continuously maps real-time relationships across systems and services.
Auto-discovery and customizable views reduce alert noise and guesswork.
Live topology helps respond to incidents faster and manage change smartly.
What Is Dynamic Topology (And Why It Matters)
Dynamic topology automatically discovers devices, services, and their relationships across your infrastructure. As resources scale or spin up temporarily, the map updates in real time, giving you full visibility without manual effort.
Apart from showing what’s connected, dynamic topology helps understand how systems interact:
Which switch sits upstream from that alerting server?
How does a failed VM ripple through the storage or application layer?
What’s the fastest path to trace a dependency chain?
Dynamic network maps answer these questions instantly without you having to jump across dashboards. Compared to static mapping, this real-time infrastructure mapping reduces errors and gives clear insights into what’s really happening in your hybrid or distributed environments.
Static maps show you what your network looked like. Dynamic topology shows you what’s happening right now.
Where It Delivers the Most Value (Use Cases)
The idea of dynamic topology isn’t limited to one field. It’s a flexible concept that can be applied across multiple fields. So let’s see major areas where it really pays off:
Incident response: When a security incident happens, you need to quickly see what else is impacted. A live topology map shows upstream/downstream relationships in real time to help teams identify the root cause without bouncing across dashboards.
Change management: When you roll out a new service or update, dynamic topology lets you see what’s connected and what could be affected. That clarity reduces risk and makes change planning smoother.
Onboarding and training: Instead of parsing outdated documentation, new team members can explore live infrastructure maps to understand system layout and dependencies.
Audit and compliance: A live topology map shows how data moves through your environment without the overhead of manual diagrams.
In hybrid and distributed infrastructures, dynamic topology gives teams the visibility and confidence they need to reduce downtime and maintain control.
Discover how Bachem leverages DynamicTopology Mapping to reduce their number of alerts.
No two IT environments look alike so your topology tool needs to adapt. The best dynamic topology solutions give you control over what’s mapped, how it’s visualized, and how much context is layered onto each view.
So if you’re planning to invest in one, here are key capabilities to look for:
Custom mapping filters: Good tools let you focus your view such as isolating Layer 2 devices, filtering by alert severity, or hiding inactive resources. That way, you can cut through the noise.
Real-time auto-discovery: Core components including switches, servers, virtual machines, and containers should be mapped automatically as they scale.
Layout customization: Being able to rearrange maps or organize them by network segment or resource type helps stay oriented and respond faster.
On-demand map generation: In a live incident, having the ability to generate a topology map instantly based on an alert saves time and reduces context-switching.
Dashboard and reporting integration: Embedding live topology maps into dashboards means you can monitor critical services in context, and leadership can access a high-level view without chasing down static diagrams.
How to Keep Your Topology Fast and Scalable
Dynamic topology delivers visibility, but like any real-time system, it needs thoughtful implementation to stay efficient in large, distributed environments. And here’s how you can achieve this:
Start with scope. The more resources you monitor, the more relationships the topology engine has to track. That doesn’t mean limiting visibility but it does mean focusing your views on what matters. Narrow the lens to a specific service, network segment, or region to avoid unnecessary load.
You may also see slight performance spikes during initial discovery or large-scale changes. That’s expected. LogicMonitor batches and optimizes these updates in the background, but it’s helpful to know when extra activity is normal.
For daily use, don’t rely on on-demand maps as your primary dashboard. They’re great for real-time troubleshooting, but saved maps or embedded views are more efficient for ongoing visibility.
How LogicMonitor’s Dynamic Topology Mapping Works
LogicMonitor’s dynamic topology uses an additive approach. It surfaces only the relationships and context that matter for what you’re looking at. No clutter. No guesswork.
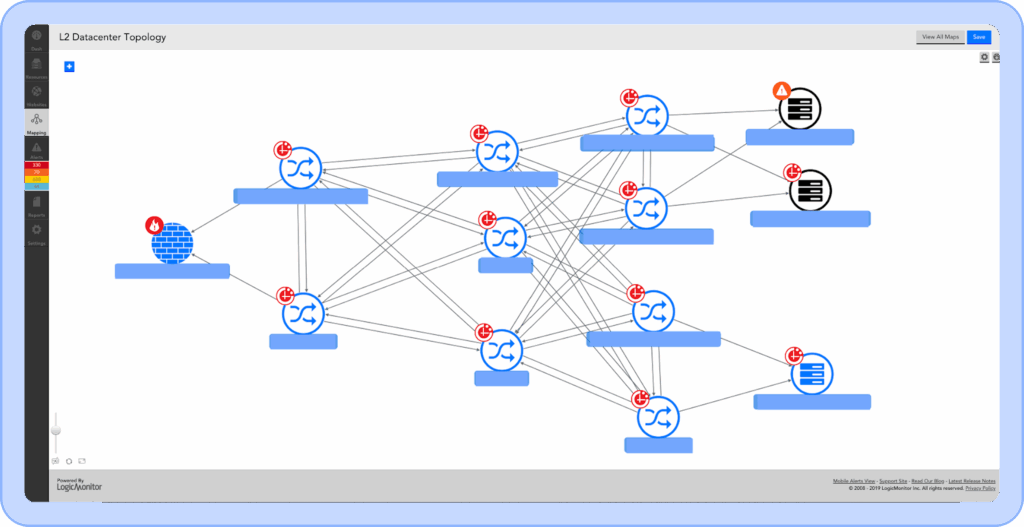
Layer 2 network topology map.
At the core of this is TopologySource, a LogicModule that automatically discovers and connects resources already under monitoring. For network infrastructure, that means built-in support for Cisco Discovery Protocol (CDP) and Link Layer Discovery Protocol (LLDP) enabled devices. Using device IDs reported through those protocols, LogicMonitor maps out switches, routers, firewalls, and hosts by matching them to their connected neighbors.
This coverage focuses on Layer 2 topology, using MAC addresses to trace relationships. But, we’re expanding to include Layer 3 paths and SAN infrastructure to offer even broader visibility.
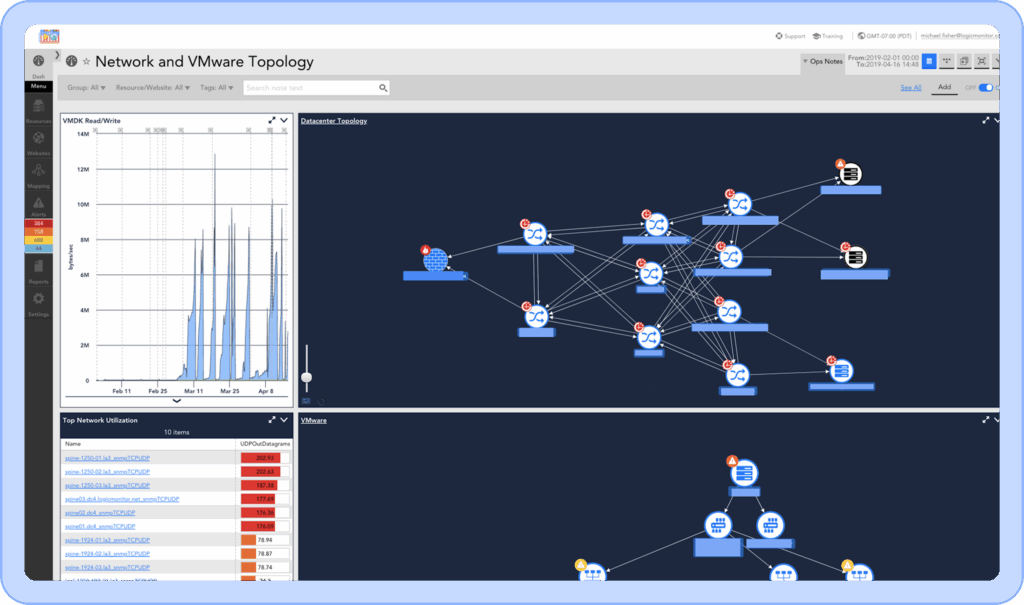
For compute infrastructure, we offer TopologySource coverage for VMWare, Linux, and Windows hosts. Once deployed, you can trace the path from core switches through distribution and access switches, all the way down to the edge computer, or VM. Our TopologySources leverage the vCenter API to determine these relationships automatically.
But this isn’t just about drawing lines between boxes. It’s interactive and fully integrated into your IT monitoring workflow. This means, you can:
Save and share maps so everyone’s on the same page
The payoff? You replace outdated, static diagrams with live maps that reflect your environment in real time. That means you can now troubleshoot issues faster and spend way less time to trace things manually.
Topology dashboard widget.
The topology data we’re capturing today will soon power additional AIOps features like alert suppression based on dependencies and smarter alert grouping. So your team can focus on what’s important without drowning in noise.
Disclaimer: The views expressed on this blog are those of the author and do not necessarily reflect the views of LogicMonitor or its affiliates.