Bring your collector for streaming telemetry data from your environment to LogicMonitor’s hybrid and multi cloud monitoring platform. Learn more about LM Exporter.
We recently introduced the LogicMonitor Exporter which is now a part of OpenTelelemetry Collector Contrib distro. This allows you to bring your collector for streaming telemetry data from your environment to LM Envision, LogicMonitor’s hybrid and multi-cloud monitoring platform. LogicMonitor associates the exported logs and traces from a single OpenTelemetry collector to simplify your application’s operations and troubleshoot issues.
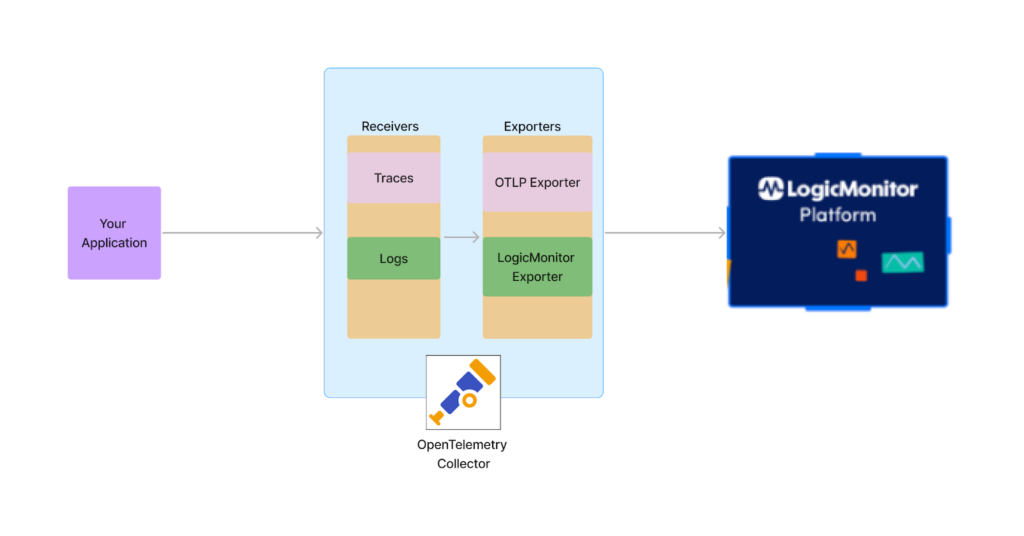
The following image illustrates the log and traces ingestion process using a single LogicMonitor exporter into the OpenTelemetry collector:
Benefits of using OpenTelemetry Collector
Broad coverage of log receivers from different sources: Different receivers from the OpenTelemetry collector can be used for the log collection from different log sources.
Manage your own OpenTelemetry distribution: You can create different distributions of OpenTelemetry collectors as per your needs. OpenTelemetry collector also supports creating builds for other operating systems and creating container images with different architectures.
Easy deployment: Using the helm chart, the collector can be deployed in different modes like a sidecar, daemon sets, and deployment.
Telemetry interoperability: Receivers for different trace providers can be used to convert the traces from vendor-specific format to OpenTelemetry format. Then, that data can be ingested into LM Envision.
Configuring the LogicMonitor Collector Fields
You can update the following fields to the location where you want to send the logs:
Field
Default
Description
endpoint
required
The target base URL to send data to (For example, https://<company_name>.logicmonitor.com/rest).
For bearer token-based ingestion, use the configuration header Authorization: Bearer <bearer token of logicmonitor>
Example of using the OpenTelemetry Collector to ingest logs and traces data
Now that we’ve reviewed the benefits and the necessary configurations for OpenTelemetry collectors, let’s look at an example of how to ingest logs data into the LogicMonitor platform using the OpenTelemetry collector. You can use LMv1 or bearer API token for authentication. The below code snippet displays an example of the configuration file:
The release of the LogicMonitor Exporter in the OpenTelemetry Contrib Distro reflects our commitment to OpenTelemetry and Cloud native technologies. Now that the LogicMonitor Exporter is in OpenTelemetry Contrib Distro, the OpenTelemetry collector can also be used to ingest the traces and logs into LM Envision. This expands the scope for using different trace providers like Azure and AWS X-Ray and log vendors like Cloudwatch, Kafka, and Syslog.