

Over the past two years, we have been on a journey to provide the tools you need in order to achieve unified, end-to-end observability in real-time across your entire business. We believe that true observability gives you the confidence to embark on your cloud and digital transformation initiatives. LM APM empowers ITOps and DevOps teams with the context they need to continue delivering quality user experiences while seamlessly correlating all of this data in one easy-to-use platform. Ultimately, we want to guide you to not only understand the underlying infrastructure but also the applications running on it and how they affect your overall business.
During our Lighthouse program, we onboarded 70+ of our customers across different industries – giving them early access to our newest capabilities and gathering feedback on product usage, hearing success stories, and learning where they need the most help. Now, we’re ready to give our customers a general access to this incredible new suite of tools.
LogicMonitor Customers Now Have Access To
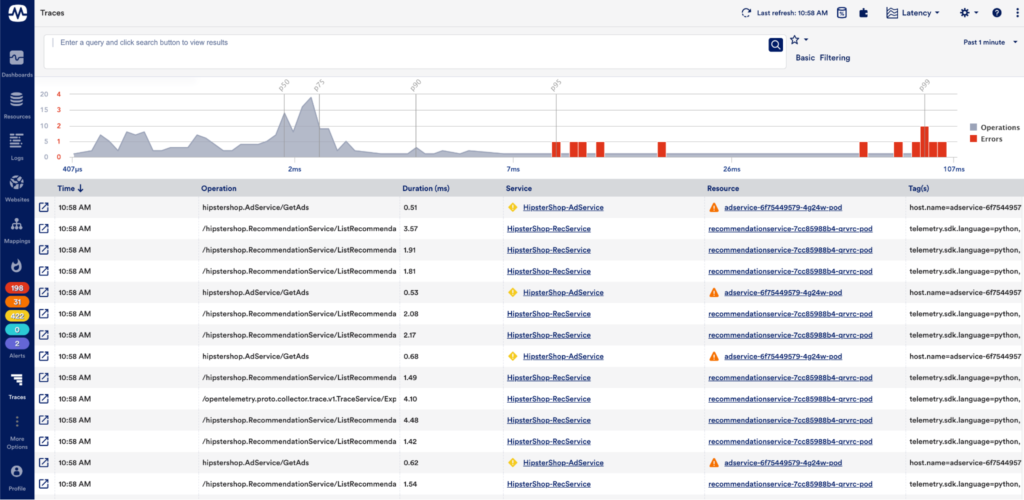
OpenTelemetry-Compatible Distributed Tracing
You can now measure the latency, throughput, and error rate of application traces using OpenTelemetry, and correlate them with logs and the rest of an organization’s application infrastructure, including cloud, Kubernetes, and networks.
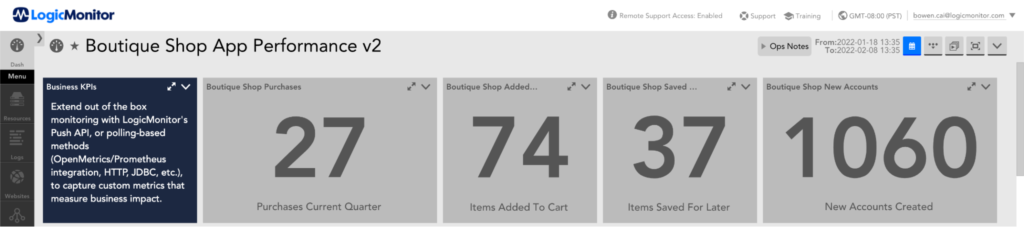
Push Metrics and OpenMetrics
You can now send custom metrics directly into LogicMonitor via our new Push Metrics API or SDK without having to poll metrics from a Collector. This powerful capability helps you to create a more holistic picture of how IT is supporting business outcomes by supplementing business KPI’s into your traditional IT performance dashboards. We have also simplified the creation of OpenMetrics DataSources in LogicMonitor with our new OpenMetrics Wizard, allowing you to bulk-add metrics from an OpenMetrics endpoint.
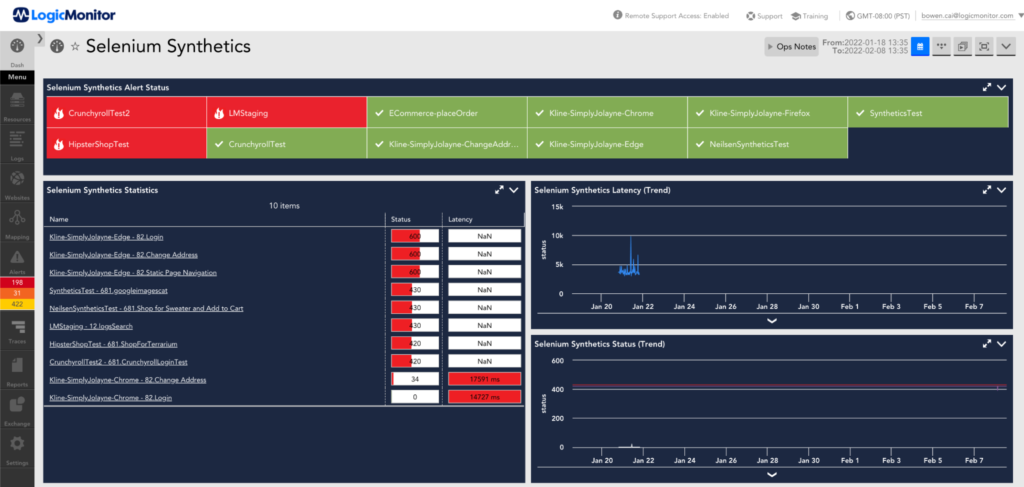
Selenium-Based Synthetics With Multi-Factor Authentication
Synthetics are recordings (typically with manually-created scripts) that simulate a critical end-user pathway or interaction on a website or web application. With our Synthetics capabilities, you can create complex Synthetic transactions to monitor end-user experience without the need to write custom code. Synthetics monitoring leverages Selenium—a trusted open-source browser automation and scripting tool to send Synthetics data to LogicMonitor. LogicMonitor Synthetics also supports multi-factor authentication (MFA) to test privileged and critical workflows.
Here’s How It All Comes Together
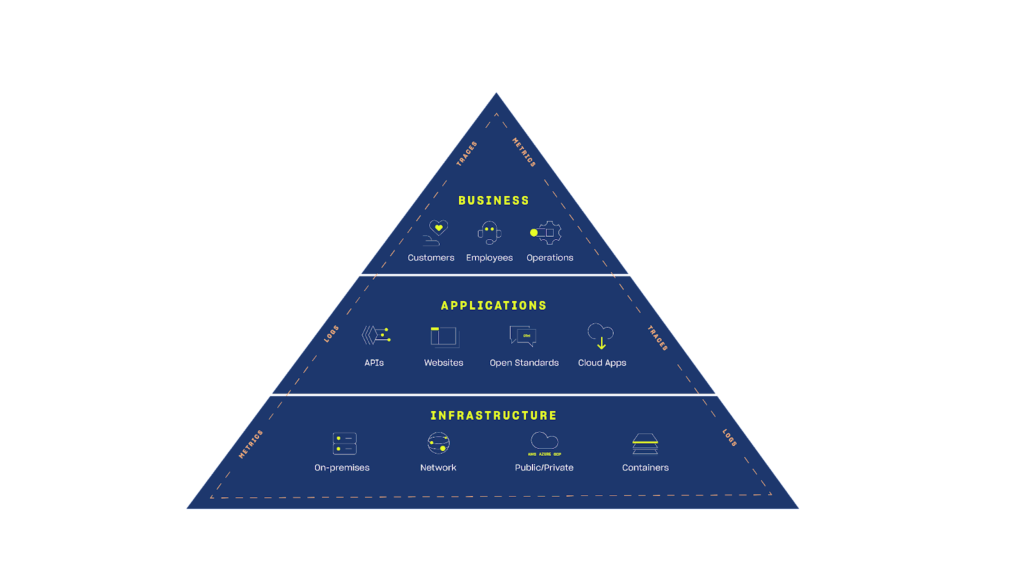
The LM Observability Platform Now Has Full Coverage Across All Aspects of Your IT Landscape
- Comprehensive monitoring across all of your hybrid, multi-cloud infrastructure including servers, VMs, cloud (IaaS, PaaS), or container with our industry-leading Infrastructure, Cloud, and Container solutions.
- Business-critical SaaS applications (like O365, Zoom, or Salesforce) that you depend on to measure availability and employee productivity can be added and monitored via our Cloud Exchange.
- When issues arise, our AIOps Early Warning System helps users prevent issues within their applications and infrastructure before they cause business disruption.
- While investigating potential issues, you can also analyze and automatically detect sophisticated anomalies in applications and infrastructures that may drive future disruption through LM Logs.
- Development teams can monitor, identify and resolve code-level performance errors and bottlenecks in their web and mobile applications with Airbrake.
Get Started Today
LogicMonitor APM is now generally available to our customers. Hybrid Observability Powered by AI is core to our mission at LogicMonitor and we believe that this will become even more important as businesses continue on their digital transformation journeys. To get started, connect with your customer success manager or sign-up here for a free trial.


