
AWS (Amazon Web Services) releases new products at an astounding rate, making it hard for users to keep up with best practices and use cases for those services. For IT teams, the risk is that they will miss out on the release of AWS services that can improve business operations, save them money, and optimize IT performance.
Let’s revisit a particularly underutilized service. Amazon’s T2 instance types are not new, but they can seem complicated to someone who is not intimately familiar. In the words of Amazon, “T2 instances are for workloads that don’t use the full CPU often or consistently, but occasionally need to burst to higher CPU performance.” This definition seems vague, though.
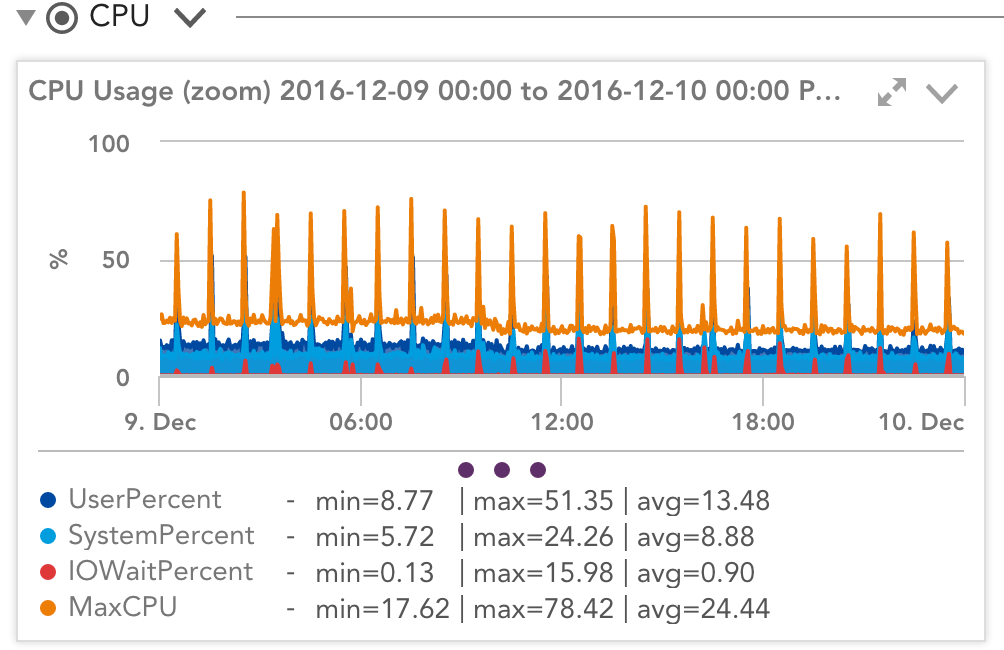
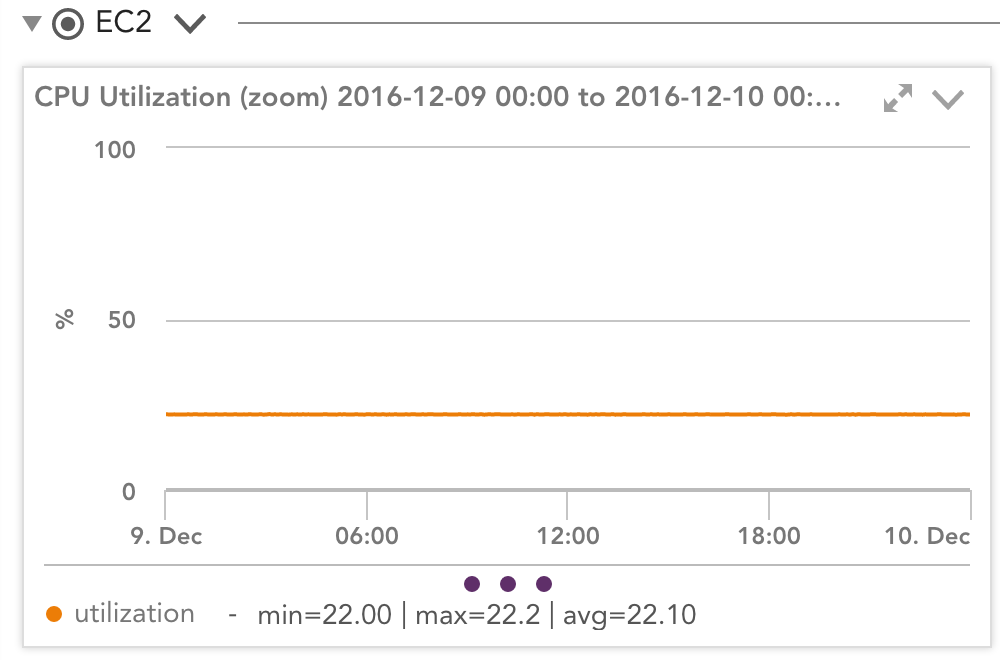
What happens when the instance uses the CPU more than “often”? How is that manifested in actual performance? How do we reconcile wildly varying CloudWatch and OS statistics, such as those below?
Let’s dive in to explore these questions.
Key takeaways
How CPU credits work on T2 instances
Amazon explains that “T2 instances’ baseline performance and ability to burst are governed by CPU credits. Each T2 instance receives CPU credits continuously, the rate of which depends on the instance size. T2 instances accumulate CPU credits when they are idle and use them when they are active. A CPU credit provides the performance of a full CPU core for one minute.” So the instance is constantly “fed” CPU credits and consumes them when the CPU is active. If the consumption rate exceeds the feeding rate, the CPUCreditBalance (a metric visible in CloudWatch) will increase. Otherwise, it will decrease (or stay the same). This dynamic defines T2 instances as part of AWS’s burstable instance family.
Let’s make this less abstract: Looking at a T2.medium, Amazon says it has a baseline allocation of 40% of one vCPU and earns credits at the rate of 24 per hour (each credit representing one vCPU running at 100% for one minute; so earning 24 credits per hour allows you to run the instance at the baseline of 40% of one vCPU). This allocation is spread across the two cores of the T2.medium instance.
An important thing to note is that the CPU credits are used to maintain your base performance level—the base performance level is not given in addition to the credits you earn. So effectively, this means that you can maintain a CPU load of 20% on a dual-core T2.medium (as the two cores at 20% combine to the 40% baseline allocation).
In real life, you’ll get slightly more than 20%, as sometimes you will be completely out of credits, but Amazon will still allow you to do the 40% baseline work. Other times, you will briefly have a credit balance, and you’ll be able to get more than the baseline for a short period.
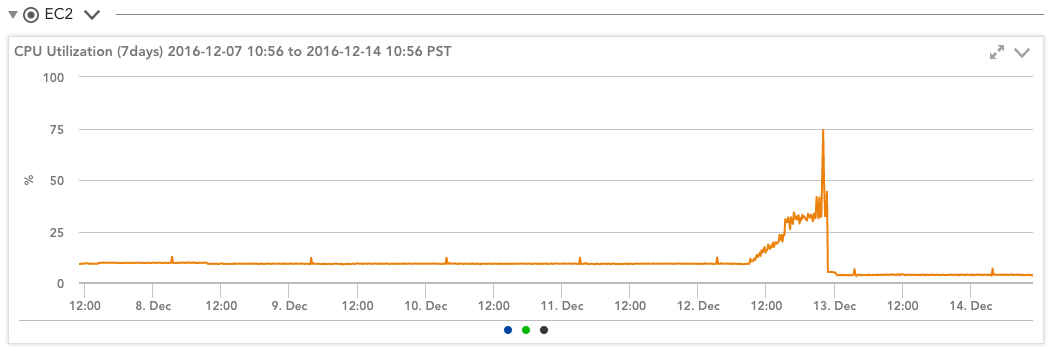
For example, looking at a T2.medium instance running a high workload, so it has used all its credits, you can see from the LogicMonitor CloudWatch monitoring graphs that Amazon thinks this instance is constantly running at 21.7%:
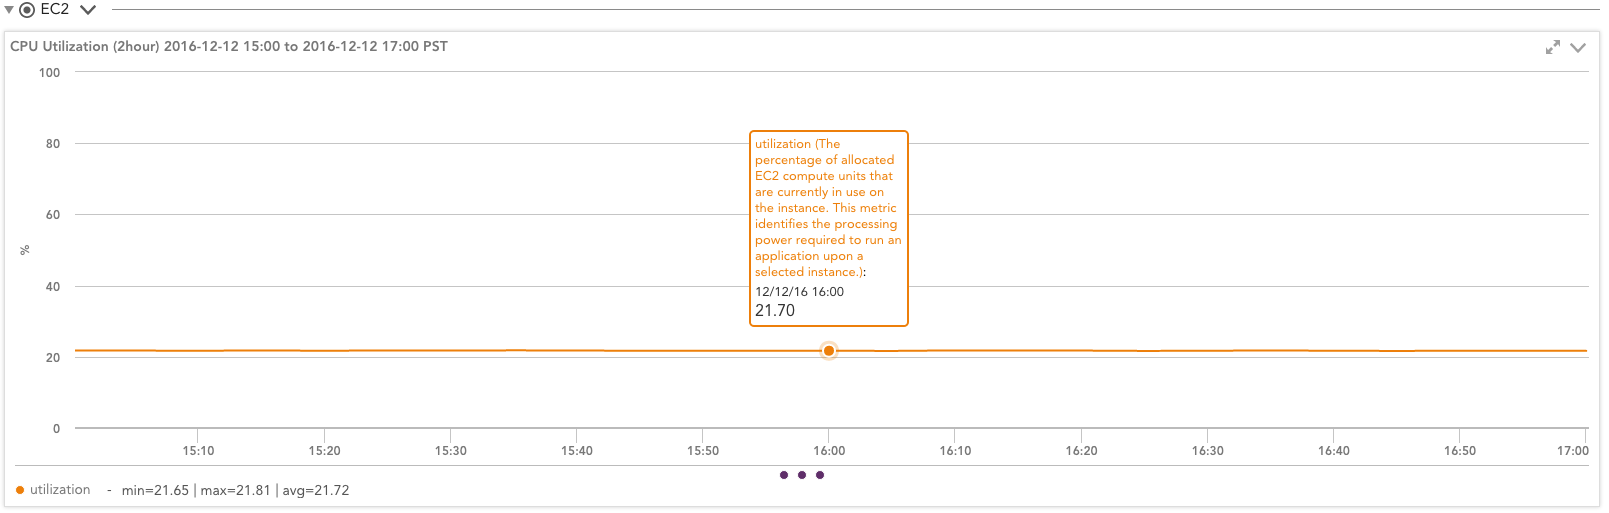
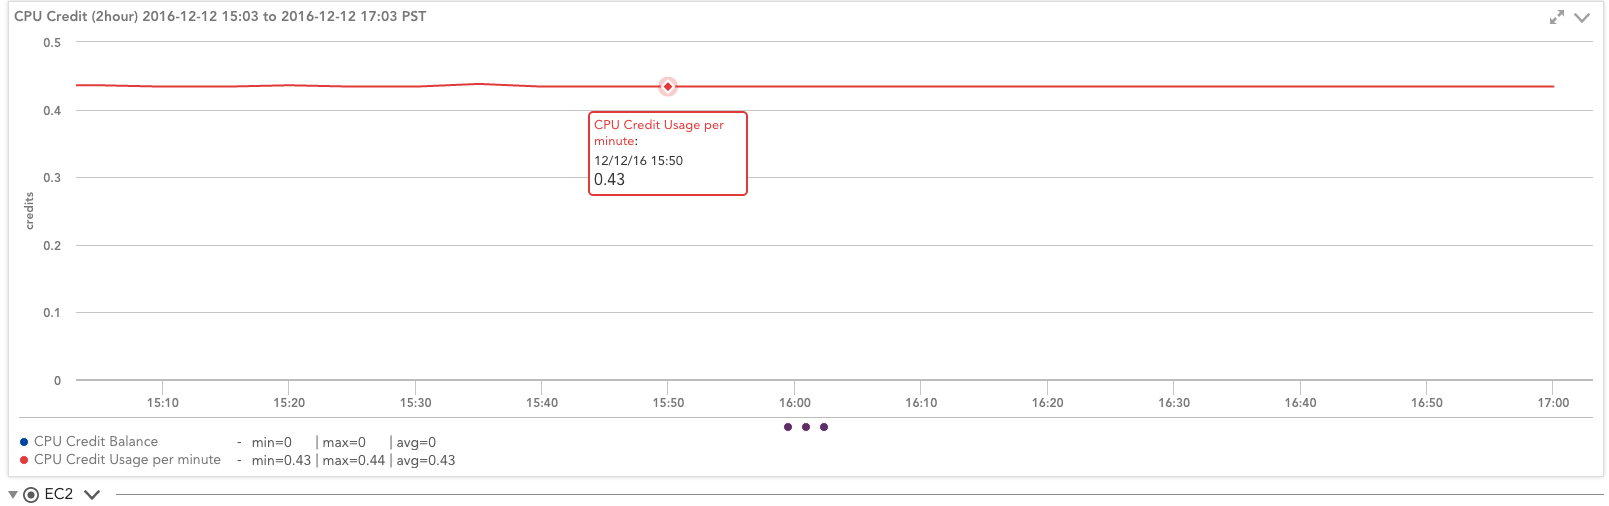
This instance consumes 0.43 CPU credits per minute (with a constant balance of zero, so it consumes all the credits as fast as they are allocated). So, in fact, this instance gets 25.8 usage credits per hour (.43 * 60 minutes), not the theoretical 24.
AWS RDS instances also use CPU credits, but the calculation is a bit different and depends on instance size and class (general purpose vs memory optimized). The T2 burst model allows T2 instances to be priced lower than other instance types, but only if you manage them effectively.
Impact of CPU credit balance on performance
But how does this affect the instance’s performance? Amazon thinks the instance is running at CPU 21% utilization (as reported by CloudWatch). What does the operating system think?
Looking at operating system performance statistics for the same instance, we see a very different picture:
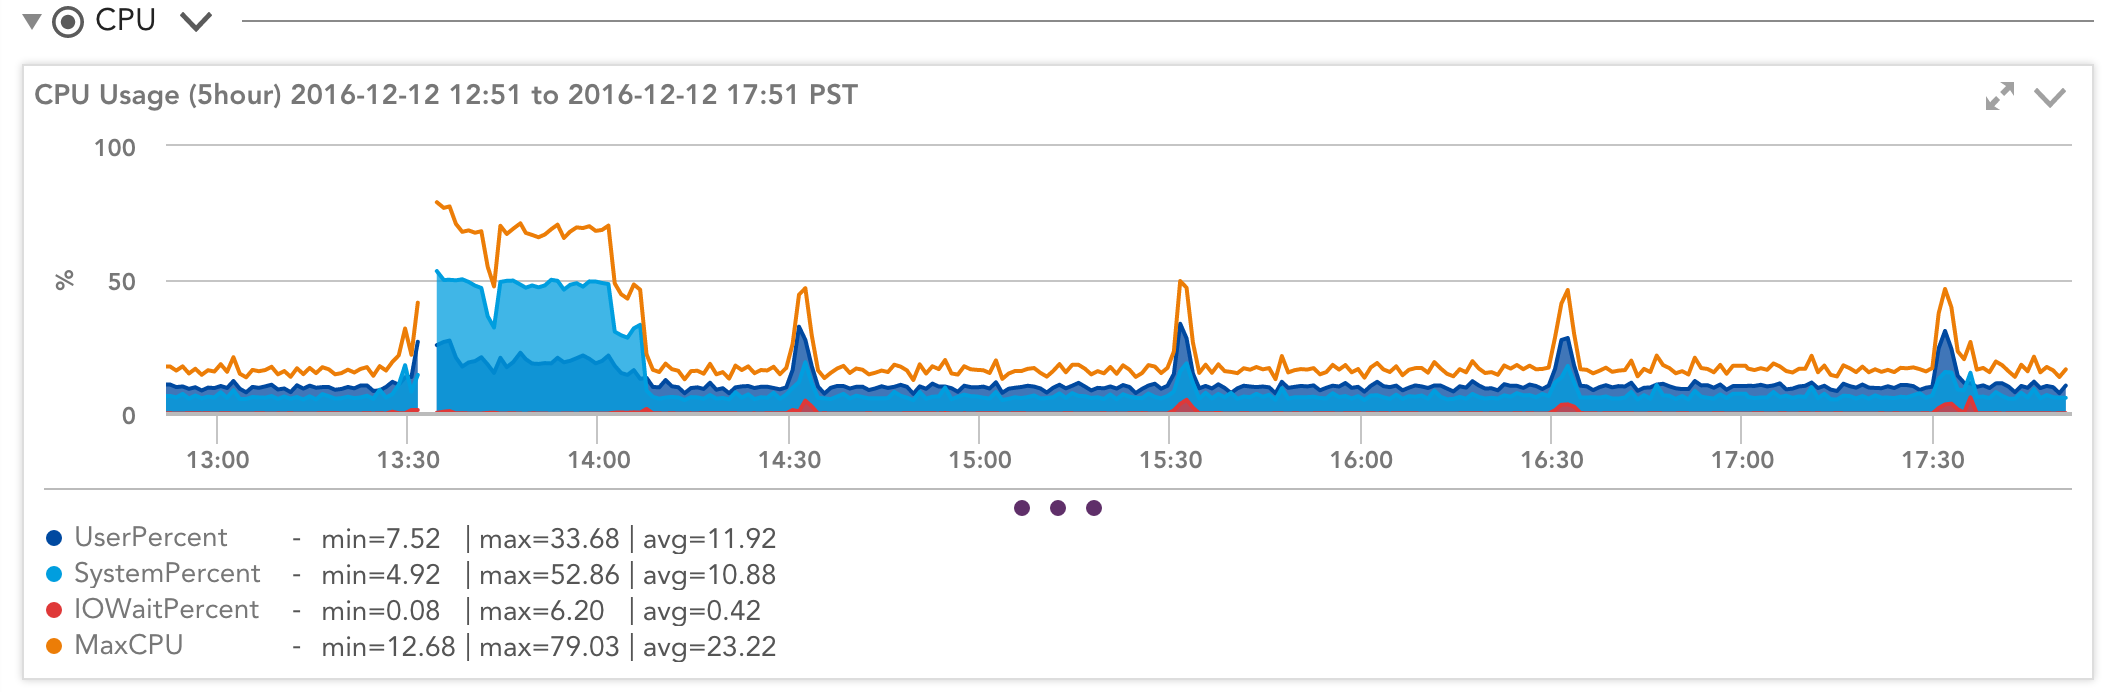
Despite what CloudWatch shows, utilization is not constant but jumps around with peaks and sustained loads. How can we reconcile the two? According to CloudWatch, the system uses 21% of the available node resources when it is running at 12% per the operating system and 21% when it is running at 80% per the operating system. Huh?
It helps to think of things a bit differently. Think of the 21% as “the total work that can be done within the current constraint imposed by the CPU credits.” Let’s call this 21 work units per second. The operating system is unaware of this constraint, so asking the OS to do the total work that can be done with 21 work units will get that done in a second and then be idle. It will think it could have done more work if it had more work—so it will report it was busy for 1 second, idle for the next 59 seconds—or 1.6% busy.
However, that doesn’t mean the computer could have done 98% more work in the first second. Ask the computer to do 42 work units, and it will take 2 seconds to churn it out, so the latency to complete the task will double, even though it looks like the OS has lots of idle CPU power.
We can see this in simple benchmarks: On two identical T2.medium instances with the same workload, you can see very different times to complete the same work. One with plenty of CPU credits will complete a sysbench test much quicker:
sysbench --test=cpu --cpu-max-prime=2000 run

sysbench 0.4.12:
  multi-threaded system evaluation benchmark


Number of threads: 1


Maximum prime number checked in CPU test: 2000

Test execution summary:

    total time:                          1.3148s

    total number of events:              10000
While an identical instance, but with zero CPU credits, will take much longer to do the same work:
Test execution summary:

    total time:                          9.5517s

    total number of events:              10000
Both systems reported, from the OS level, 50% CPU load (single core of dual core system running at 100%). But even though they are identical ‘hardware’, they took vastly different amounts of time to do the same work.
This means a CPU can be “busy” but not work when it’s out of credits and finished its base allocation. It appears very similar to the “CPU Ready” counter in VMware environments, indicating that the guest OS has work to do but cannot schedule a CPU. After running out of CPU credits, the “idle” and “busy” CPU performance metrics indicate the ability to put more work on the processor queue, not the ability to do more work. And, of course, when you have more things in the queue, you have more latency.
Monitoring and managing CPU credit usage
So, clearly, you need to pay attention to the CPU credits. Easy enough to do if you are using LogicMonitor—the T2 Instance Credits DataSource does this automatically for you. (This may already be in your account, or it can be imported from the core repository.) This DataSource plots the CPU credit balance and the rate at which they are being consumed, so you can easily see your credit behavior in the context of your OS and CloudWatch statistics:
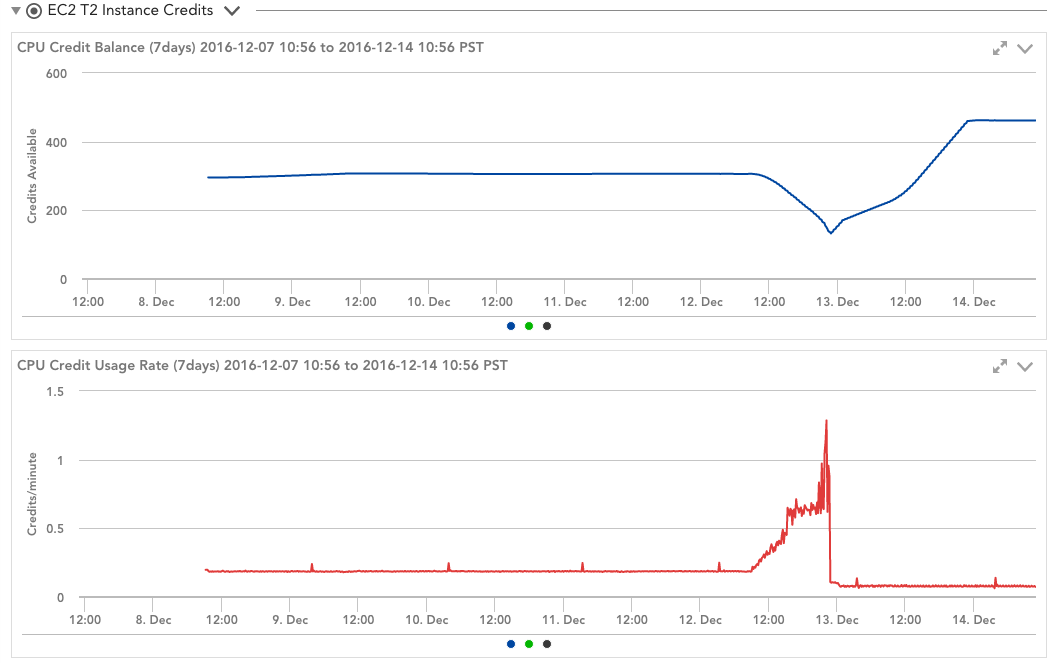
This DataSource also alerts you when you run out of CPU credits on your instance, so you’ll know if your sudden spike in apparent CPU usage is due to being throttled by Amazon or by an actual increase in workload.
“Monitoring your CPU credit balance is crucial for maintaining optimal AWS T2 instance performance and avoiding unexpected slowdowns.”
What are burstable instances?
Burstable instances are a unique class of Amazon EC2 instances designed for workloads with variable CPU usage patterns. They come with a baseline level of performance and the ability to burst above it when your workload requires more CPU resources.
Each burstable AWS EC2 instance has a few baseline characteristics:
- Baseline performance: The base CPU performance level, which is a percentage of a full CPU core’s capacity
- CPU credits: Credits used to manage performance above the baseline level, given when the CPU usage is below the baseline
- Credit balance: The unused credits received due to performing below the baseline level
This capability makes burstable instances ideal for applications with a sometimes unpredictable traffic load. Some common use cases you see them used for include:
- Web servers with variable traffic patterns
- Small databases with occasional high-CPU operations from requests
- Development and test environments
- Microservices and containerized applications
T2s aren’t the only product that allows for burstable instances, either. They are also included in the following product families:
- T3
- T3a
- T4g
What are T3 instances?
T3 instances are Amazon’s next generation in the AWS T family of burstable instances. T3 offers improved performance and a better cost—making it a great choice for your business if you plan to start with AWS or upgrade your current instance.
T3 offers many benefits over T2:
- Better performance price: Get 30% better price-to-performance ratio compared to Amazon T2 instances
- Nitro system: Built on the Amazon Nitro systems to offer better networking and storage capabilities
- Unlimited mode: Run in “unlimited” mode by default to burst beyond baseline indefinitely for an added price
- Multiple processors: With T3 and T3a, get support for Intel and AMD processor lines
Overall, Amazon’s T3 lineup offers a substantial advantage over T2 in performance and cost. Look at your options to determine if it’s right for your organization.
Best practices for optimizing T2 instance performance
So, what do you do if you get an alert that you’ve run out of CPU credits? Does it matter? Well, like most things, it depends. If your instance is used for a latency-sensitive application, then this absolutely matters, as it means your CPU capacity is reduced, tasks will be queued, and having an idle CPU no longer means you have unused capacity. For some applications, this is OK. For some, it will ruin the end-user experience. So, having a monitoring system that can monitor all aspects of the system—the CloudWatch data, the OS-level data, and the application performance—is key.
Another note: T2 instances are the cheapest instance type per GB of memory. If you need memory but can handle the baseline CPU performance, running a T2 instance may be a reasonable choice, even though you consume all the CPU credits all the time.
Hopefully, that was a useful breakdown of the real-world effect of exhausting your CPU credits.