Best Practices for Monitoring an AWS Hosted Website
Because the LogicMonitor collector is within your network, it has access to the “behind the scenes” infrastructure components that your website is running on.
If you missed our recent advanced web seminar on Best Practices for Monitoring an AWS Hosted Website, this post is for you. In the web seminar, we covered how to use LogicMonitor to monitor multiple layers of the infrastructure responsible for keeping a website up and running, and specifically how to set up this monitoring. Since this was an advanced topic, we included a fair amount of demonstration.
Specifically, we created an example website and a fairly simple AWS setup so that we could walkthrough everything we talked about in LogicMonitor. Keep in mind that almost everything we talked about can be applied to monitoring websites in general, and was not specific to AWS.
To sum up the key points, we recommend that you always monitor your website:
1. From the inside:
Monitoring your website from inside your network will enable you to pinpoint specific components that are causing problems when issues arise. Monitoring your website from the inside includes:
Monitoring the infrastructure components that your website is running on
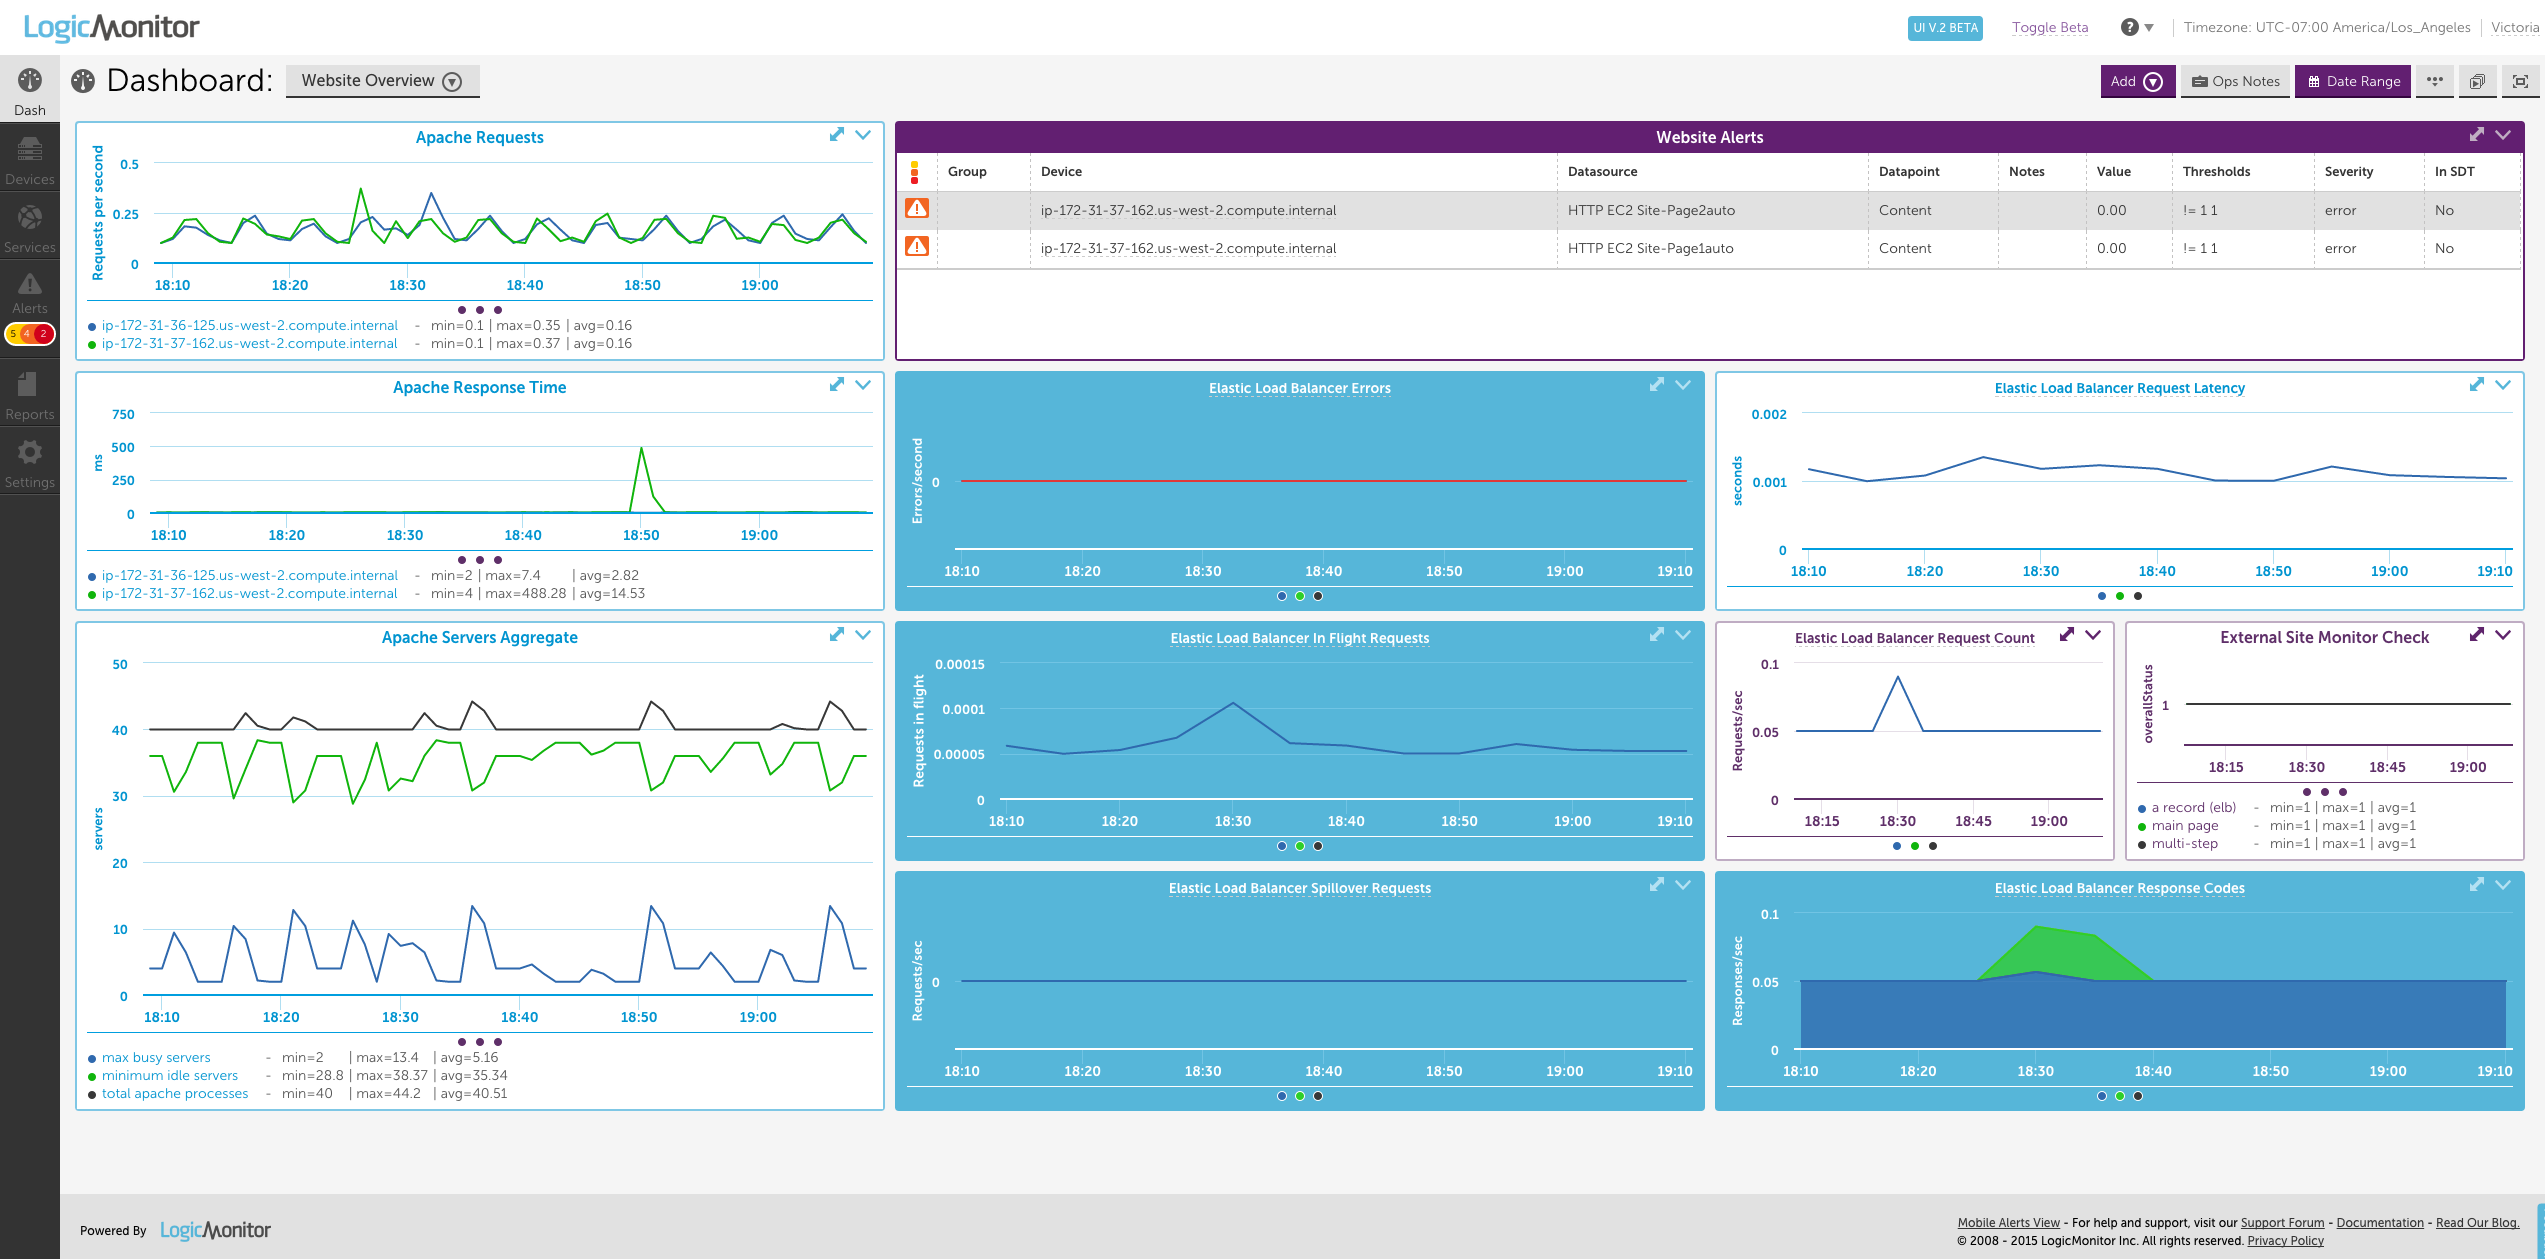
Because the LogicMonitor collector is within your network, it has access to the “behind the scenes” infrastructure components that your website is running on. Infrastructure is a general term, but what we mean here is that you should monitor things like servers and load balancers that you’re using to host your website. In our demonstration, we set up monitoring for our Amazon cloud infrastructure, which included two Elastic Compute Cloud (EC2) servers and one Elastic Load Balancer (ELB). This also allowed us to show off LogicMonitor’s new AWS monitoring functionality (currently in beta release.) LogicMonitor’s AWS monitoring uses the AWS software development kit (SDK) to get CloudWatch metrics and also computes metrics that CloudWatch doesn’t provide. This allows you to monitor your AWS cloud resources alongside your existing monitored architecture in LogicMonitor.
Using an HTTP datasource to monitor your website for specific content
LogicMonitor has a webpage collection method that allows the collector to query data from any system using HTTP or HTTPS. The LogicMonitor default HTTP page datasource uses this collection method to check for load time and availability of a web page. But really, it is not sufficient to only check the availability a page, because you want to make sure that the correct content is loading. So you can actually customize the HTTP page datasource to look for specific content on a webpage. In our demonstration, we added data points that looked for a the presence of a specific string in our web pages.
Monitoring the application serving your web pages
It’s a good idea to monitor the application serving the web pages for your site because in a scenario where the web pages do stop working, the monitored data will let you know whether it’s a problem with the application itself or something else, like a problem with the website configuration file. In the webinar demonstration we set up Apache monitoring. The LogicMonitor Apache datasource uses the webpage collection method to accessing the server status page using HTTP, so you need to make sure this page is accessible.
2. From the outside:
You should monitor your website from outside your network to ensure that your website is accessible. Even if all of the equipment running your website is functioning perfectly, there are still multiple external factors that could potentially prevent outside users from being able to access it. A website that isn’t accessible to end users is not a very useful website. So to monitor the full picture, you need to have checks that come from outside your network. You can use LogicMonitor Services (aka SiteMonitor) to set up periodic checks from external locations to mimic the experience of a user accessing your site.
Keep in mind that you may have some overlap in the data you are monitoring for your website, but this redundancy can give you insight into what components aren’t working properly when something goes wrong, especially when you see inconsistencies between data for the same component monitored from different perspectives.
Below is a dashboard we put together to show data for the monitoring we set up in our demonstration.