Beyond Monitoring: From Bits and Bytes to Business-Level KPIs
When discussing monitoring with IT teams, it is important to identify parameters and requirements for their specific environments. LogicMonitor's business intelligence capabilities can help.
When discussing monitoring with IT and technical operations teams, it comes as no surprise that every team has its own parameters and requirements for their particular environment. Some teams just need an up-down of specific devices or interfaces, and others need more granular metrics like JVM or database performance. At the end of the day though, everyone is responsible for a service. Your service might be a public-facing website, it could be internet access at a remote location, or it might be an internal tool, like a support ticketing system.
A Unified Approach to Monitoring
There has been a trend recently for practitioners and executives alike to have a unified view of the “health” of their service. What is commonly found though, is that reporting on the overall status, or health, of a service, is not straightforward. This is especially true for environments that are supported by diverse or ephemeral infrastructure. While most teams can define the key metrics that must be in good standing for their service to be healthy, they are stopped short of this goal due to their disparate and/or inflexible tooling.
A majority of the technical teams that we talk to typically use a mix of monitoring solutions that were purpose-built for one layer of today’s infrastructure stack. They are using a tool (or module) for monitoring the network, another tool for monitoring the servers, and yet another tool for monitoring the applications and databases. While some of these tools and modules can be integrated to give you a dashboard with metrics from each layer, they are not truly integrated and therefore can’t aid in correlating the performance of individual components with the health of the overall service.
In addition to the countless hours of time that are recovered when a unified monitoring and reporting system is put in place, it is just as imperative to connect the dots between the infrastructure and the team-level, or business-level KPIs.
How We Monitor Business Intelligence
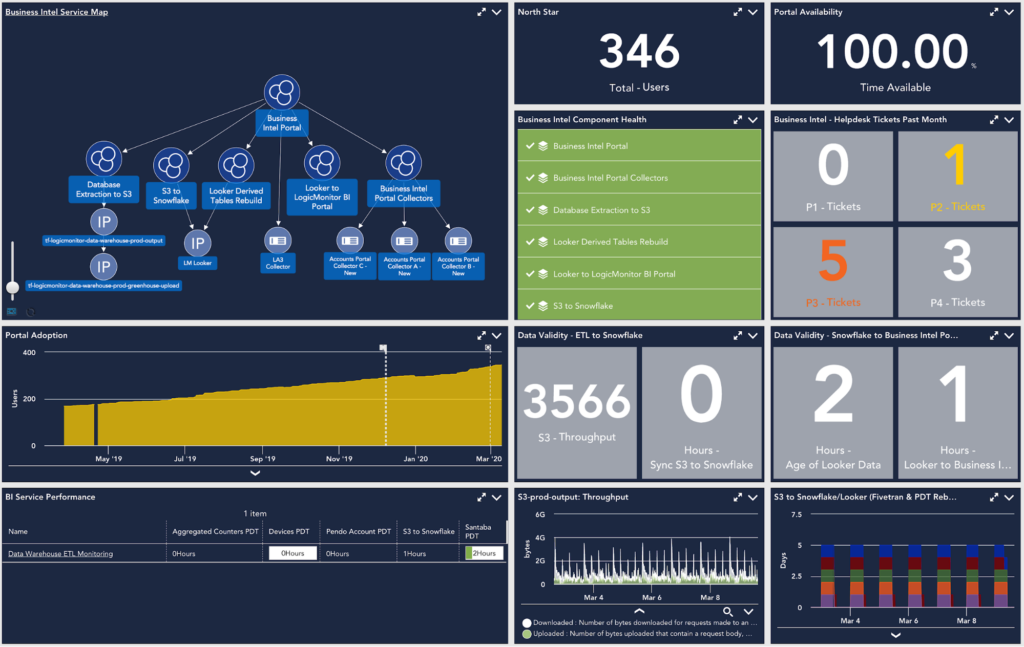
Teams are frequently asked to diagnose or report on the overall health of their service, and for most, this is a daunting task. Let’s take a true-to-life example. At LogicMonitor, the Business Systems team maintains a business intel portal that is consumed by numerous cross-functional teams throughout the company. For us, this portal is our service. To accurately report on the successful delivery of our service, we must have visibility into metrics that range from infrastructure performance to consumer-grade KPIs.
For this portal to operate effectively, a number of components must be performing optimally: the database-extraction application must send the data to Amazon’s S3, a third-party ETL-service pushes the data from S3 to our data warehouse, and an internally-built and hosted application then moves the data into our portal.
To nobody’s surprise, we use LogicMonitor to keep an eye on our ETL pipeline, as well as our portal’s successful delivery to our (internal) “customers.” From the throughput on our S3-buckets all the way to the number of weekly active users accessing our business intel portal.
When all is said and done, this is the joint responsibility of the team, from the engineers to management. We know that if our portal is not working properly, trust in the service deteriorates, and our active user count dwindles.
LogicMonitor’s customers are using the platform in exactly this way: to bridge the gap between the infrastructure that supports the mission-critical applications, and the metrics that are used to grade the success of these services. This is only possible with a tool like LogicMonitor because it has been built from the ground up to provide comprehensive visibility into all layers of the infrastructure, as well as limitless flexibility to monitor any metrics deemed relevant to the health of the service.
LogicMonitor is what allowed Ted Baker to extract ERP insights relevant to both executives and IT Teams. As Stuart Carrison, Ted Baker’s head of IT stated, “What’s unique about using LogicMonitor is that we can provide information to the business about how the business is performing.”
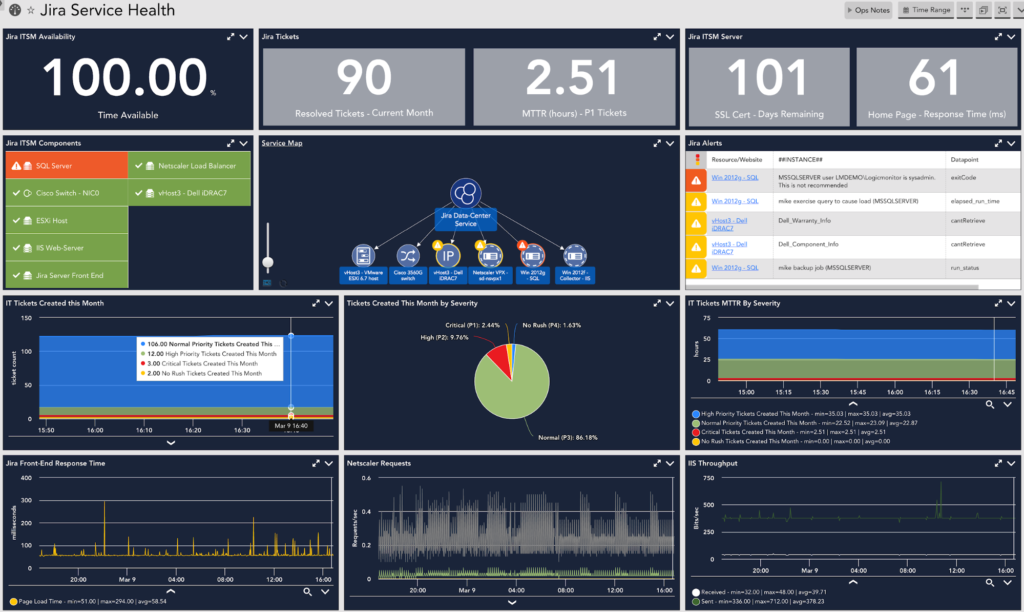
In order to provide a less abstract example of the service-centric approach to monitoring, let us look at a common service that IT teams are responsible for: an internal ITSM tool like Jira.
In this case, our dashboard is comprised of underlying infrastructure components, along with counters of tickets pertaining to our Jira portal. As mentioned before, LogicMonitor provides a holistic picture of our service: from hardware health all the way through to team-level goals.
Key Takeaways
For those looking to build out their service-based approach to tooling and monitoring, here are a couple of recommendations and food-for-thought as takeaways:
Start from the KPI’s of your service, and work backward. This tends to not only fortify your monitoring safety net, but it initiates the conversation that bridges the business with the tech. With a tool like LogicMonitor in place, you are provided a unified and consistent method for attaining coverage over all of your relevant metrics.
Second, especially when it comes to dashboards and reports: find the right balance between including all components that make up your service while not losing sight of the service itself. As is common in IT, one can “lose sight of the forest from the trees.”
Finally, it’s about the people: use the platform as a way to introduce ease into your technical operations and clarity to all stakeholders across the business.
If you are interested in learning more about LogicMonitor’s business intelligence capabilities, connect with your customer success manager or attend a weekly demo to see LogicMonitor in action.
Disclaimer: The views expressed on this blog are those of the author and do not necessarily reflect the views of LogicMonitor or its affiliates.