Create and Close Tickets in Jira (or Any Other Tool) in Response to Alerts
While LogicMonitor has a robust built-in alert delivery, escalation, and reporting system, you may be using other tools in parallel to access and store IT information. We've talked before about integrating LogicMonitor and Jira - including how to monitor tickets created in Jira with LogicMonitor, and how to use Jira queries to trigger and escalate alerts in LogicMonitor.
4 min read
October 28, 2016
In this article
NEWSLETTER
Subscribe to our newsletter
Get the latest blogs, whitepapers, eGuides, and more straight into your inbox.
Thank you!
Your video will begin shortly
SHARE
In this article
While LogicMonitor has a robust built-in alert delivery, escalation, and reporting system, you may be using other tools in parallel to access and store IT information. We’ve talked before about integrating LogicMonitor and Jira – including how to monitor tickets created in Jira with LogicMonitor, and how to use Jira queries to trigger and escalate alerts in LogicMonitor. (This enables anyone to use LogicMonitor’s escalations to page on-call engineers by creating a specific type of ticket in Jira. It also enables LogicMonitor to automatically escalate Jira issues if they are not being resolved within the required SLA.)
This time we want to talk about the other direction: how to use LogicMonitor to create and resolve Jira issues that occur in response to LogicMonitor alerts. At LogicMonitor, our TechOps team works with alerts directly in the LogicMonitor platform, but our Account Management team prefers to use Jira to see the same type of information – so we put the data in both systems using LogicMonitor’s integrations capabilities.
While LogicMonitor has a variety of pre-built integrations, Jira is not officially one of them given Jira’s vast array of configuration variations. However, LogicMonitor’s custom HTTP delivery integration can be used to create an integration with many tools and services, including Jira (especially given Jira’s robust REST API).
To create your own Jira/LogicMonitor integration, follow these steps:
From Settings -> Integrations, click Add – “Custom HTTP Delivery”
Give your new integration a name and description, and select “Use different URLs or data formats to notify on various alert activity”. (This allows LogicMonitor to take different actions in Jira, depending on whether the alert is being created, escalated, or cleared.)
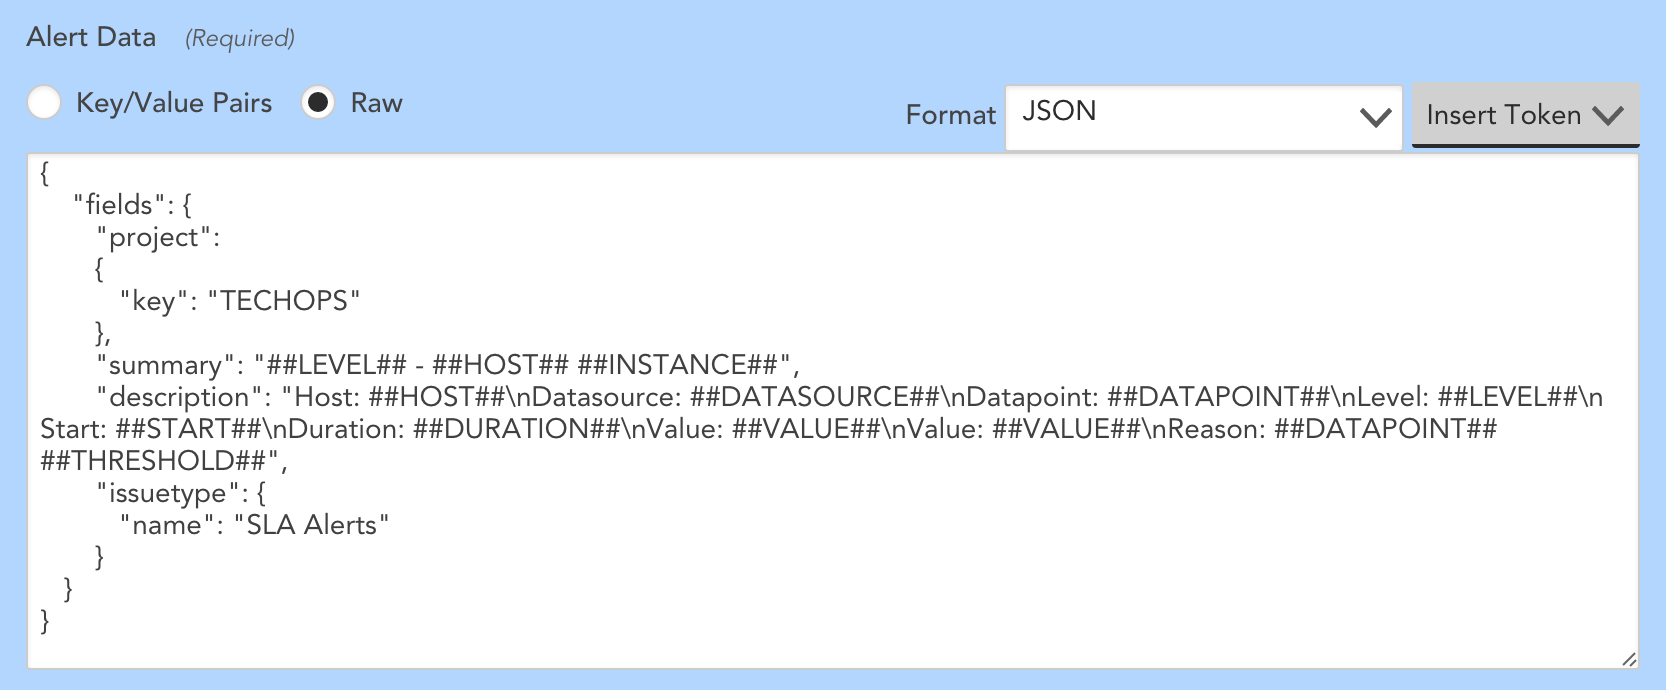
You’ll need to first specify what to do with new alerts: For Jira, you should be POSTing to the API endpoint of your server that will create alerts (jira.example.com/rest/api/2/issue), and providing username and password values. The Alert Data should be set to Raw JSON, and the payload should look something like the following:
Change the Project key and IssueType fields to ones that exist in your Jira workflows.
If you want LogicMonitor to update the status of your Jira tickets when the alert changes state or clears, you’ll need to capture Jira’s identifier for the ticket that is created by the above POST.
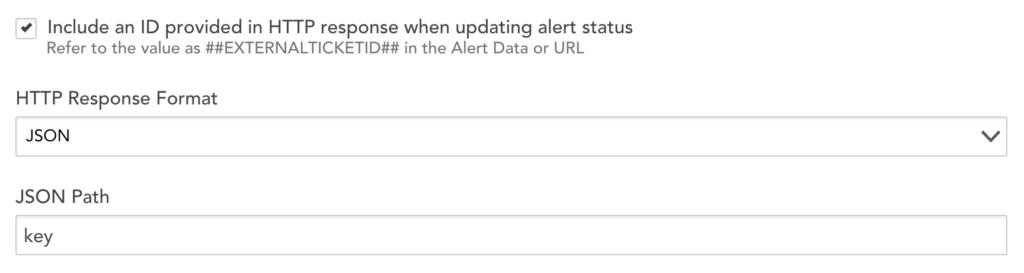
To do so, check the box that says “Include an ID provided in HTTP response when updating alert status” and complete the form that displays:
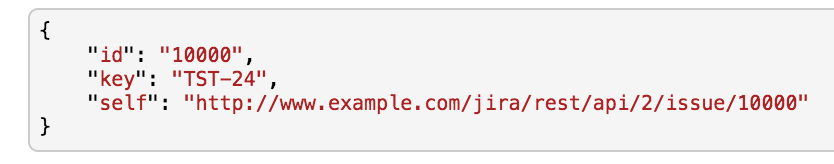
This says to LogicMonitor, “When you create a Jira issue, capture the response Jira replies with and look for a JSON object called ‘key’, and remember that object.” When you do create a ticket, Jira will reply like this: By telling LogicMonitor to grab the “key” field, LogicMonitor will get the ticket ID from Jira’s point of view (“TST-24” in the above example). LogicMonitor can refer to that in future actions on that ticket, with the ##EXTERNALTICKETID## token.
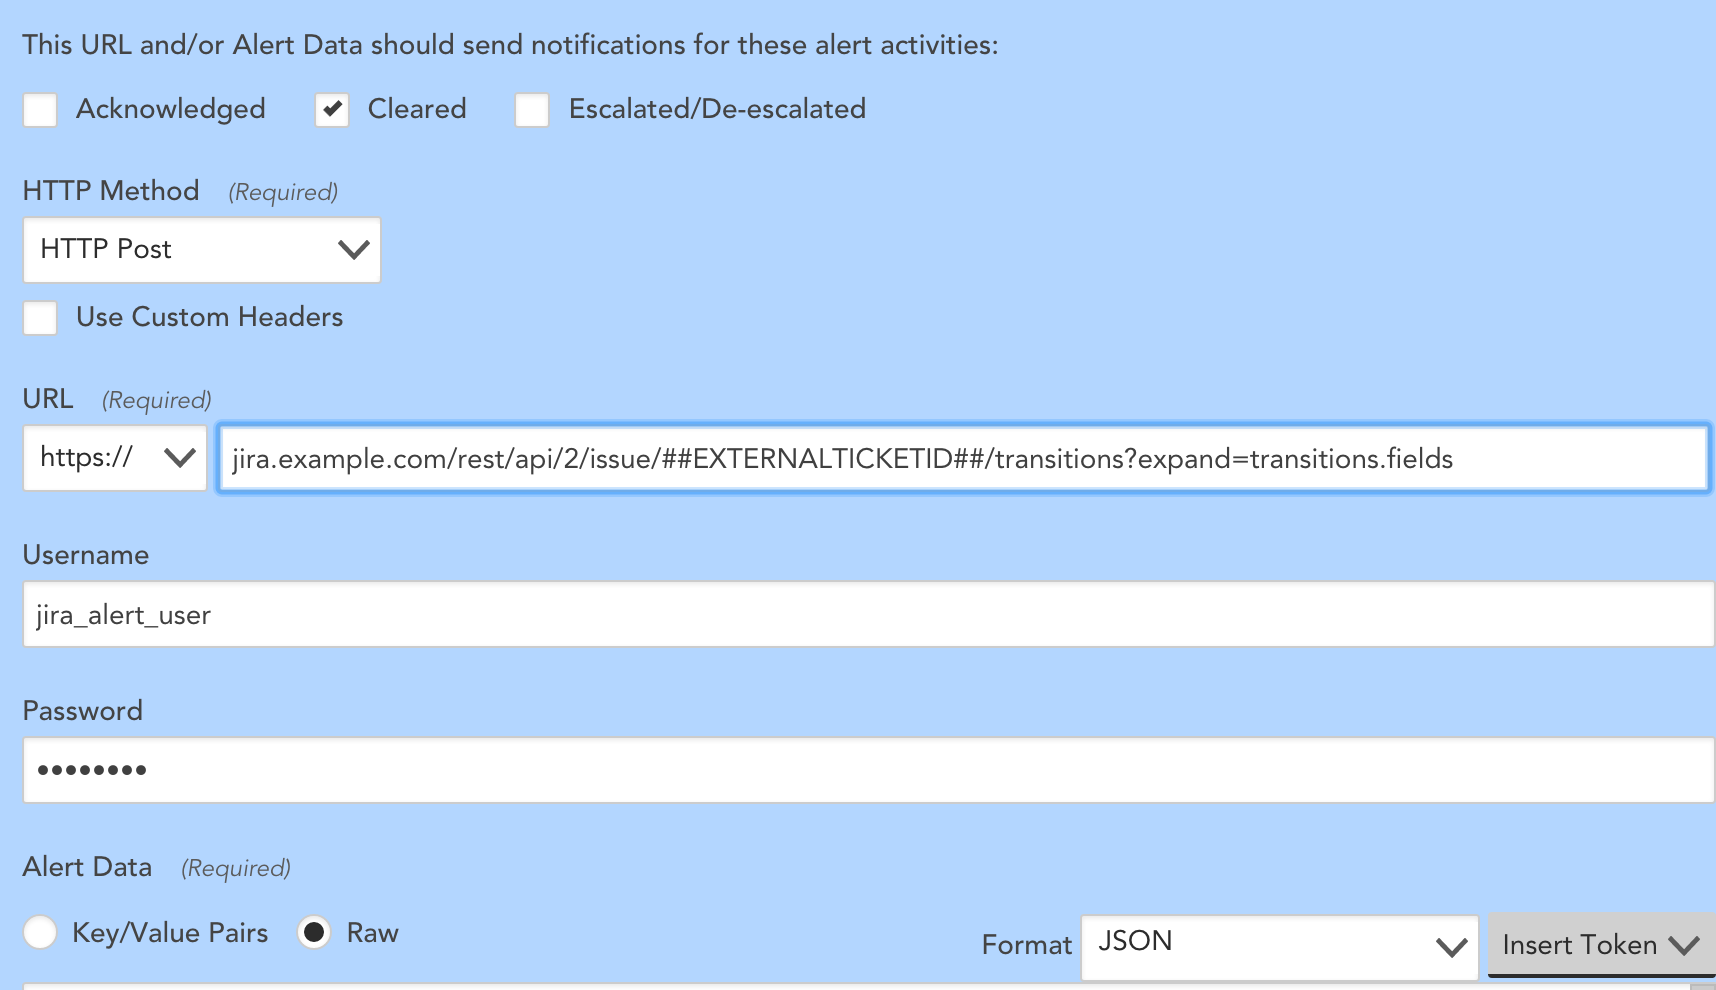
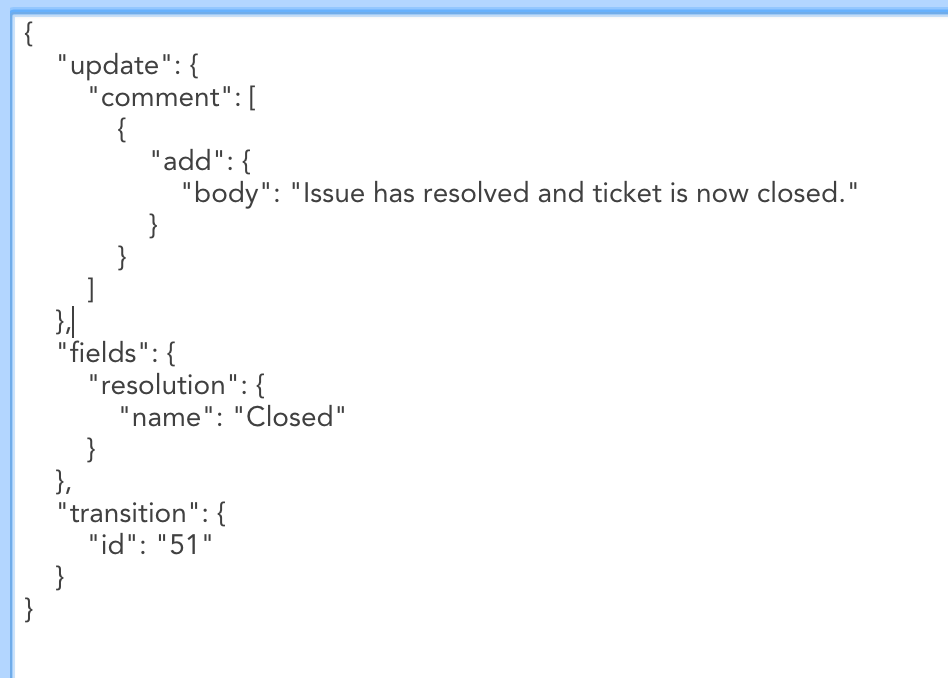
Now we can tell LogicMonitor what to do with cleared alerts; in this case, we want to close them in Jira (which is a “transition” in Jira language). To do so, add an alert status handler for cleared alerts that looks like the following (note that it references the ##EXTERNALTICKETID## token, to pass in the ticket we want to transition):
Set the payload to the following:
Ensure that you set the transition ID to the appropriate value for the transition from “Open” to “Closed” in your Jira system.
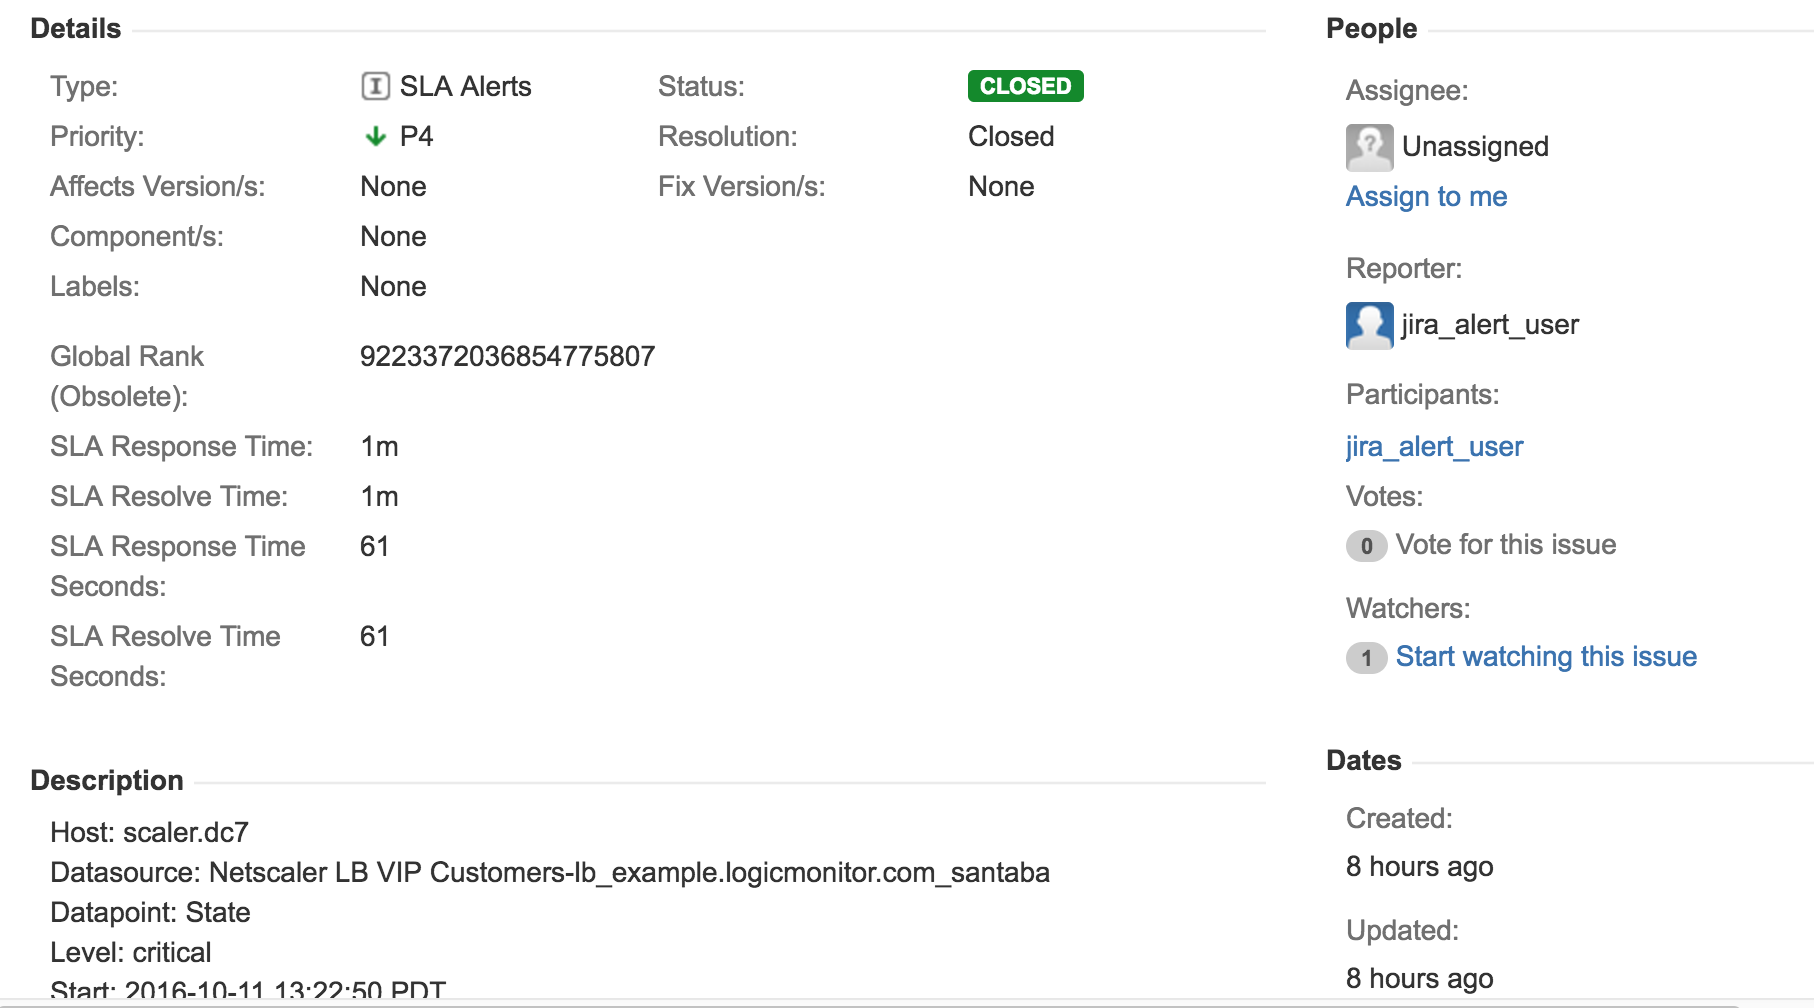
Save your method, and add your newly created delivery method to an escalation chain that is called by an alert routing rule – and you should have Jira issues being created by alerts, and automatically closed when they clear, as illustrated by the below:
This example was for Jira, but the same process can be used to build an integration with any tool that accepts HTTP calls with LogicMonitor. You can also be more creative by triggering different flows when alerts increase or decrease in severity, not just clear. So, if your boss wants to see alerts in his custom Visual Basic workflow tool he wrote himself 15 years ago in .ASP, you can say “Yes, sir!” (LogicMonitor does have Professional Services that can help with custom integrations – but they’d probably prefer not to be involved in that case.)