At LogicMonitor, we store almost 100 billion metrics a day - more than a million per second. Some of our storage engines consequently have to deal with a lot of disk IO, so we have a heavy reliance on SSDs.
5 min read
December 1, 2015
In this article
NEWSLETTER
Subscribe to our newsletter
Get the latest blogs, whitepapers, eGuides, and more straight into your inbox.
Thank you!
Your video will begin shortly
SHARE
In this article
At LogicMonitor, we store almost 100 billion metrics a day – more than a million per second. Some of our storage engines consequently have to deal with a lot of disk IO, so we have a heavy reliance on SSDs. Traditionally these have been Intel’s enterprise SSD SATA drives, but recently we’ve been moving onto PCIe SSDs. Which raises the question – why have we been upgrading systems to PCIe SSDs? How did we know it was needed?
As a SaaS-based performance monitoring platform, we can collect a lot of data about our drives and our systems. But we’re only as good as the data we can get from the SSDs and that data isn’t always as comprehensive as we’d like.
With a traditional hard disk, the device utilization (percentage of time the device is not idle – i.e. busy) is a good indication of capacity. If the graph shows the disk is busy 90% of the time, request latency will be increasing, so it’s time to upgrade drives, add more spindles, or move workloads. However, with SSDs, as the iostat man page says:
"... for devices serving requests in parallel, such as RAID
 arrays and modern SSDs, this number does not reflect their
 performance limits."
This is because SSDs can deal with multiple requests at the same time – they are often optimized to deal with up to 64 (or more) requests at once, with no appreciable change in latency. The fact that the device is utilized doesn’t mean it can’t do more work at the same time – utilized does not mean at maximum capacity. At least in theory…
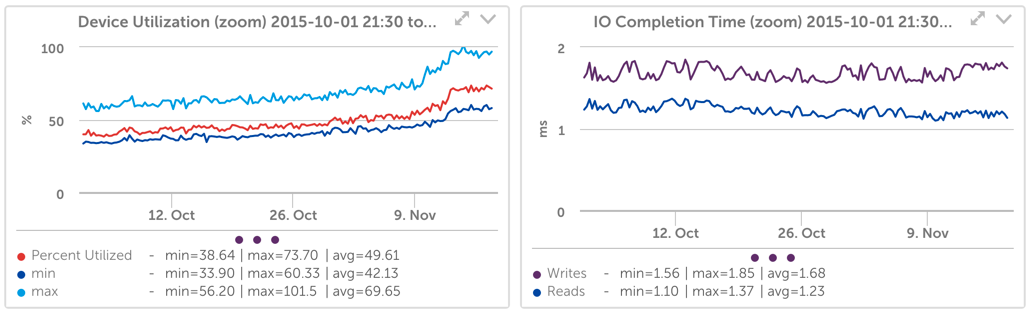
For our workload, however, we found that device utilization is a good predictor of SSD performance capacity. For example, looking at the following graphs:
You can see that as the amount of time the drive is busy (device utilization) increased, so did the latency of write requests.
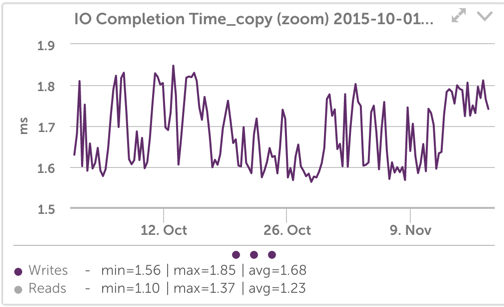
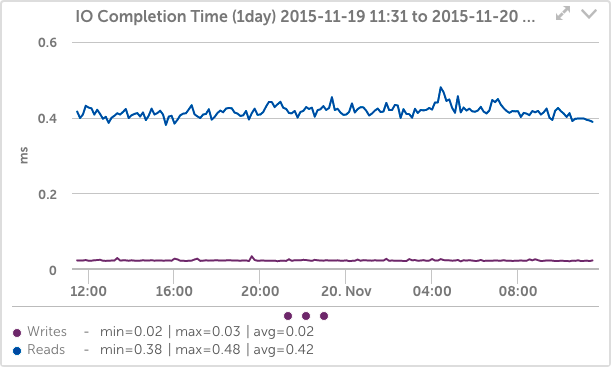
We can make that easier to see by changing the IO Completion time graph (which shows the time for operations to complete including queueing time) to not scale from zero, and not include reads:
Now it is a bit more apparent that when the device is busy, write latency went from an average of around 1.7ms to a sustained value of almost 1.8ms. This seems like a small change, but it’s around a 6% increase in latency.
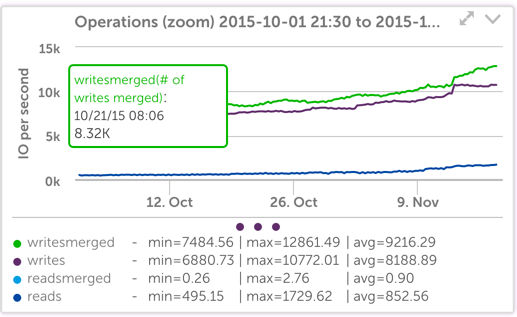
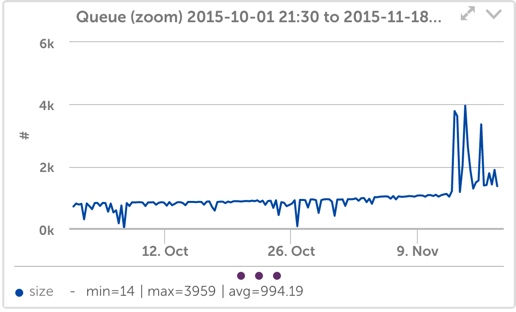
The absolute change in the number of disk operations is small, as seen below:
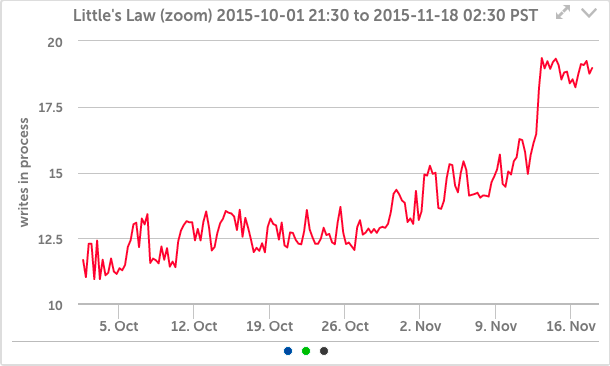
Yet it is apparent that even a small change in the number of file operations, when combined with a small change in latency, creates a significant change in the number of operations queued or active in the SSD system (this follows from Little’s law – the number of objects in a queue or being processed is equal to the arrival rate times the processing time): And for our application, that is enough to increase queuing internally.
This kind of erratic queueing is an indication of overload in our system and means that the IO system is close to not being able to keep up, resulting in growing queues.If left uncorrected, the system would then lag behind the incoming data. That would get our operations team paged in the middle of the night, so it’s something we try to address in advance.
In this case, we could have spread the load to more systems, but instead we elected to put in a PCIe SSD.
This dropped the IO completion time by a factor of 100, to 0.02ms for writes, instead of around 2ms as it was previously:
Another interesting note was that the number of writes went from around 10,000 per second, with about 12,000 merged, to 22,000 writes per second and zero merged, with the same workload. With no doubt this is due to the fact that the PCIe nvme disks use the none kernel IO scheduler, instead of the default CFQ scheduler that the SATA SSD’s used. (As I’ve noted before, this is easy to test, and we did test different schedulers for the prior SSDs – but found no detectable difference, so we left it at default.)
A more problematic issue we noted is that the NVME disks reported 100% busy time, and a queue size in the billions, both in LogicMonitor and in IOstat. However, this turned out to be a kernel issue, due to older kernels not using atomic in-flight counters. With the kernel updated, the statistics are being reported correctly.
So will device utilization turn out to be a good predictor of drive performance capacity for PCIe SSDs, or will their ability to deal with requests at the same time mean that we can’t rely on that metric for planning? Well, we are nowhere near 100% for these devices, and we haven’t yet run accurate workload simulations to this scale – but using FIO, we did find that in order to drive these cards to near 100% (it required many workload threads to be running – but that it also increased latency).
But as always – the best indication of how your systems scale is to monitor the metrics that matter for your systems, as you scale them. Drive utilization is an indicator, but not as meaningful as monitoring custom metrics for your applications (e.g. their own internal queues, or latency, or whatever is appropriate). Make sure your applications expose metrics that matter and your monitoring system is easily extended to capture them. But also keep capturing metrics like device utilization – more data is always better.