SNMP has been around for decades, and while it’s great for standard metrics like CPU or memory usage, it wasn’t built to tell you the size of a log file or whether a specific service is running. But with a little-known feature called snmp extend, you can teach your SNMP daemon to answer those questions.
In this guide, we’ll show you how to wire up custom scripts to SNMP, test your setup, and build a lightweight DataSource around it so you can monitor the edge cases that actually matter.
TL;DR
snmp extend allows Net-SNMP to expose custom script output as SNMP OIDs for remote monitoring
You can use it to track file sizes, service states, or any scriptable metric that SNMP doesn’t cover by default
Proper script hygiene, fast, clean, one-line outputs, is key to reliable SNMP integration
Pairing snmp extend with a LogicMonitor DataSource makes custom monitoring lightweight and repeatable across environments
What Is SNMP Extend and Why It Still Matters
Think of snmp extend like giving your old SNMP setup a few extra tricks, like teaching your dog to fetch your slippers and check your email. It’s a simple way to plug in your own custom scripts so SNMP can report on things it was never built to understand out of the box.
By default, SNMP knows how to answer predefined questions (CPU usage, network stats, memory load), but if you ask it something like, “How big is this specific file?” or “Is Nginx running?”, it’ll shrug. That’s where extend comes in.
SNMP can’t tell you how big your log file is, unless you teach it how.
snmp extend lets you wire up your own commands or scripts inside the SNMP daemon’s config. Once that’s in place, you can query those scripts remotely just like any other SNMP object. It’s old-school, sure, but still incredibly useful, especially when:
You need to expose niche metrics that no default MIB covers
You want to automate visibility into edge-case behaviors without writing custom collectors
Is it shiny? No. But it works. And when used carefully, snmp extend can give you powerful, low-effort visibility into exactly what matters to your environment.
How SNMP Extend Works
At its core, snmp extend is a neat little hack built into the Net-SNMP daemon (snmpd). You give it a command to run, like a shell script, a binary, or even something as simple as du, and it exposes the output through a special SNMP OID. That’s it.
Here’s how the flow works:
You define a command in your snmpd.conf file
You add a line like this:
extend file-check /usr/bin/du /var/log/syslog
This tells snmpd: “Hey, when someone queries this SNMP object, run du /var/log/syslog and return the output.”
You restart the SNMP daemon (snmpd)
This applies the new config:
sudo systemctl restart snmpd
SNMP generates a new set of OIDs under a fixed subtree
Every extend entry gets mapped into .1.3.6.1.4.1.8072.1.3.2.x.
Don’t worry. You don’t need to memorize that. Just know this is where your output will live.
You use snmpwalk or snmpget to see the results
Once it’s in place, you can query the OID like any other SNMP metric:
snmpwalk -v2c -c public myserver .1.3.6.1.4.1.8072.1.3.2
The output of your command gets returned
SNMP gives you either:
Just the first line (nsExtendOutput1Line)
Or the full output if it’s multiline (nsExtendOutputFull)
So essentially, SNMP acts as a wrapper (a polite middleman) for whatever command you tell it to run. This opens the door to all kinds of monitoring you wouldn’t get otherwise, without needing to deploy new tools or agents.
PRO TIP: These commands are executed as the same user running snmpd, usually snmp. So if your script relies on permissions, environment variables, or paths, test accordingly.
snmp extend turns your scripts into SNMP metrics. No agents, no fuss.
Syntax Cheatsheet: snmpd.conf Examples
If you’ve never touched snmpd.conf before, don’t stress. Adding an extend entry is surprisingly simple. The format looks like this:
One of our long-time customers, AppFolio, came to us with a simple-sounding request: “Can we monitor the size of specific files across all our Linux servers using LogicMonitor?” On the surface, that sounds easy. But with standard SNMP? Not quite.
LogicMonitor typically uses SNMP to monitor Linux systems, which means there’s no need to install extra software on every server. A big plus in large environments. That said, SNMP only exposes predefined OIDs (think of them like questions SNMP knows how to answer). It can tell you CPU load or memory usage, sure. But “how big is /var/log/myfile.log?” That’s not one of its built-in answers.
And while you could deploy a collector as an agent and run a script-based DataSource to fetch file sizes directly, that’s a different approach (and a story for another blog post). In this case, we wanted to keep things lightweight and stick with SNMP. So we reached for a lesser-known but powerful feature: snmp extend.
Expand SNMP with Custom Commands Using snmpd.conf
Here’s where the fun begins. Most Linux systems use the Net-SNMP daemon (snmpd), and the good news is, it’s extendable. That means we can teach it new tricks, like how to report the size of a specific file.
Let’s say you want to monitor the size of /var/spool/rsyslog. All you have to do is add this line to your snmpd.conf file:
This tells SNMP: “When someone queries the right OID, run du /var/spool/rsyslog and give them the output.”
Behind the scenes, SNMP creates a new entry in the .1.3.6.1.4.1.8072.1.3.2 tree. But the exact OID index it generates is a bit… opaque. Each extend entry is encoded as a long string of decimal numbers that correspond to ASCII values of the name you gave it.
To see which commands have been extended, use this:
snmpwalk -v2c -c public servername .1.3.6.1.4.1.8072.1.3.2.2.1.2
Because the du command gives just one line, you can also use .3.1.2 (for full output) and get the same result. But for scripts that produce multiline output, that distinction becomes important.
Getting the Data into LogicMonitor
Now that we’ve extended snmpd to report the file size, let’s bring that data into LogicMonitor so we can visualize it, alert on it, and track trends over time.
If you’re managing a fleet, chances are you’ve already rolled out that snmpd.conf change using something like Puppet, Chef, or Ansible. (If not, this is a great case for automation.)
Step 1: Create a New DataSource
Head to Settings → Datasources, then click New DataSource.
Fill out the General Information section with a meaningful name, like FileSize_SNMP_Extend.
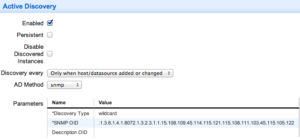
Step 2: Configure Active Discovery
Now, you might be wondering: “Why use Active Discovery if we’re only monitoring one file?”
Good question. The answer is: we can’t assume every Linux server has this OID available. Some might not have the extension deployed or enabled. So, we use Active Discovery to test for its presence.
Here’s the trick: the discovery OID you use should be one segment shorter than the full index you used in your snmpget earlier. That’s because Active Discovery performs a snmpwalk, not a direct snmpget, and needs to see at least one result under that path to create the instance.
Step 3: Add a Normal Datapoint
Once discovery is set, add a Normal Datapoint to pull in the actual value. In this case, the file size.
Since the SNMP output includes both the number and the file path (e.g., 1025360 /var/spool/rsyslog), we’ll need a regular expression to capture just the number. Something like:
^(\d+)
That grabs only the digits at the start of the line. Exactly what we want for monitoring.
From here, you can:
Add a graph to visualize file size over time
Set warning or critical thresholds
Alert if the file crosses a size you’re not comfortable with
In short: everything you’d expect from LogicMonitor, powered by a simple SNMP extension.
Best Practices for Writing Extend Scripts
When you’re using snmp extend, your script becomes part of the monitoring pipeline. So it needs to be predictable, fast, and clean. Here are some best practices to keep your extensions rock-solid:
1. Keep the Output Clean
SNMP isn’t great at handling messy or verbose output. Your script should return a single line (or a predictable multi-line format) that’s easy to parse.
Example good output:
1025360 /var/spool/rsyslog
Example bad output:
File size is currently: 1025360 bytes
Analyzed at: 2024-12-01 10:45:00
2. Use Absolute Paths
Don’t assume snmpd knows where bash, du, or python3 lives. Use full paths to every command you reference:
#!/bin/bash
/usr/bin/du /var/log/syslog
3. Run as the snmp User During Testing
SNMP extensions run as the same user that starts the snmpd service, often snmp. That user may have limited permissions. Always test your script like so:
sudo -u snmp /path/to/your/script.sh
4. Make It Fast
SNMP has short timeout windows. If your script takes longer than a few seconds, SNMP may give up, or worse, slow down your whole monitoring workflow.
Avoid loops, sleeps, or large output unless absolutely necessary.
For anything complex, consider caching results in a temp file and having your script return them instantly
5. Fail Gracefully
If something goes wrong, like a missing file or permission issue, your script should still return a line of output (and maybe an exit code). That way, you can catch failures and avoid breaking the whole walk.
6. Avoid Interactive Prompts
No read, no user input, no password prompts. Your script should never require manual intervention.
7. Output Only What You Need
LogicMonitor will do the formatting, graphing, and alerting. Your job is just to return the right number or status.
8. Add Logging During Development
While testing, it helps to log to a temp file just to see what’s going on:
echo "$(date) :: Ran extend script" >> /tmp/snmp-extend-debug.log
Just don’t leave that in production. Especially if it runs every 5 minutes.
Monitor What SNMP Was Never Meant to See
snmp extend might feel like a workaround from another era, but it’s still a reliable way to surface custom metrics from your Linux servers, with no agents required. With just a few lines in your config and a little scripting, you can unlock visibility into exactly what matters to your environment.
And once that data’s in LogicMonitor? You can graph it, alert on it, trend it, and move on with your day.