OpenTelemetry is a project by the Cloud Native Computing Foundation aimed to standardize the way that application telemetry data is recorded and utilized by platforms downstream. This application trace data can be valuable for application owners to understand the relationship between the components and services in their code, the request volume and latency introduced in each step, and ultimately where the bottlenecks are that are resulting in poor user experience. Python is one of the many languages that OpenTelemetry supports, and Flask is a popular lightweight framework that is used to create web applications. Below we will cover the steps involved to instrument a basic Flask application.
Create a file “app.py” under the root project directory “instrument-flask-app”:
Instrument-flask-app
	|___ app.py
Import the following libraries:
from flask import Flask
from opentelemetry import trace
from opentelemetry.sdk.trace import TracerProvider
from opentelemetry.instrumentation.flask import FlaskInstrumentor
from opentelemetry.sdk.trace.export import BatchSpanProcessor,          ConsoleSpanExporter
from opentelemetry.exporter.otlp.proto.grpc.trace_exporter import   OTLPSpanExporter
Create a Flask app instance:
app = Flask(__name__)
Construct trace provider:
trace.set_tracer_provider(TracerProvider())
Init span exporter:
The exporter is the component in SDK responsible for exporting the telemetry signal (trace) out of the application to a remote backend, log to a file, stream to stdout. etc. In this example, we are creating a gRPC exporter to send out traces to an OpenTelemetry receiver backend running on localhost.
You will have to set the environment variable LMOTEL_ENDPOINT which is the endpoint of the OTEL collector. The traces would be emitted by following:
export LM_OTEL_ENDPOINT=http://<HOSTNAME>:<PORT>
Create resource detector:
The resource describes the object that generated the Telemetry signals. Essentially, it must be the name of the service or application. In LogicMonitor, you can use these attributes to map to a device or resource that you’re already monitoring within LogicMonitor.
Service.namespace: Used to group the services. For example, you can use this to distinguish services across environments like QA, UAT, PROD.
Service.name: The logical name of the service.
Host.name: Name of the host where the service is running.
if __name__ == "__main__": # on running python app.py
app.run() # run the flask app
Putting it together:
# app.py
from flask import Flask
from opentelemetry import trace
from opentelemetry.instrumentation.flask import FlaskInstrumentor
from opentelemetry.exporter.otlp.proto.grpc.trace_exporter importOTLPSpanExporter
from opentelemetry.sdk.trace import TracerProvider
from opentelemetry.sdk.trace.export import BatchSpanProcessor,ConsoleSpanExporter
app = Flask(__name__)
trace.set_tracer_provider(TracerProvider())
# To print the traces on the console
trace.get_tracer_provider().add_span_processor(BatchSpanProcessor(ConsoleSpanExporter()))
# To send the traces to the configured OTEL collector
trace.get_tracer_provider().add_span_processor(BatchSpanProcessor(
OTLPSpanExporter(endpoint=os.environ.get("LM_OTEL_ENDPOINT"), insecure=True)))
@app.route("/hello")
def hello():
   return "Hello World!"
if __name__ == "__main__":
app.run()
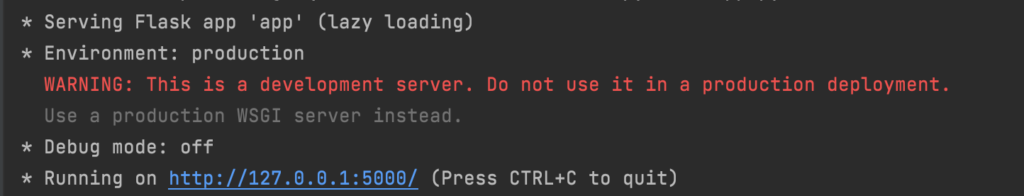
Test our application
Let’s test our application by running the Python app. You should the server started as below:
python app.py
Success!
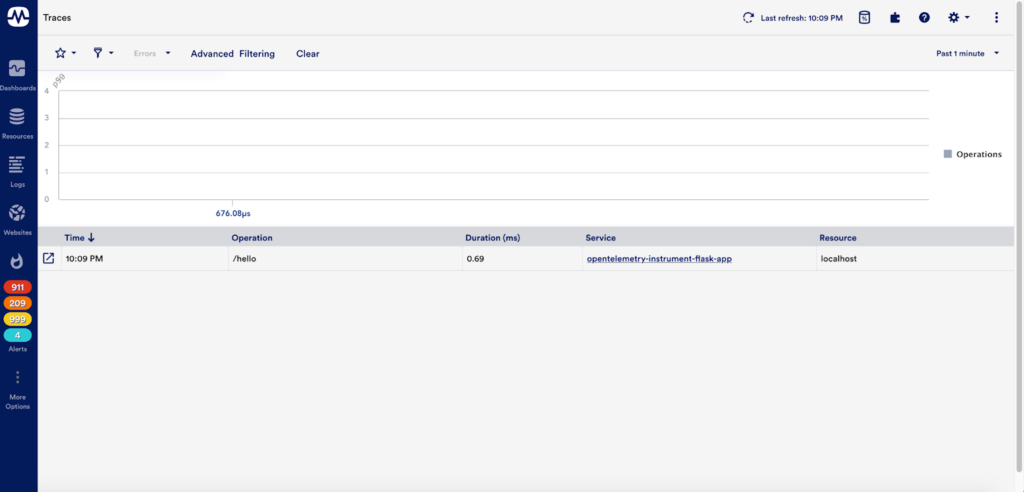
You should be able to see the traces on the LogicMonitor portal after hitting the endpoint (“http://127.0.0.1:5000/hello”) from your browser:
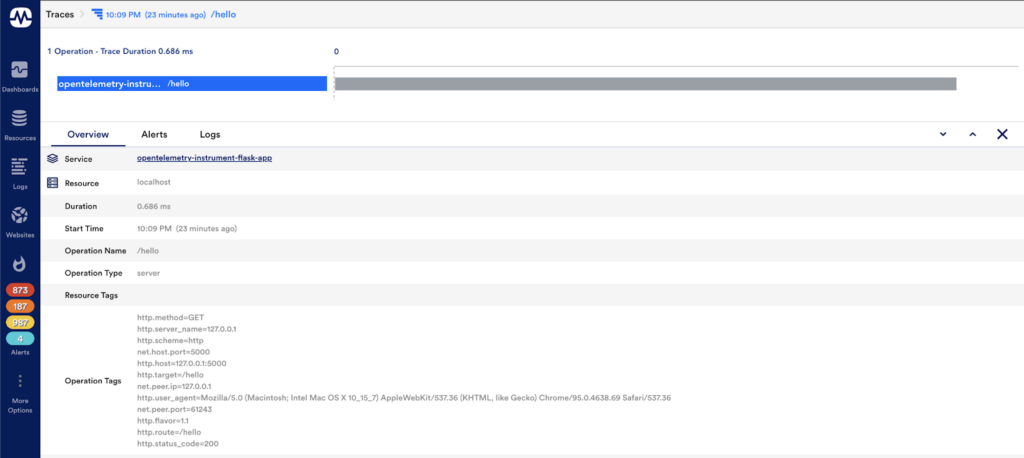
You can view additional information by clicking on the trace:
The traces on the console would look like this:
Next Steps
Congratulations, you have instrumented a flask-based Python application emitting traces using the OpenTelemetry Protocol (OTLP) Specification! Now, you’ll have visibility into your application and be able to address any potential bottlenecks present in your application code. If you’re already using LogicMonitor to monitor your infrastructure or collect logs, you’ll be able to associate these traces for faster troubleshooting.
If you’re not already sending in logs, try it out here to further enrich how much context you can bring into LogicMonitor.
External Resources
We recommend the following resources to learn more about OpenTelemetry and CNCF: