How To Monitor Almost Anything: Lifehacking Diabetes
Antony Hawkins, Sr. Sales Engineer at LogicMonitor, leveraged LogicMonitor's extensibility to build a DataSource to monitor his wife’s diabetes. With real-time metrics available via dashboards on LogicMonitor's mobile app sharing collected metrics with healthcare professionals is easier than ever. Check out our latest blog post to find out how he did it!
What can you monitor with LogicMonitor? There are only two limitations.
As a Sales Engineer, I’m often asked questions like “Do you monitor (insert specific technology resource here)?”. Equally often, I’m asked whether and how easily LogicMonitor’s core abilities can be extended to gather metrics from any resources that may be specific to the customer.
For the first question the answer is usually “Yes, we do”. We have a vast range of over 1,500 monitoring integrations included out of the box, with more being added all the time by our Monitoring Engineering team, which collectively pull data through a large number of protocols and methods.
For the second question, the answer is “Yes, and very easily”, subject to two limitations:
What data the resource exposes that we can reach
Your imagination
I suspect most people hearing this assume that because I’m a Sales Engineer I’m being “a sales guy” and embellishing. If that’s you, then I must disappoint you – I’m an Engineer who works in Sales, not a Salesman who does Engineering. Even so, I also imagine most people think I’m only talking about infrastructure. Not at all.
My wife was diagnosed as a type 1 diabetic around the age of 2. Without giving away her age, Liz has seen a lot of monitoring and treatment devices over the years, some of which look positively medieval today.
The ‘Palmer Injector’ fired insulin into the patient from a syringe held in the bolt jaws.
When we first met, monitoring one’s diabetes involved stabbing yourself in a thumb (often repeatedly) to get a blood sample then waiting a half a minute for a spot reading; controlling it meant stabbing yourself in the arm or leg a few times a day to inject a bolus of insulin. Every few months you’d also visit your Diabetes Consultant and based on that sparsity of data and some further hospital tests, you’d likely be told your control should be better – and poor control can lead to any number of highly unpleasant and often life-threatening additional health problems.
Can you imagine making decisions about load and demand within your technology estate by looking at instantaneous CPU utilisation every four hours or so? Or guessing whether your website was coping with visitor demand while you slept, by checking it was up before you went to bed and then again at breakfast time?
Can you imagine presenting that data to your CEO and attempting to use it to justify a technology investment, or as the basis of a long-term strategy?
Happily, many brilliant minds have since invented insulin pumps, Continuous Glucose Monitoring (CGM) devices and associated readers that offer a much better class of monitoring. These are not cheap, but they give the user far better insight and permit much better control, which in turn can save the NHS (offer valid in the UK only; other healthcare providers are available) or patient far more in the long term, by not having to deal with (and suffer) health complications later on.
More recently, other brilliant minds have written mobile apps that turn a phone into a display head; being communication devices they can also send that data elsewhere.
These hardware and software elements combine to provide a service which takes a reading every five minutes and pushes it to the cloud – specifically in our case mLab.com, the Database as a Service provider for MongoDB. LogicMonitor already knows how to talk to MongoDB and even if we didn’t, MongoDB has an API and we know how to talk to APIs.
I was, therefore, able to easily create integrations to stand atop the shoulders of these giants, that poll the MongoDB instance for Liz’s blood glucose data, hardware data such as the battery charge state of the CGM reader and phone, and data about the database itself, such as file size allocation and usage.
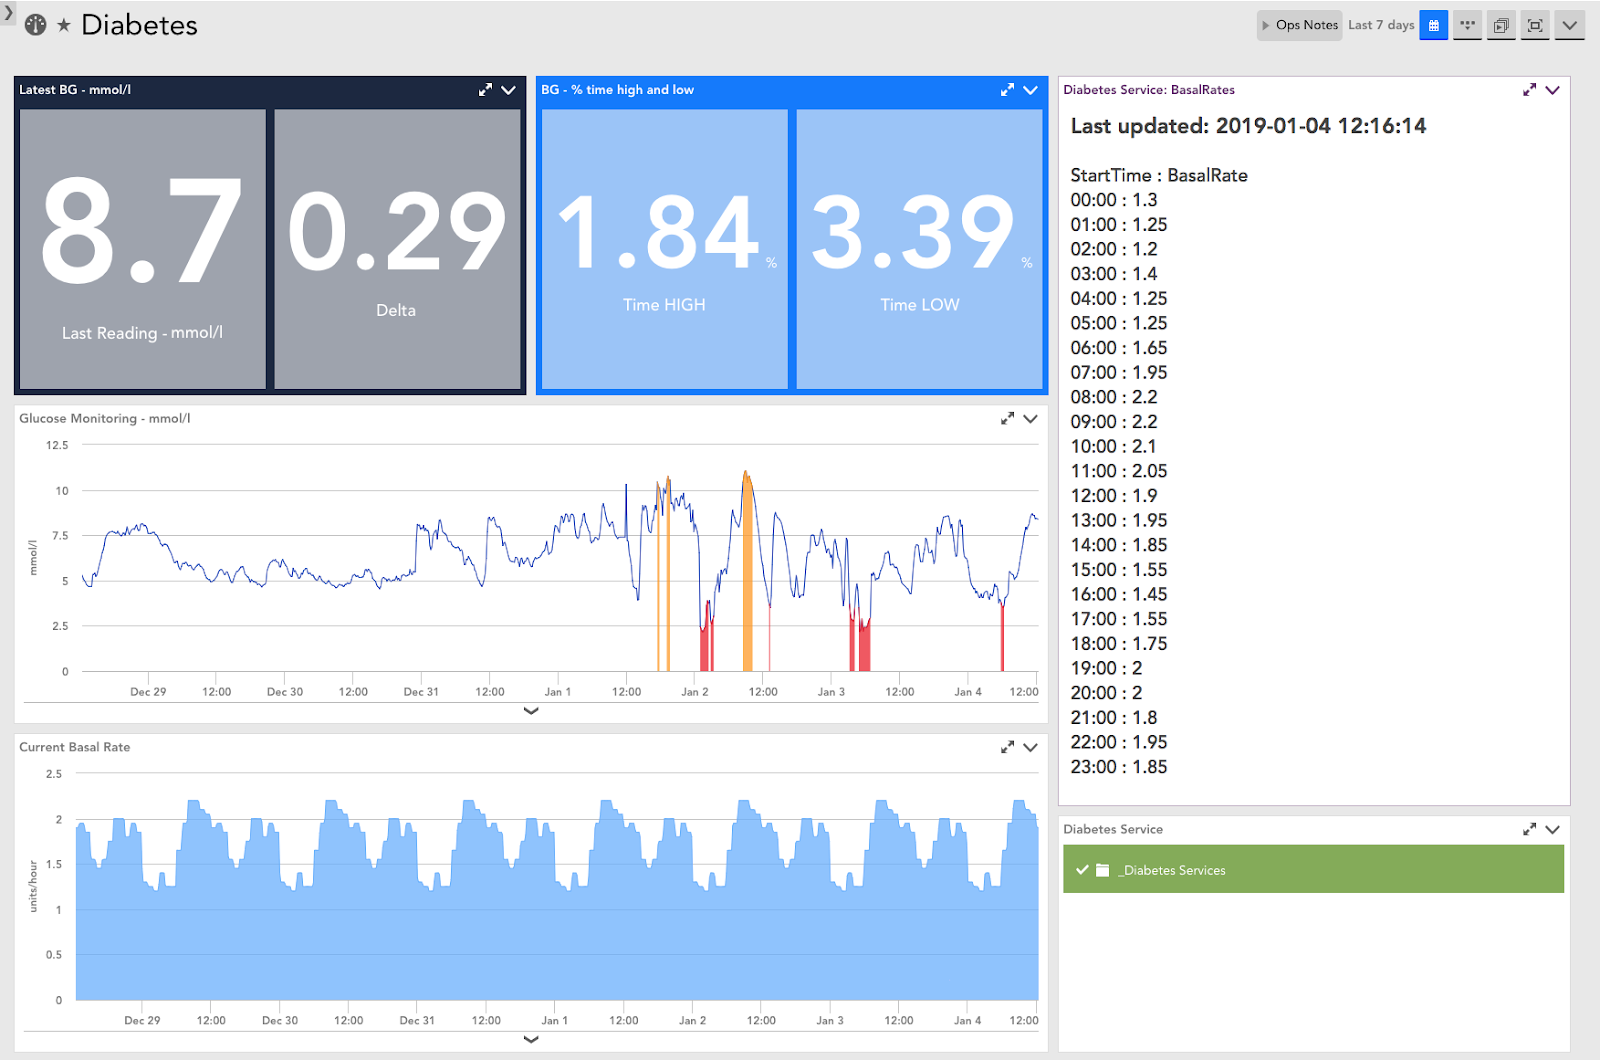
The pump itself is air-gapped, but Liz maintains a Google spreadsheet of basal (background insulin infusion) rates, for personal reference and hospital visits. As this document is accessible via Google’s API, its data can similarly be brought into LogicMonitor.
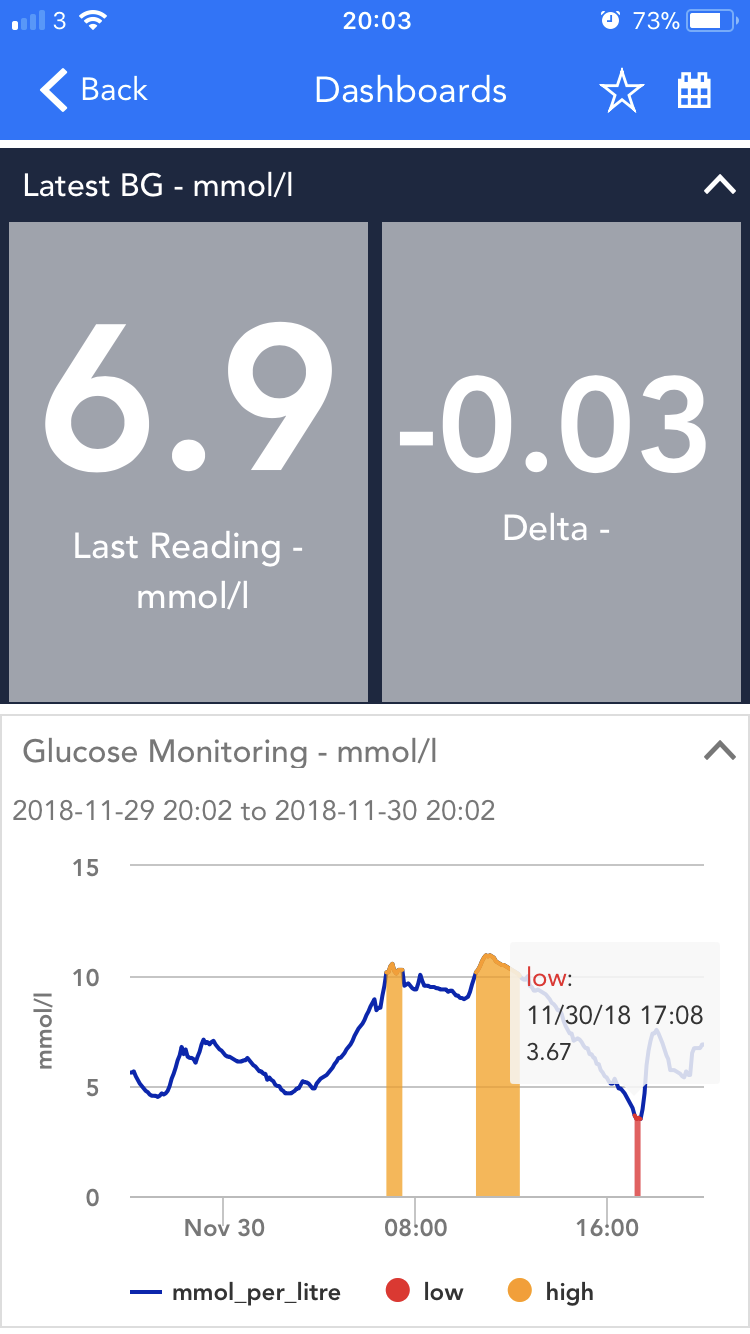
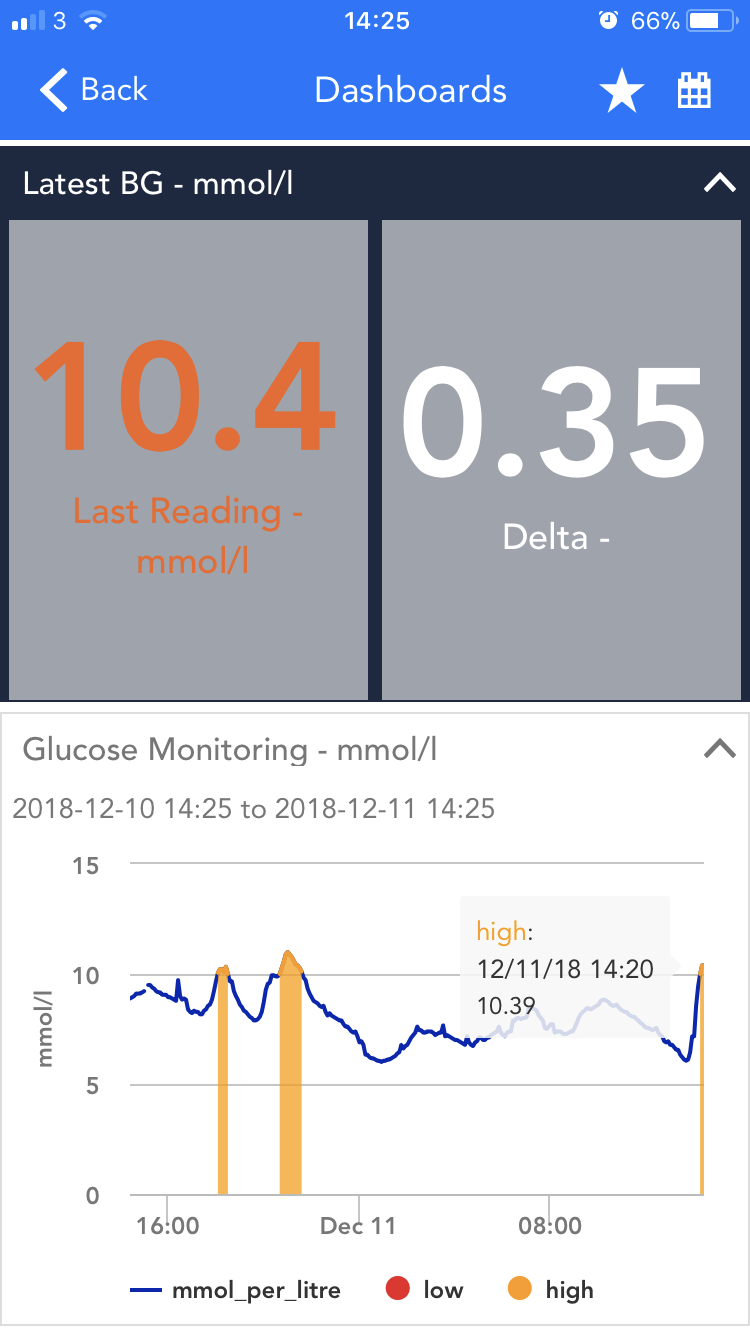
This data is all correlated into a single Service Insight within LogicMonitor and with our Dashboard sharing options and Role Based Access Control, all this data is instantly available to Liz, to me, and to whichever of her healthcare professionals we choose to pass it to, in any browser and in the LogicMonitor mobile app. Periods of time spent above or below a defined acceptable blood glucose range are easy to alert on and can be visualised with different colours in our widgets. With up to two years of non-aggregated data retained, we’ll be able to see and review the long-term effects of any changes to treatment plans and insulin infusion rates; changes that can be marked in LogicMonitor with OpsNotes.
Mobile Dashboard view with key metrics, shown in mmol/l. The data can equally be shown in mg/dl depending on user preference.Desktop Dashboard view showing a wider range of metrics.
On a personal level, that’s pretty cool, right?
Now put your business head on, and let me recap:
LogicMonitor is gathering and combining mission-critical data from multiple sources and enabling access to it in an easy-to-understand format that can show current values alongside months of historic data, to whoever needs to see it, whenever they need it.
On a day-to-day operational level this gives a real-time visualisation of activity and response to change, and the ability to alert on data as it approaches or exceeds acceptable limits such that pre-emptive (or, in the worst case, corrective) action can be taken.
On a strategic level it enables long-term reviews of performance, the identification of daily, weekly or monthly patterns, and whether and how that performance has changed over time in response to changes in practice. It can show a need to make changes. It can inform and guide decision-making. It demonstrates proof of value for investments.
Who wouldn’t find that useful?
Disclaimer: The views expressed on this blog are those of the author and do not necessarily reflect the views of LogicMonitor or its affiliates.