Learn what can be monitored with AWS Elastic Load Balancer, how to add meaningful metrics to your monitoring, and how to use anomaly detection for ELB.
Amazon Web Services Elastic Load Balancer (AWS ELB) enables websites and web services to serve more requests from users by adding more servers based on need. Unhealthy ELB can cause your website to go offline or slow down dramatically.
In this article, we will cover:
The available metrics
How to add more meaningful calculated metrics
The key metrics?
Which metrics to use Anomaly Detection on
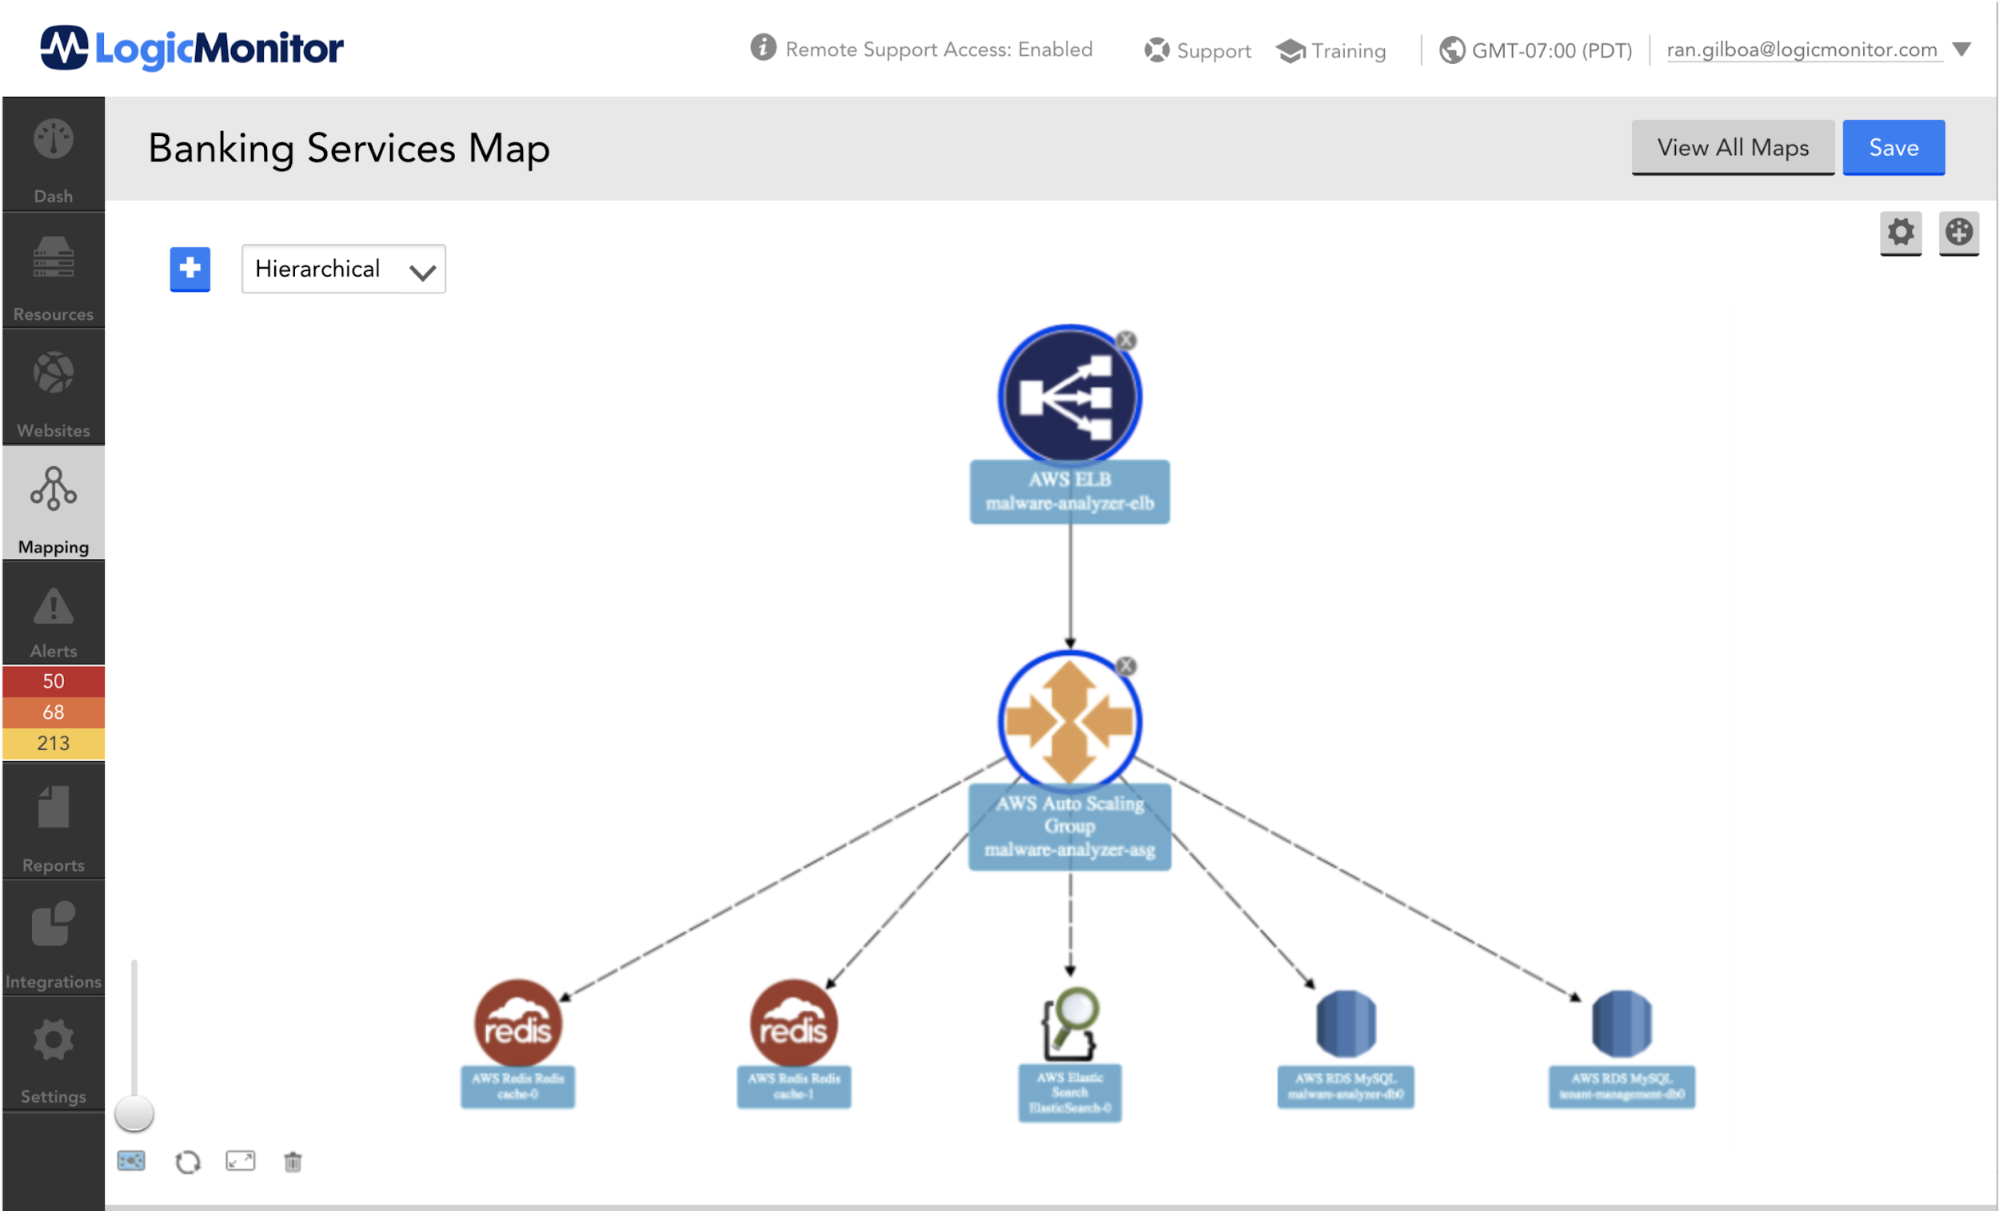
What is ELB (Elastic Load Balancer)?
Elastic Load Balancing automatically distributes incoming application traffic across multiple Amazon EC2 instances. It enables you to achieve fault tolerance in your applications, seamlessly providing the required amount of load balancing capacity needed to route application traffic.
AWS Cloudwatch Metrics
Elastic Load Balancing publishes data points to Amazon CloudWatch for your load balancers and your back-end instances. CloudWatch enables you to retrieve statistics about those data points as an ordered set of time-series data, known as metrics.
Why Should I Add My Own Metrics?
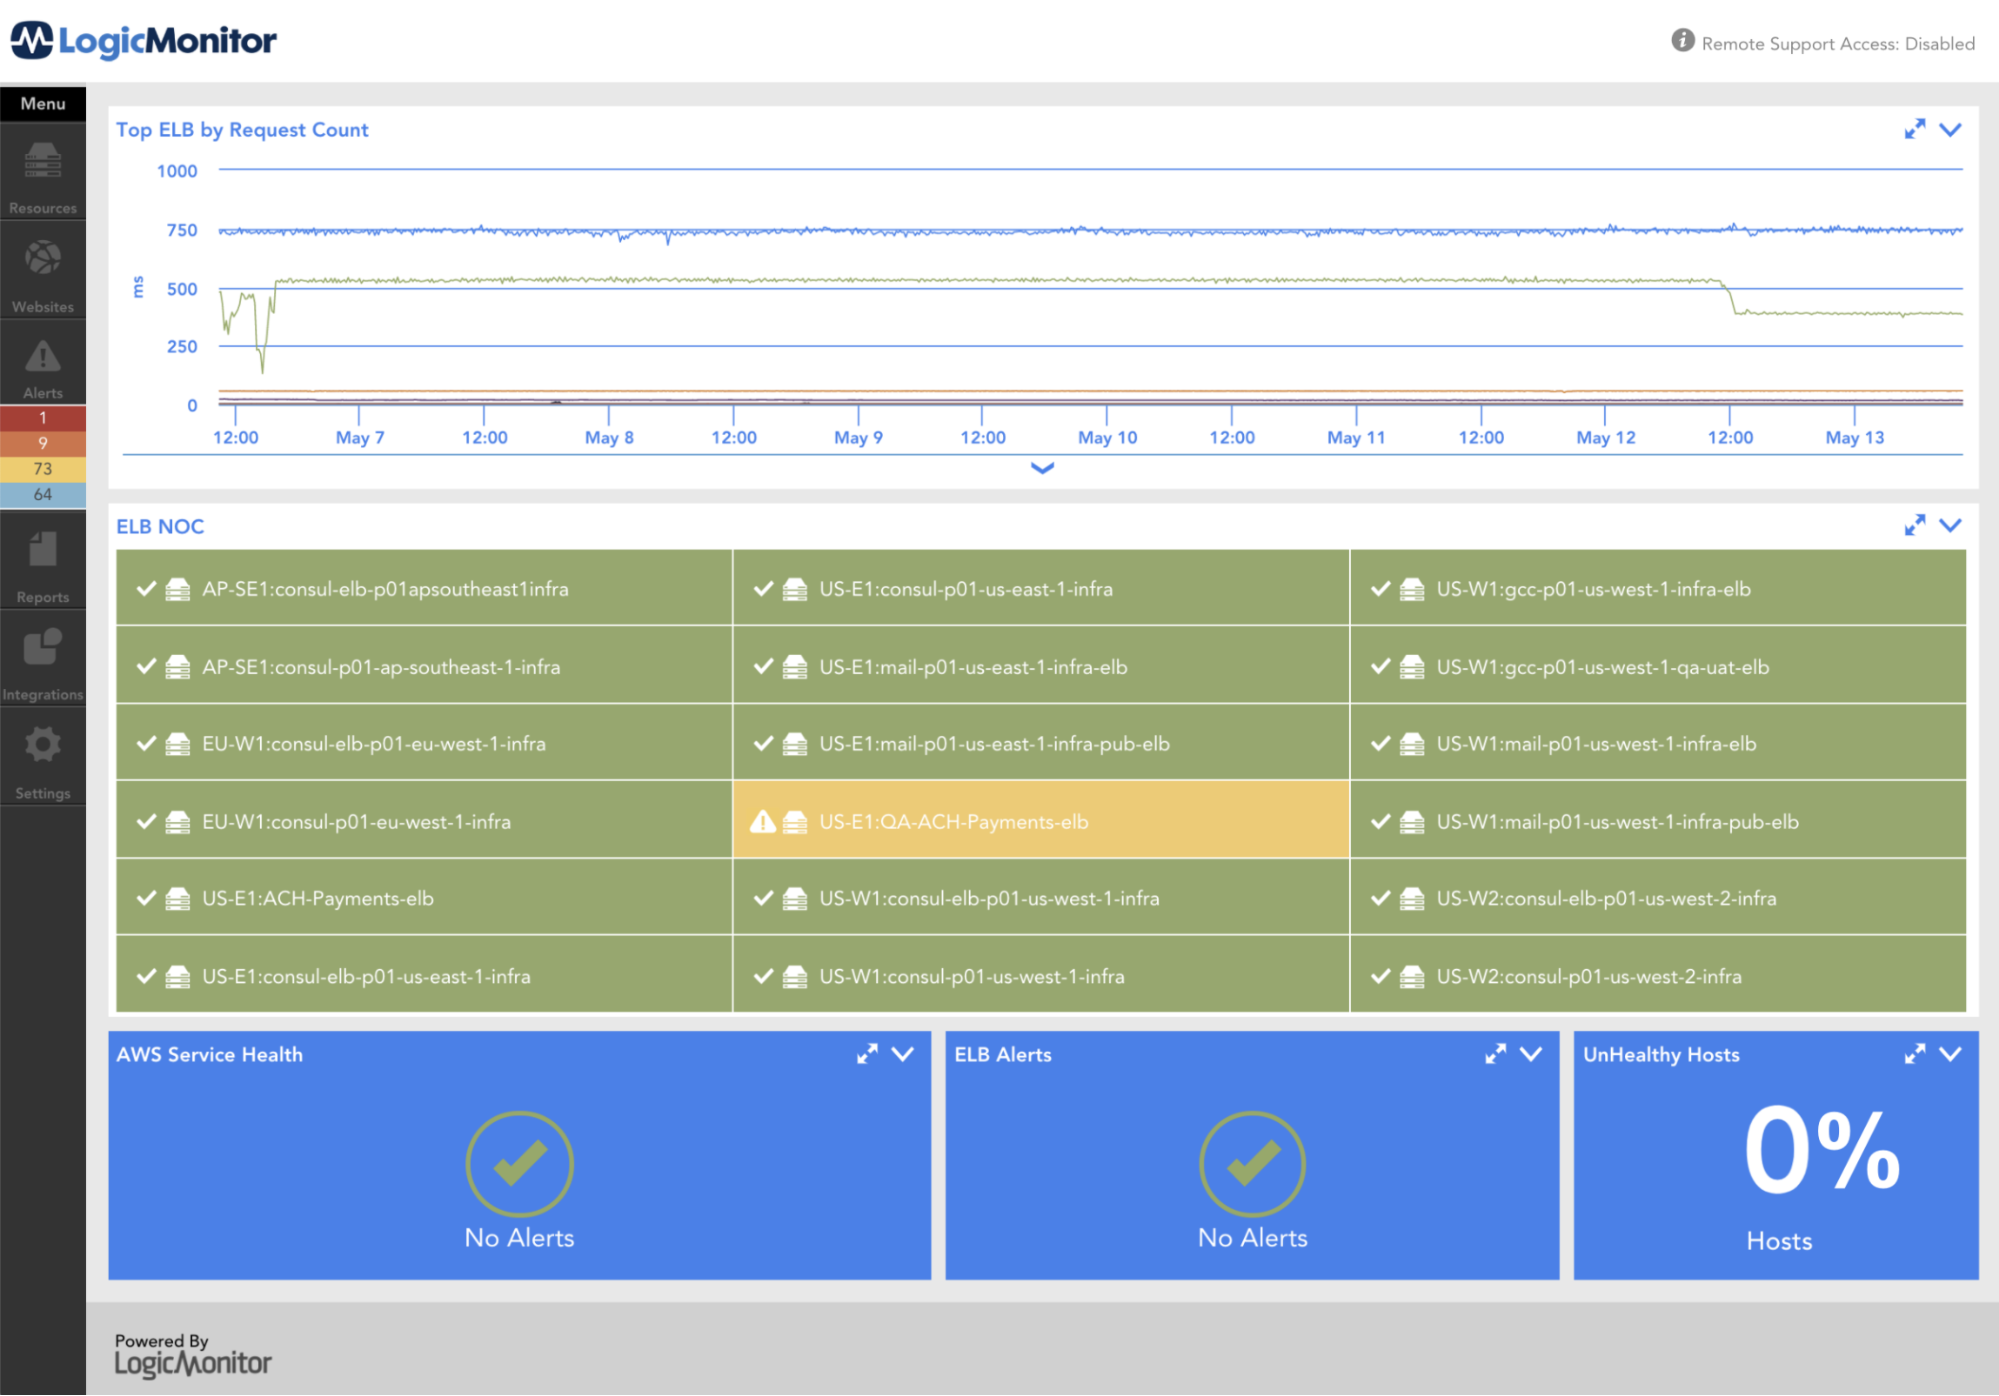
Let’s look at UnHealthyHostCount, UnHealthyHostCount is the number of target EC2 Instances that are considered unhealthy. By itself, it is not saying much. Consider the next question: Is the value 2 for the UnHealthyHostCount metric good or bad? And how good (or bad) is it?
Usually, when I present this question, the person would say, “It depends how many EC2 instances the ELB has”.
Scenario 1
Number of EC2 instances managed by ELB: 2
ELB status: Fatal, the ELB is non-operational, 100% of the EC2s are unhealthy.
Prioritization: The problem is critical and we should fix it NOW. We are losing money!
Scenario 2
Number of EC2 instances managed by ELB: 4
ELB status: Error, the ELB might not support the Load, 50% of the EC2s are unhealthy.
Prioritization: Address the problem according to the normal prioritization process.
Scenario 3
Number of EC2 instances managed by ELB: 20
ELB status: Warning, not a big concern, 10% of the EC2s are unhealthy.
Prioritization: The problem is minor. It may eventually disappear by itself but keep an eye on it to make sure it is not escalating.
It’s important to note that trying to place an alert on a metric such as an unhealthy host count is not very useful. Even if we chose a number that works now, it is possible that we would change the size of the cluster that the ELB is serving (or just used Auto-Scaling-Group), and render the alert useless.
A complex datapoint, calculate the % of Queue, based on the SurgeQueueLength metric.SurgeQueueLength is the total number of requests (HTTP listener) or connections (TCP listener) that are pending routing to a healthy instance. The maximum size of the queue is 1,024. Additional requests or connections are rejected when the queue is full. For more information, see SpilloverCount.
SurgeQueueRate= SurgeQueueLength / 1024
SpilloverCount
The total number of requests that were rejected because the surge queue is full.
[HTTP listener] The load balancer returns an HTTP 503 error code.
[TCP listener] The load balancer closes the connection.
BackendConnectionErrors
The number of connections that were not successfully established between the load balancer and the registered instances. Because the load balancer retries the connection when there are errors, this count can exceed the request rate. Note that this count also includes any connection errors related to health checks.
What Should I Enable Anomaly Detection On?
While using Anomaly-Detection and Static thresholds for key metrics is expected, there are other use-cases.
Example 1
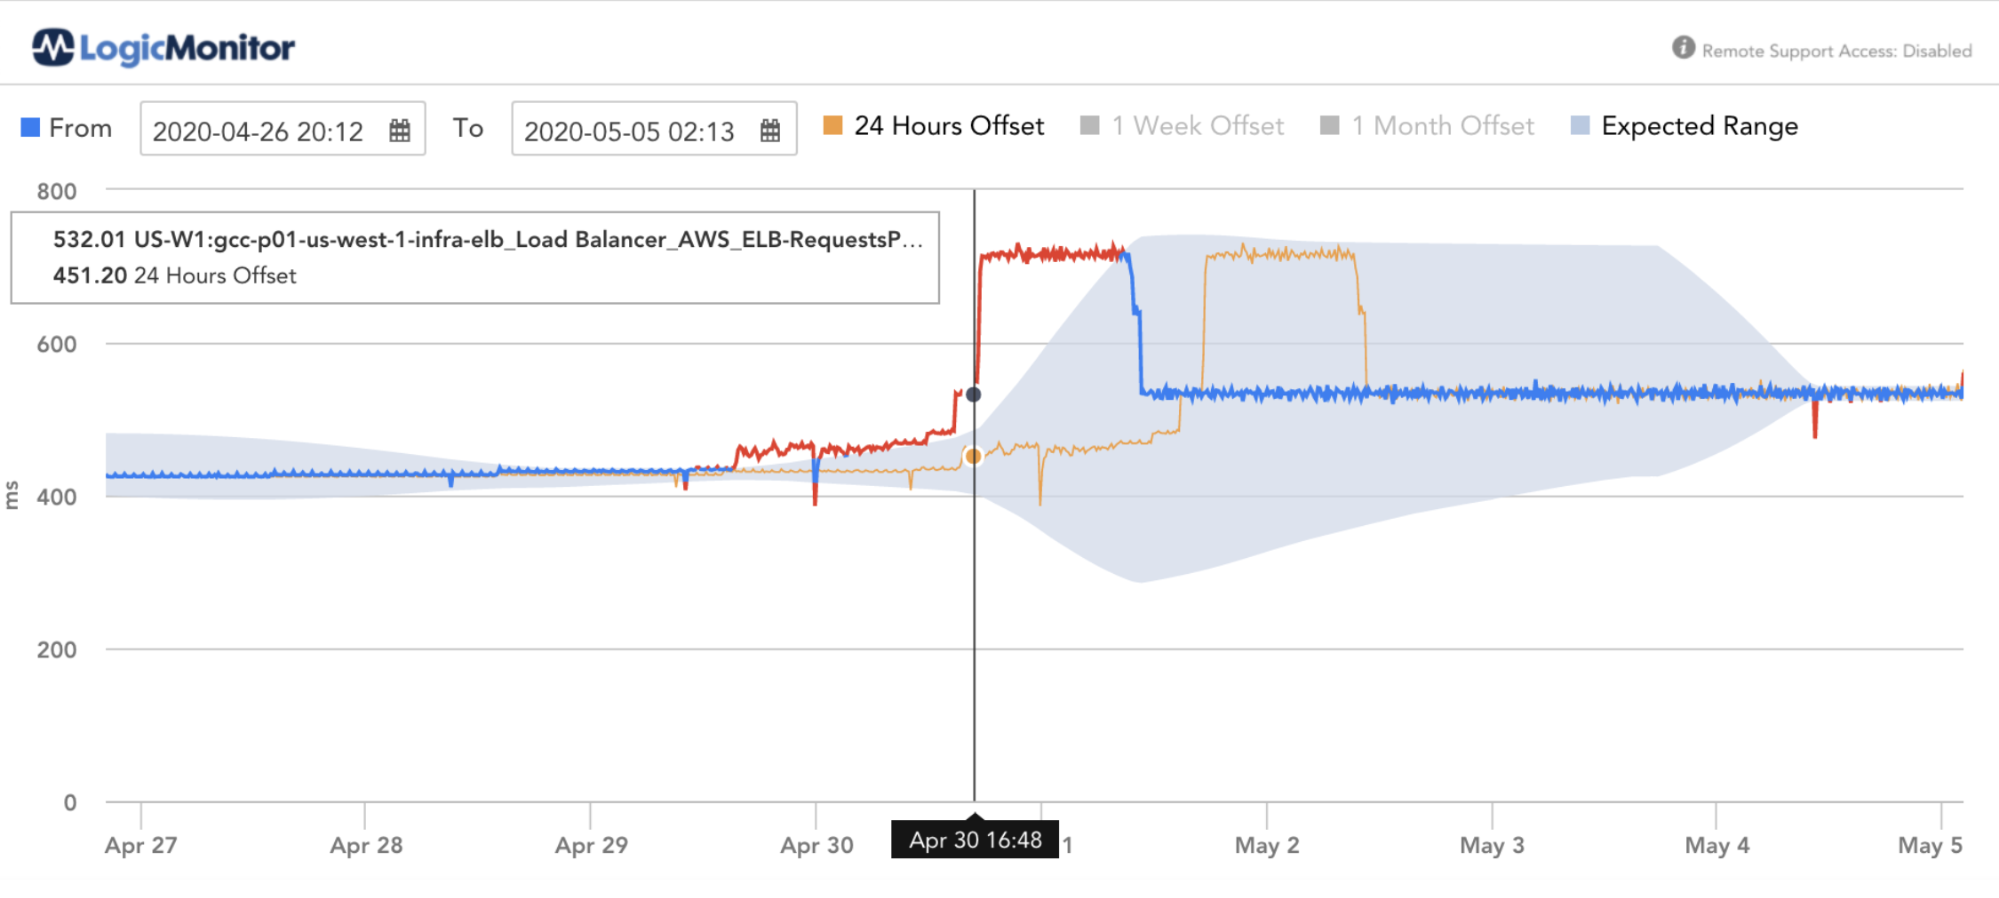
Enabling Anomaly-Detection for requests-per-second can identify unexpected load, this unexpected load can be a result of AWS ELB denial of service attack (more info about AWS (DDoS) attack).
Example 2
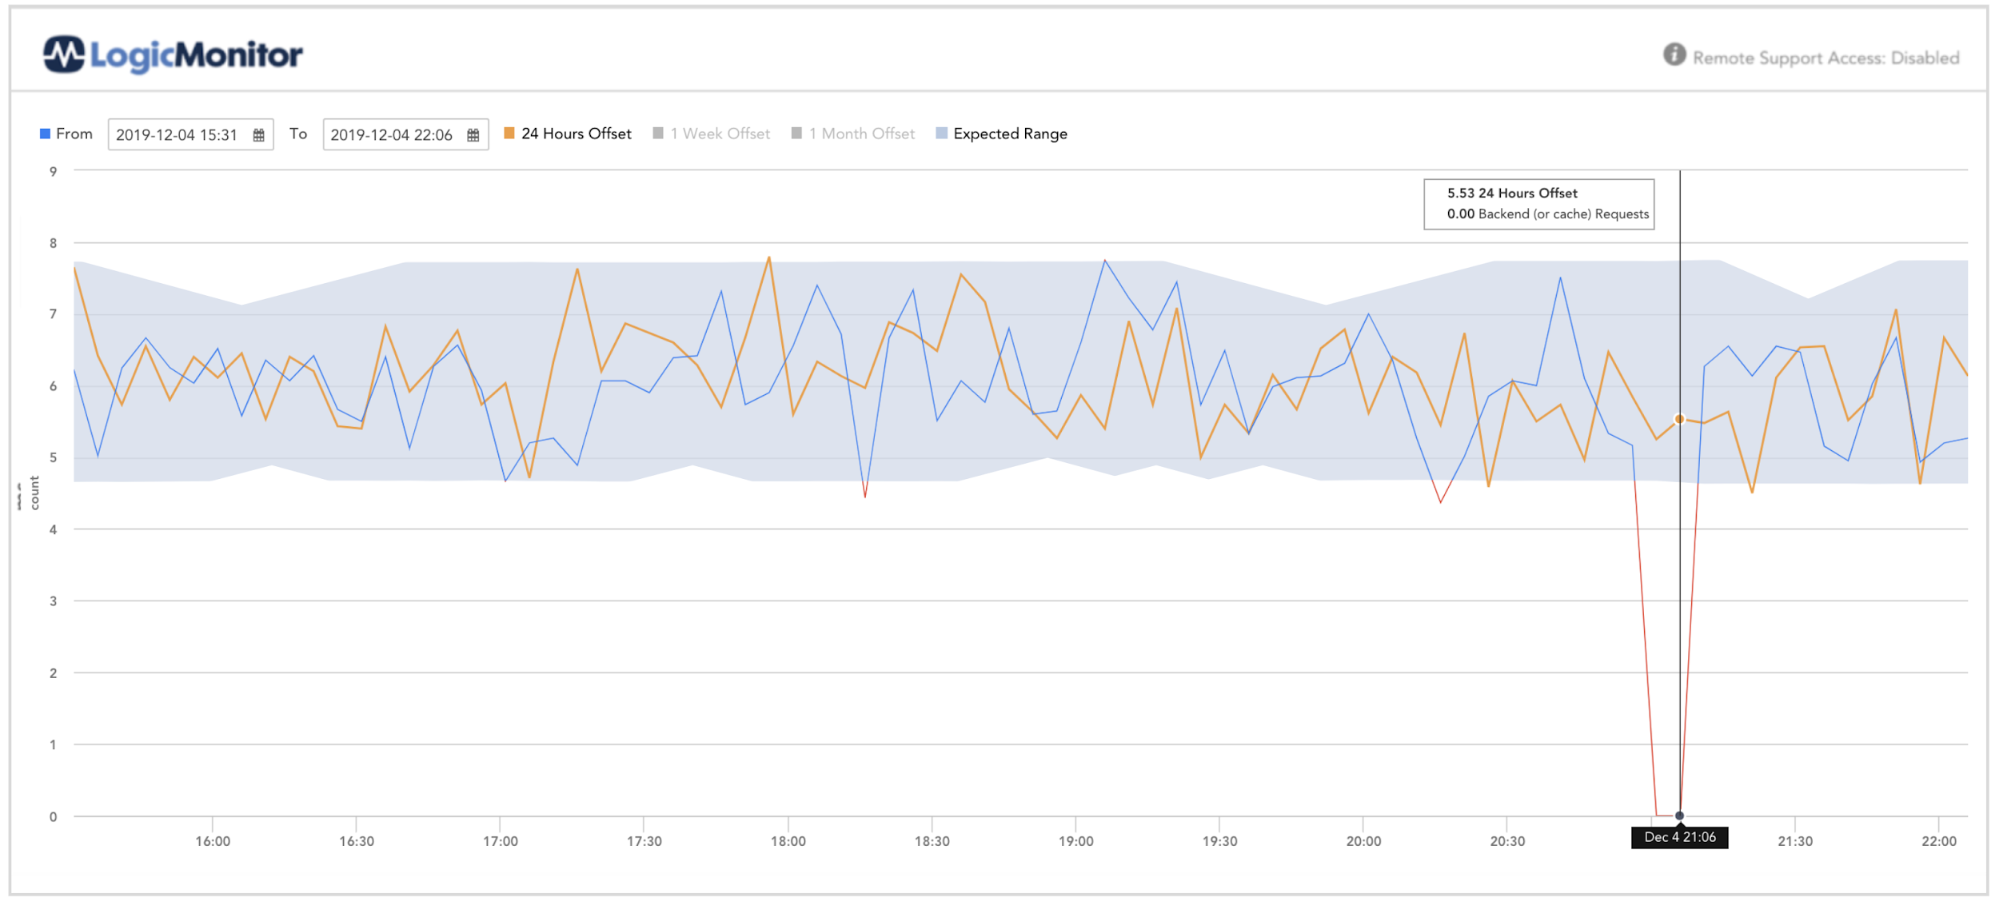
When requests dropping to zero can indicate a remote error (r.g. IOT device stop collecting signal).
Disclaimer: The views expressed on this blog are those of the author and do not necessarily reflect the views of LogicMonitor or its affiliates.