How to Monitor Cloud Costs More Effectively using Tags
Cloud spend can get out of control quickly. With LogicMonitor's tagging capabilities you can easily monitor and manage dynamic cloud services, find out how in our latest blog post.
Applying consistent tags to your cloud resources can help improve the way you organize and manage your cloud environment. For example, tagging based on environment and application enables you to quickly identify all production resources supporting a specific application. Maybe you want to target automation processes at these resources or exclude them from a specific access role. Tags enable you to do that easily and manage your cloud environment in a way that makes sense for your business.
Currently, over 50% of the AWS, Azure and Google Cloud Platform (GCP) resources monitored across the LogicMonitor customer base are tagged. LogicMonitor automatically discovers these tags for all monitored cloud resources and adds them as properties, so customers can use them to group and visualize their monitored cloud resources. In addition to making cloud resource management and organization clearer, tags also help make monitoring cloud costs more meaningful.
Optimize cloud spend
Cloud services are dynamic, making it easy to scale infrastructure and applications quickly, but also pose a risk of racking up cloud costs equally quickly. One of the key components of LM Cloud, and an important factor in avoiding cloud sticker shock, is the ability to monitor cloud spend. Today’s cloud providers charge at a granular scale (down to the second in most cases) to account for the lifetime of ephemeral cloud resources. While this helps to ensure that customers are charged only for what they use, it also makes monitoring spend more complicated. One simple way to make monitoring cloud spend easier — and the analysis of cloud infrastructure costs more powerful — is to break it down based on tags. Tracking costs per tag allows you to attribute these costs to a function or specific area of your business, and determine where costs can be cut.
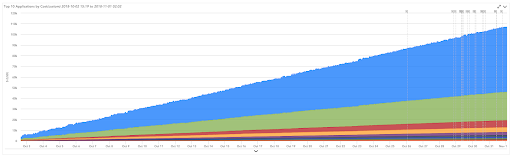
LogicMonitor includes the ability to monitor cloud spend and break it down by tags out of the box. Simply provide read-only credentials to your cloud environment and billing data (e.g. Azure AD application with read-only access to subscriptions), tell us which tag keys you’d like to see costs monitored for, and we’ll take it from there! All tag values will be automatically discovered for the specified key(s), and spend will be monitored for each. This enables you to specifically identify what’s costing the most in your cloud environment, and where spending can be optimized. For example, monitoring cost for an environment where resources are tagged by application would allow you to identify and pinpoint the applications you’re spending the most to run.
Azure spend monitored per application, where resources are tagged by application.
Increase visibility with tags
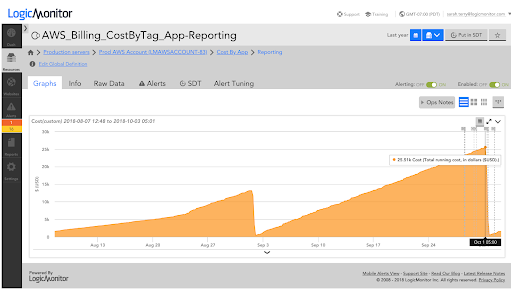
In addition to identifying top costs, monitoring spend by tag allows you to attribute trends and changes in cost to something specific. For example, the following graph shows spend roughly doubling for a specific application between August and September:
AWS spend monitoring for a specific reporting application, where resources are tagged by application.
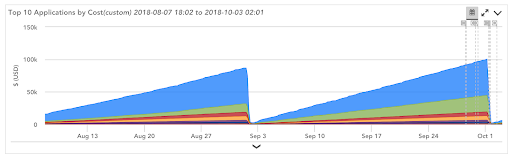
Absorbed into a larger bill, this jump in spending may have been difficult to explain. Displaying costs by application tag clearly shows that this increase of about $10K is attributed to a specific reporting application shown here (in green):
AWS spend monitored per application, where resources are tagged by application (reporting application in green).
You may be able to recover some of these costs by sizing the instances underlying the reporting application differently, or you may also want to look into whether there’s an issue with the application itself. At this point, analyzing monitored infrastructure alongside monitored spend helps you further identify opportunities to control cloud costs.
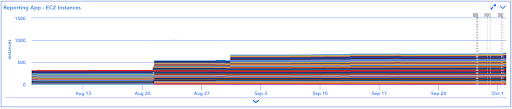
For our reporting application, the change in cost is due to a significant increase in the number of EC2 instances running the application. This is clear when looking at the monitored instance count alongside the application cost for the same two-month time frame:
A graph displaying EC2 Instance count over time.
Identify optimizations with LogicMonitor
Similar to how tags can be used to improve cloud environment management and organization, they can also be used to effectively monitor cloud costs and optimize spending. A monitoring tool capable of monitoring these cloud costs and presenting spend per tag can help pinpoint where you’re spending the most and where there’s an opportunity to optimize. Monitoring infrastructure and application performance data and presenting it alongside cloud costs helps identify whether those optimizations should be made for the application itself or for the resources that support the application. With LogicMonitor you can do it all out of the box.
If you’re already a customer, we can help you get tags set up quickly. If you aren’t, and you want to see dynamic cloud monitoring and cost management in action, start a free trial today.
Disclaimer: The views expressed on this blog are those of the author and do not necessarily reflect the views of LogicMonitor or its affiliates.