If your UDM Pro has started responding slowly or you need to reboot it more often than usual, high memory or CPU usage may be the root cause.
Why?
Because UniFi’s built-in tools provide limited visibility.
The controller dashboard offers a few basic statistics, but it doesn’t retain historical data, generate alerts, or help you determine whether a slowdown is temporary or part of a larger pattern.
And that level of uncertainty isn’t manageable if you’re supporting multiple sites or customer networks because small issues can escalate quickly without centralized visibility or alerts.
In this article, we will explain how to monitor CPU and memory usage on the UDM Pro in real time, interpret those metrics, and set up external monitoring for ongoing visibility and faster troubleshooting.
TL;DR
CPU and memory spikes on the UDM Pro are often caused by resource-heavy services like UniFi Protect, DPI, or IDS/IPS
UniFi’s built-in dashboard provides only limited insight, with no historical tracking or real alerting
Workarounds using SSH scripts or LogicMonitor modules provide full monitoring capabilities across UniFi devices
Upgrading to UDM SE or Pro Max may reduce the need for constant troubleshooting by better handling resource loads
Why Monitor CPU Memory on the UDM Pro
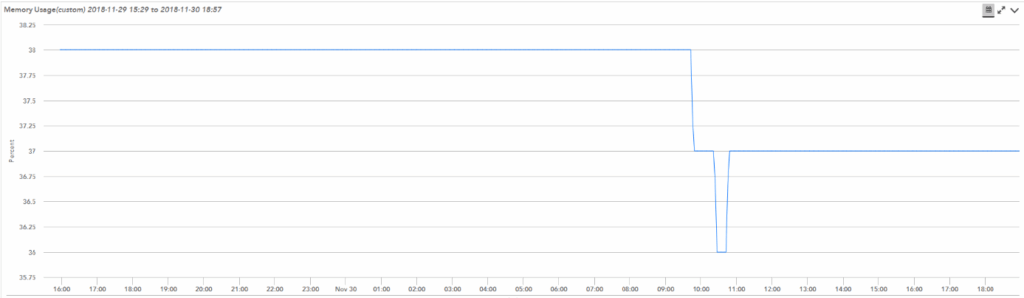
Running a UDM Pro without keeping tabs on memory and CPU usage is like flying a plane without a fuel gauge. It works, until it doesn’t. These metrics give you early signals when something’s going sideways, whether it’s a performance dip or a full-on stall.
When memory fills up or the CPU spikes, services like Deep Packet Inspection (DPI), IDS/IPS, or UniFi Protect can freeze, crash, or start acting weird. You might not even notice right away, until users start complaining or the network cuts out.
Some of its common symptoms include:
Memory hovering above 90% for no obvious reason
CPU utilization maxing out during low traffic periods
Systems requiring frequent manual reboots
The built-in UniFi dashboard shows some of this, but it’s limited. There’s no historical data, no alerting, and no easy way to track changes over time.
Monitoring Options For UDM Pro
The UniFi dashboard displays basic CPU and memory usage, but it offers little value during performance incidents. It provides a single point-in-time snapshot. That’s why some users try to extend visibility using the UniFi API.
While this approach can return more granular data, it introduces significant overhead. Each API call hits the UniFi controller directly, which can impact performance when monitoring multiple devices or polling frequently. It also creates a single point of failure: if the controller goes offline, monitoring stops entirely.
Some even try SNMP. However, SNMP support on the UDM Pro is inconsistent. Ubiquiti’s implementation often fails to expose reliable memory metrics, and CPU data can be intermittent or missing altogether.
You get a snapshot, not a timeline. So you never really know if a slowdown is a fluke or the start of a bigger problem.
Set Up Advanced Monitoring with LogicMonitor
The built-in monitoring options on UDM Pro are fine, for a glance. But if you’re looking for historical data, proactive alerts, or centralized visibility across your infrastructure, you’re going to need more.
And LogicMonitor provides that.
It lets you track CPU and memory usage on UniFi devices even though Ubiquiti doesn’t expose that data natively via SNMP.
So how can you leverage LogicMonitor here?
You can use its extensibility to run secure, lightweight scripts via Secure Shell (SSH). To do so, you have two options:
Use Prebuilt Modules from LM Exchange (Recommended)
If you want to skip the scripting and get straight to monitoring, LogicMonitor Exchange has ready-made modules that can do this for you. Here’s what you have to do:
Search for codes 6H7TE3 and J9NFZJ in the LM Exchange.
Import them to your portal.
These modules collect CPU and memory metrics directly from your UniFi devices using secure SSH authentication. They’re tested, supported by the community, and a lot faster than starting from scratch.
Run Custom Scripts via PowerShell and SSH
If you prefer a DIY approach or need to customize how data is collected, you can use the PowerShell-based method developed by Patrik Nordlund at Retune AB.
Retune AB manages a variety of Ubiquiti devices, including wireless data communication products for enterprise and broadband environments. Naturally, the team wanted to bring these into their monitoring stack.
However, they found that Ubiquiti’s SNMP implementation doesn’t provide reliable real-time CPU or memory metrics which are two critical values for verifying device health.
The team at Retune AB encountered several incidents where CPU and memory usage would spike and remain elevated indefinitely. Only a manual reboot would release the resources.
By configuring LogicMonitor alerts, they’re now able to detect these conditions early and take action before users are impacted.
During testing, the team also discovered that other Ubiquiti users had published unofficial OIDs for average CPU usage (one-minute, five-minute, and fifteen-minute intervals). However, these values didn’t work consistently across Retune AB’s devices. Memory visibility was even more limited and the official UBNT-Unifi-MIB lacked any reference to CPU or memory data entirely.
Thanks to LogicMonitor’s extensibility, the team found a practical workaround using PowerShell scripts executed from the Collector.
Here’s how you can do it too:
Install the POSH-module, posh-ssh, on the collector so SSH can be used in PowerShell.
Connect to the access point:
Authentication is done with an SSH-key.pair. The public key is uploaded to the AP (via Unifi controller), and the private key is stored in the Collector, protected with a strong passphrase.
You can edit $keyFile in the script, or put your private key in your Collector’s installation directory at: LogicMonitor\Agent\bin\Local_Disk_On_Collector\privatekey_LM.key
Passphrase and username are added in LogicMonitor as properties unifi.sshuser and unifi.sshpassphrase.key so they are not exposed directly in the script.
Use the native Linux commands to get metrics for CPU and Memory.
Collected data is formatted to calculate percentage value and then returned to LogicMonitor.
Their team noticed there were slight differences in the output from the Linux commands. If this happens, you may have to tweak the scripts to suit your specific devices.
You can get these metrics from the Unifi controller via the API. However, in this case, each device will generate a question for the controller, causing an influx of data and a single point of failure for your network monitoring.
Thanks to LogicMonitor, the Retune AB team could monitor what is essential to their business, and now have confidence in the metrics they are receiving for Ubiquiti devices.
Troubleshooting High Memory and CPU Usage on UDM Pro
If your UDM Pro is running hot, constantly chewing through CPU or memory, it’s not just you. This is one of the most talked-about issues in UniFi forums, and for good reason. If left unchecked, these resource spikes can bring your network to a crawl or knock out services like IDS/IPS and UniFi Protect.
So what’s causing the spike?
In most cases, high memory and CPU usage is tied to UniFi Protect. If you’re using the UDM Pro as both your network gateway and NVR, especially with high-resolution camera feeds, memory consumption can escalate quickly.
Other common contributors include:
Deep Packet Inspection (DPI) and Threat Detection features
Traffic analysis tools running continuously
Firmware bugs introduced in recent updates that trigger resource leaks or runaway processes
What’s normal and what’s not?
Some fluctuation in usage is expected. Here’s a general baseline:
Memory usage above 80% is typically not a concern unless it remains elevated without recovery.
CPU usage spikes during firmware upgrades or traffic surges are normal.
Consistently high usage, like memory above 90% or CPU pinned above 70%, may indicate a stuck process or overloaded service.
Steps to Stabilize Performance
Before restarting the device, try these targeted steps:
Disable UniFi Protect temporarily to see if usage drops
Turn off DPI or IDS/IPS features you’re not actively using
Make sure you’re on the latest stable firmware (some versions have known memory leaks)
Restart individual services via the command line if possible, rather than the whole device
If none of that helps, a reboot usually clears the issue. But that’s treating the symptom, not the cause.
Once you’ve stabilized things, the key is keeping visibility. LogicMonitor’s historical monitoring and alerting capabilities give you the context UniFi lacks. With continuous data collection, you can:
See if issues are trending upward
Get alerted before usage thresholds are exceeded
Correlate spikes with specific services or changes
This prevents the same problem from disrupting your network again.
UDM Pro vs. UDM SE vs. UDM Pro Max: Monitoring Considerations
If you’re seeing high memory or CPU usage on your UDM Pro, you’re not alone. But before jumping into scripts or setting up alerts, it’s worth considering: are you using the right hardware for your network’s workload?
UniFi offers a few variations of the Dream Machine lineup:
UDM Pro
UDM SE (Special Edition)
UDM Pro Max
They may look similar, but are not! There are key differences that can affect how each one handles high traffic, DPI, Protect, and overall resource load.
Let’s see what these differences are.
Hardware Differences That Matter
The UDM SE features upgraded internals, including more storage and faster Ethernet ports, while the UDM Pro Max ramps things up even further with better thermal design and more RAM.
These differences can directly impact how each device handles monitoring, recording, and packet inspection tasks under pressure.
If you’re maxing out CPU or memory on the standard UDM Pro, upgrading to SE or Max might improve performance and reduce how much active monitoring you need to do just to keep things running smoothly.
Which One Is Right for Your Environment?
Let’s see which one is right for you:
UDM Pro is solid for smaller networks or light-duty setups. But once you enable features like UniFi Protect or advanced security scanning, it can get overwhelmed.
UDM SE is better suited for small-to-midsize businesses with a few cameras and light IDS/IPS usage.
UDM Pro Max is built for busier environments like for offices with lots of devices, multiple camera streams, and heavier traffic analysis.
If you’re constantly troubleshooting resource limits, it may not be a config issue. It might just be a hardware mismatch.
If your UDM Pro is always hitting 90% memory, it might not be your setup; it might be time to rethink your hardware.
Quick Comparison: UDM Pro vs. UDM SE vs. UDM Pro Max
Feature
UDM Pro
UDM SE
UDM Pro Max
RAM
4 GB
4 GB
8 GB
CPU
Quad-Core ARM
Quad-Core ARM
Quad-Core ARM (faster clock)
Storage
None (user-added)
128 GB SSD (built-in)
128 GB SSD (built-in)
Power Supply
Internal PSU
Internal PSU + PoE
Higher wattage PSU
SFP+ Ports
1 x 10G
1 x 10G
2 x 10G
Thermal Design
Basic cooling
Improved cooling
Enhanced airflow and heat handling
Ideal Use Case
Home/small office
Light business use
Heavy traffic and camera load
Set Thresholds, Get Alerts Early, and Track Usage over Time
If you’ve ever had to reboot your UDM Pro just to get things working again, you know how frustrating it is to fly blind. Between incomplete dashboards, missing metrics, and inconsistent SNMP support, it’s easy to feel like you’re always playing catch-up.
That’s why so many teams are turning to LogicMonitor. Instead of juggling scripts, screenshots, and gut feelings, you get a unified view of your UniFi devices, alongside the rest of your infrastructure.
Whether you’re running one UDM Pro or managing dozens across client sites, LogicMonitor helps you go from reactive fixes to proactive visibility.