
A NetFlow traffic analyzer displays the flow of traffic through your network. It helps you find where bandwidth is being overused, which apps or devices are causing slowdowns, and where problems begin. Small issues like one overloaded link can affect the entire system. Without visibility, those issues often go unnoticed.
NetFlow monitoring gives your team the data to investigate performance drops and understand what’s happening in real time. You can trace traffic flows across routers, switches, and interfaces. That makes it easier to find the root cause and fix it quickly.
In this article, we’ll explain how to use a NetFlow traffic analyzer to check bandwidth usage, find the sources of slowdowns, and maintain a reliable network. You’ll also learn about NetFlow versions and flow records, common use cases, how to monitor NetFlow data, and the kinds of insights this monitoring can provide.
TL;DR: NetFlow provides real-time visibility, faster fixes, and smarter planning
-
See live traffic and bandwidth, which helps catch slowdowns in real time
-
Prevent disruptions with early root-cause detection
-
Optimize bandwidth and stabilize complex environments with LogicMonitor NetFlow
-
Use historical trends for capacity planning and recurring issues
What Is a Netflow Traffic Analyzer
A NetFlow traffic analyzer is NetFlow monitoring software that gives you complete visibility into your network traffic patterns.
Think of it as your network’s detective that analyzes NetFlow data generated by routers and switches to show you exactly what’s happening on your network.
It analyzes NetFlow, a network protocol developed by Cisco Systems that’s now widely used across the industry to collect detailed information about IP traffic.
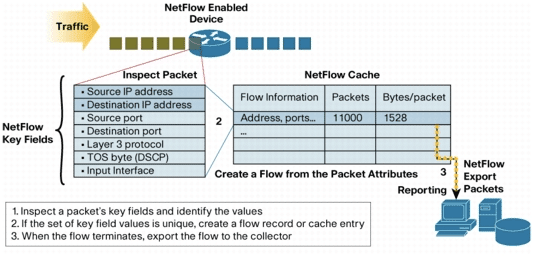
Network traffic analyzers examine NetFlow data as flow records for every conversation on your network. NetFlow captures data like source and destination IP addresses, ports, protocols, and service types.
This lets network teams answer the essential questions like:
- who is using bandwidth
- what applications are consuming it
- how much is being used
- when peak usage occurs
- where bandwidth demands are highest
NetFlow traffic analyzers give you real-time visibility into network traffic, helping you optimize bandwidth and resolve issues before they impact performance.
Setting up NetFlow Monitoring: Protocol Versions and Alternative
NetFlow has evolved significantly since Cisco introduced it in the mid-1990s, with each version adding new capabilities to meet growing network monitoring demands.
When configuring your NetFlow traffic analyzer, you must understand these versions to choose the right protocol for your setup.
NetFlow Protocol Versions
1. NetFlow v5 is an early standard that captures a fixed set of data points per packet, including source/destination IPs, ports, and basic traffic statistics. Most NetFlow monitoring software supports this version perfectly. It’s the best choice when you need basic bandwidth monitoring and top talkers identification (i.e., identifying the users, devices, or applications consuming the most bandwidth).
2. NetFlow v9 introduced a more adaptable template-based format with additional details like application IDs through NBAR integration. It’s required when your network traffic analyzer needs application identification. With this, your analyzer gets more granular data, including application names and port numbers.
3. IPFIX (NetFlow v10) is the modern standard and is now the industry-standard version offering maximum flexibility with expanded data fields. It captures advanced metrics like DNS query types, retransmission rates, and Layer 2 details, including MAC addresses. This is essential when your NetFlow analysis software needs detailed metrics for security monitoring or compliance reporting.
Migration Path to Latest NetFlow Version
Check what your NetFlow analyzer software supports before enabling flows on your devices. Most modern tools like LogicMonitor handle all three versions, but some older systems only work with v5. Here’s what you should do:
- Start with NetFlow v5 for basic monitoring
- Upgrade to v9 when you need application visibility
- Go with IPFIX for advanced analytics
Most NetFlow monitoring tools support multiple protocols simultaneously during transitions.
The core output of each version is the flow record, which provides a detailed summary of each data packet’s key fields, like source and destination identifiers.
How to Monitor Network Traffic Using a NetFlow Analyzer
Monitoring network traffic with a NetFlow analyzer enables IT teams to capture, analyze, and visualize flow data, helping them track bandwidth usage and detect inefficiencies across the network. Here’s a breakdown of the key components in this netflow monitoring process:
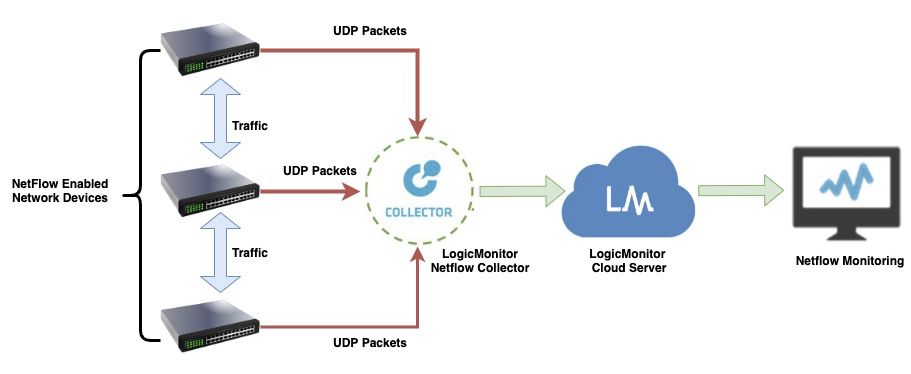
Flow Exporter
A network device, such as a router or firewall, acts as the flow exporter. It collects packets into flows to capture essential data points like source and destination IPs. Once accumulated, it forwards the flow records to a flow collector through UDP packets.
Step-By-Step Packet-To-Flow Conversion
Here’s how the packet-to-flow conversion looks step-wise:
- The router receives individual data packets
- Groups packets by source/destination IP, ports, and protocol
- Creates a single flow record summarizing the entire conversation
- Exports bundled flow records every few minutes
Flow Collector
A flow collector, such as LogicMonitor’s Collector, is a central hub for all exported flow data. It gathers records from multiple flow exporters, bringing network visibility across all devices and locations together in one place. With everything in one spot, it becomes easier for admins to analyze network traffic without manually aggregating data.
Flow Analyzer
Like LogicMonitor’s Cloud Server, the flow analyzer processes the collected flow data and provides detailed real-time network traffic analysis. This NetFlow analysis software helps you zero in on bandwidth-heavy users, identify latency issues, and locate bottlenecks.
By linking data across interfaces, protocols, and devices, LogicMonitor’s traffic flow analyzer gives teams real-time insights to keep traffic moving smoothly and prevent disruptions.
Flow Exporter (Network Device) → Flow Records → Collector Server → NetFlow Analyzer → Dashboards & Reports
This three-component architecture ensures your NetFlow monitoring software captures complete network communications and transforms them into actionable intelligence for network traffic monitoring decisions.
Real-Time Network Traffic Analysis Across Environments
When dealing with interconnected networks, real-time analysis of network traffic helps you better understand your data flows, manage your bandwidth, and maintain ideal conditions across on-premises, cloud, and hybrid IT environments.
A NetFlow analyzer lets you track data flow anywhere you need to examine it and optimize traffic patterns for current and future network demands. This unified approach eliminates blind spots that occur when using separate NetFlow monitoring software for different environments.
In On-Premises Networks
For on-prem systems, LogicMonitor’s NetFlow analysis gives you immediate insights into local network behavior. It pinpoints peak usage times and highlights applications or devices that may be using more bandwidth than they should.
This real-time visibility helps you prioritize bandwidth to avoid bottlenecks and get the most out of your on-site networks. The historical data also helps predict when you’ll need hardware upgrades before performance degrades with bandwidth monitoring capabilities.
In Cloud Networks
In a cloud environment, real-time monitoring gives you a deep look into traffic flows between cloud-native applications and resources. This makes it easier for you to manage network traffic with precision.
LogicMonitor’s NetFlow analysis identifies high-demand services and simplifies bandwidth allocation across cloud instances, ensuring smooth data flow between applications. This visibility helps optimize cloud costs by identifying underutilized resources and right-sizing instances using traffic flow analyzer insights.
In Hybrid Cloud Networks
In a hybrid cloud environment, data constantly moves between on-premises and cloud-based resources, making LogicMonitor’s real-time network traffic analysis even more critical.
Our NetFlow analyzer tracks data flows across both private and public cloud networks to provide real-time visibility into how traffic patterns impact bandwidth.
But there’s a challenge with hybrid setups: traffic can take unexpected paths during failovers or load balancing, which makes traditional monitoring ineffective.
Using real-time monitoring and historical data trends, our solutions enable network administrators to ensure network resilience, manage traffic surges, and improve overall network efficiency in complex hybrid cloud settings.
LogicMonitor’s flow analyzer lets IT teams spot high-traffic areas and identify the root causes of slowdowns and bottlenecks. With this information, admins can proactively adjust bandwidth allocation or tweak routing protocols to prevent congestion.
What makes this extra helpful is the ability to set up automated responses that redirect traffic when certain thresholds are hit. This type of traffic analysis optimizes bandwidth utilization across all types of environments, supporting smooth data transfer between systems.
Why Use a NetFlow Traffic Analyzer For Your Network?
A NetFlow traffic analyzer gives you real-time visibility into the performance and security to keep everything running smoothly. NetFlow monitoring helps optimize network performance and resolve issues before they cause disruptions, making it a key tool for keeping networks healthy.
Here’s how NetFlow monitoring software drives network efficiency:
1. Complete Network Visibility
A NetFlow traffic analyzer gives network admins real-time visibility into traffic flows, making it easy to see who’s using bandwidth and which apps are consuming resources.
With live insights like these, you or your admins can jump on performance bottlenecks before they become full-blown issues. The granular detail shows not only what’s happening, but also the context around why certain traffic patterns exist.
You can quickly implement QoS (Quality of Service) policies and direct resources based on actual usage data while preventing network exposure to malware risks and intruders.
2. Faster Root Cause Analysis
NetFlow monitoring makes it much easier to find the root cause of network slowdowns. When users experience delays accessing applications, NetFlow data gives you a precise view of where problems are located.
By analyzing traffic patterns, packet drops, and response times, your team can identify which device, application, or traffic bottleneck is causing the lag.
Unlike traditional monitoring, NetFlow reveals the actual data flows causing issues. This way, your teams can resolve problems at their source, keeping the network humming and users satisfied.
3. Smart Bandwidth Optimization
NetFlow analysis drills down into bandwidth usage across interfaces, protocols, and applications, helping you identify “top talkers”—the heaviest bandwidth users on your network.
With this detailed view, your IT teams can quickly determine if high-usage traffic is business-critical or needs throttling.
The ability to see historical trends alongside real-time data helps you distinguish between normal peak usage and actual problems. This intelligence helps balance resources efficiently, boosting overall network performance.
4. Accurate Capacity Planning
NetFlow data isn’t only for current monitoring; it enables strategic planning too. By analyzing traffic patterns over time, admins can forecast future bandwidth requirements and plan capacity upgrades strategically.
This historical analysis reveals seasonal trends, growth patterns, and usage cycles that simple point-in-time monitoring misses. This proactive approach helps your network handle peak traffic periods without performance degradation.
5. Advanced Security Threat Detection
A network traffic analyzer is good at detecting potential security threats, from unusual traffic spikes to unauthorized access attempts. Many security attacks consume network resources and create anomalous usage patterns that indicate potential breaches.
NetFlow’s ability to baseline normal behavior means it can detect subtle changes that signature-based security tools often miss.
Netflow analysis tools enable admins to monitor, receive alerts, and investigate suspicious patterns in real-time, addressing threats before they escalate into major security incidents.
Key Insights From LogicMonitor’s NetFlow Monitoring
With LogicMonitor’s NetFlow Monitoring, you can get valuable insights on the following data points:
- Bandwidth Utilization
Identify the network conversation from the source and destination IP addresses and traffic path in the network from the Input and Output interface information.

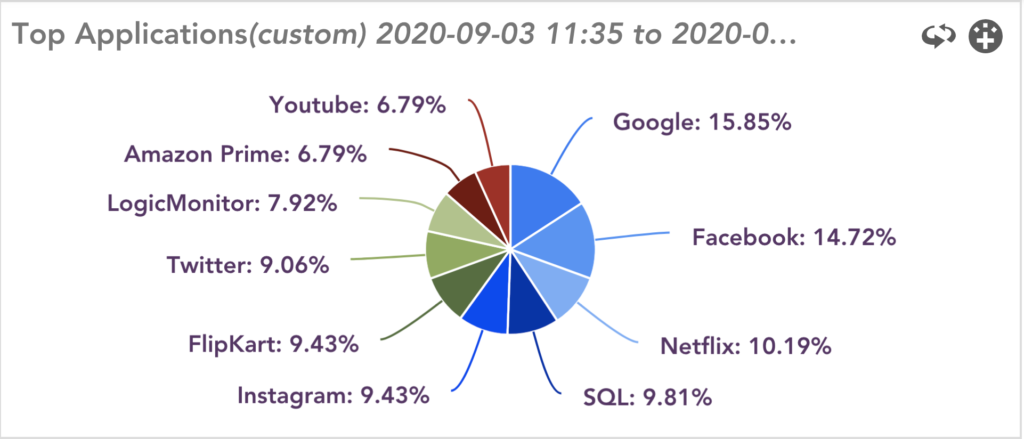
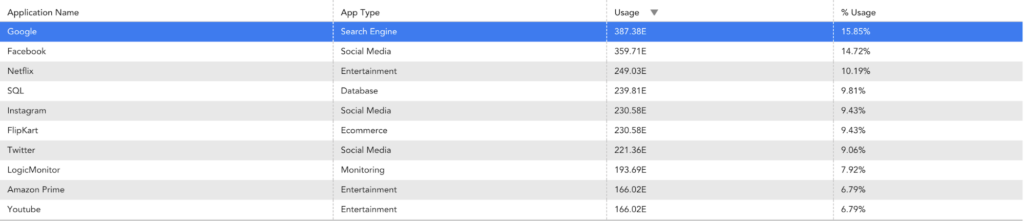
- Top Flows and Top Talkers
Identify Top N applications, Top Source/Destination Endpoints, and protocols consuming the network bandwidth.
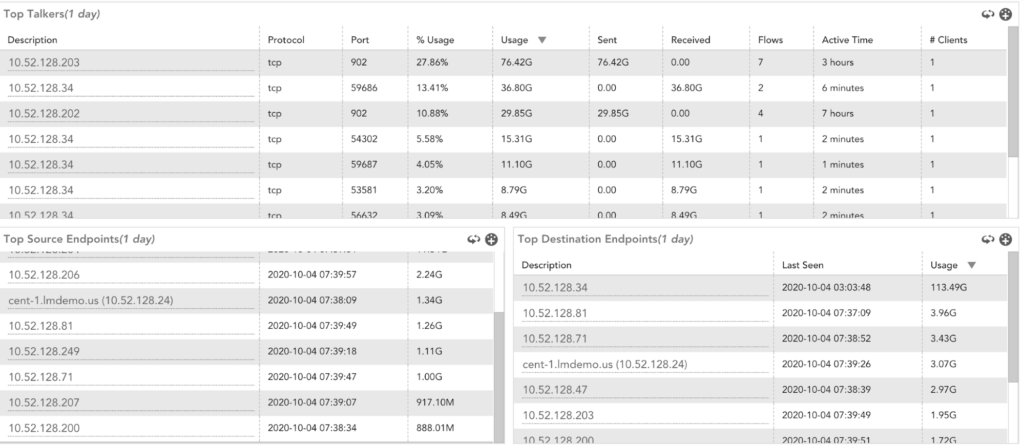
- Consumers of the Bandwidth
Keep track of interface details and statistics of top talkers and users. This can help determine the origin of an issue when it’s reported.

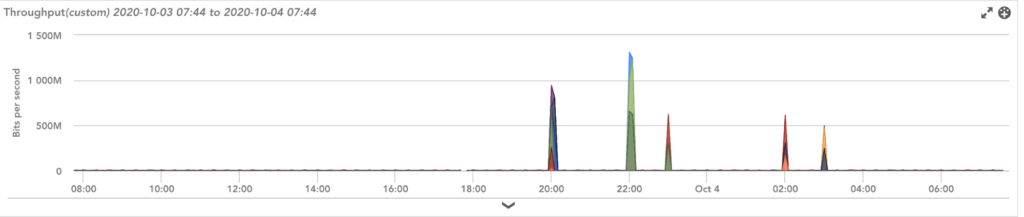
- Bandwidth Hogging
Analyze historical data to examine incident patterns and their impact on total network traffic through the packet and octet count.
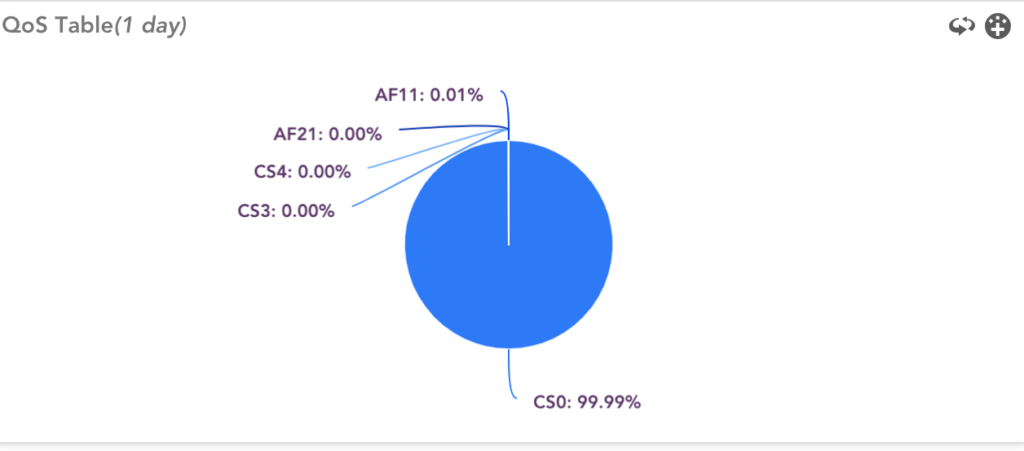
- ToS and QoS Analysis
Using ToS (Type of Service), ensure the right priorities are provided to the right applications. Verify the Quality of Service (QoS) levels achieved to optimize network bandwidth for the specific requirements.
- IPv6 Traffic Monitoring
LogicMonitor’s NetFlow Monitoring provides out-of-the-box support for a mix of IPv4 and IPv6 environments and the flexibility to differentiate TopN flows in each protocol. IPv6 adoption is gaining significant traction in the public sector, large-scale distribution systems, and companies working with IoT infrastructures.
- Applications Classification through NBAR2
Network-Based Application Recognition (NBAR) provides an advanced application classification mechanism using application signatures, databases, and deep packet inspection. Enabling NBAR on specific devices directly within the network accomplishes this.
NetFlow Traffic Analyzer vs. Other Network Monitoring Tools
Each network monitoring tool brings its own strengths to the table, but NetFlow stands out when you need detailed traffic insights.
With its ability to capture entire traffic flows, track bandwidth usage, and provide real-time visibility down to the user level, NetFlow is uniquely suited for in-depth network analysis.
Here’s how NetFlow analyzers stack up to other common methods:
- SNMP (Simple Network Management Protocol): SNMP is a popular go-to for device monitoring because it provide valuable status data, such as device health and connectivity. However, unlike NetFlow, it doesn’t offer the granularity to examine specific traffic flows or analyze bandwidth by user or application. SNMP provides device metrics every 5 minutes; NetFlow provides flow data in real-time.
- sFlow: sFlow offers real-time network monitoring similar to NetFlow, but it samples traffic instead of tracking every packet. This is helpful in high-speed networks with massive data volumes. NetFlow’s traffic records provide a fuller view, making it the preferred choice of many admins and engineers for in-depth traffic analysis. sFlow samples 1 in every 1000 packets; NetFlow examines complete conversations.
- J-Flow (Juniper): Multi-vendor environments, Juniper’s equivalent to NetFlow. Most NetFlow analyzer software supports both protocols, so you can monitor mixed Cisco-Juniper networks from one platform.
- Packet sniffers: Packet sniffers, like Wireshark, capture every packet for deep packet inspection and troubleshooting. While packet sniffers are great for precise packet analysis, they’re resource-heavy, less scalable, and lack NetFlow’s high-level summary. This makes NetFlow better suited for long-term traffic monitoring and bandwidth monitoring.
NetFlow vs Packet Capture Tools
Unlike packet sniffers that capture complete packets for deep analysis, NetFlow traffic analysis provides flow summaries that are easier to store long-term and analyze for trends.
NetFlow focuses on metadata rather than full packet payloads, which makes it more scalable for ongoing monitoring. This helps you to track traffic volumes, top talkers, and flow patterns without the storage and processing overhead of packet captures.
While packet capture tools are valuable for troubleshooting specific issues at the packet level, NetFlow is better suited for continuous visibility across large and complex networks.
By combining both approaches when needed, organizations can balance deep forensic insights with long-term performance monitoring.
Choosing the Right NetFlow Traffic Analyzer for Your Network
When choosing a traffic analysis tool, here are a couple of factors you must consider:
- Scalability: Select a solution that can keep up as your network expands. For example, LogicMonitor’s NetFlow analyzer supports a range of network sizes while maintaining high performance. Consider tools that can handle at least 10x your current flow volume to accommodate future growth.
- Integration: Choose a tool that integrates smoothly with your existing infrastructure, including network devices, software, and other bandwidth monitoring tools. This makes data flow better and you face fewer integration hurdles. So, look for solutions that support APIs and can push data to your existing SIEM or ITSM platforms.
- Ease of use: Make sure your tool has a user-friendly interface and easy-to-navigate dashboards that support network management. Look for tools with customizable dashboards, like LogicMonitor, to make data visualization and metric tracking more accessible for your team. The tool should provide actionable insights within 5 minutes of installation, rather than requiring weeks of training.
Selection Decision Matrix
The selection decision matrix below helps compare NetFlow traffic analyzer requirements across small, medium, and enterprise networks.
| Feature | Small Network (<100 devices) | Medium Network (100-1000 devices) | Enterprise Network (1000+ devices) |
|---|---|---|---|
| Flow capacity | 10K flows/sec | 100K flows/sec | 1M+ flows/sec |
| Storage requirements | 30 days retention | 90 days retention | 1 year+ retention |
| Implementation time | 1-2 weeks | 4-6 weeks | 8-12 weeks |
| Estimated cost range | $5K-15K annually | $15K-50K annually | $50K+ annually |
ROI Calculation Factors
You can best understand the ROI of NetFlow monitoring by looking at the main cost and savings drivers:
- Current troubleshooting time costs: Average $150/hour for network admin time)
- Security incident costs: Average $4.45M per breach
- Bandwidth optimization savings: 15-30% reduction in unnecessary traffic
Overall, most NetFlow monitoring software pays for itself within 6-12 months through reduced incident response time and optimized bandwidth usage.
Using Historical Data in a NetFlow Traffic Analyzer for Trend Analysis
A NetFlow traffic analyzer builds a history of traffic data that’s key for long-term planning. Over time, this data becomes a helpful resource for understanding traffic patterns, detecting potential issues, and making the right decisions.
By using a NetFlow monitoring tool for trend analysis, you can track variations in bandwidth usage, identify recurring performance issues, and plan for future demand based on real traffic behavior.
Here’s how trend analysis supports better network performance and reliability:
- Capacity planning: Looking at long-term trends helps you understand how network usage is growing. With the right NetFlow monitoring software, you can track traffic spikes, identify high-traffic endpoints, and prepare for scaling needs before performance problems surface.
- Problem prevention: Reviewing historical NetFlow data can reveal patterns in latency, packet loss, or bandwidth saturation. If you consistently encounter issues at certain times or on certain interfaces, a network traffic monitor analyzer helps you address them before they impact users.
- Smarter resource allocation: A network flow analyzer can show you which applications or services are consuming the most bandwidth during peak hours. These insights help you adjust QoS policies or redistribute traffic loads to improve performance across the board.
Whether you’re using NetFlow analyzer software for bandwidth monitoring, usage reporting, or capacity forecasting, the ability to look back is as important as seeing what’s happening now.
Historical trend analysis makes NetFlow traffic analysis tools a critical part of any proactive network monitoring strategy.
With NetFlow data, you can identify bandwidth hogs, track traffic patterns, and ensure your network operates at peak efficiency.
Beyond Historical Trends: Predictive Insights
Historical NetFlow data provides a baseline for understanding how your network behaves. When paired with predictive analytics, that same data can be used to forecast traffic growth, anticipate capacity needs, and detect patterns that may lead to issues.
With machine learning-based anomaly detection, LogicMonitor identifies traffic behaviors that don’t match normal patterns, even when they haven’t caused alerts before. This helps teams reduce false positives, recognize early signs of problems, and act before users are affected.
Adding predictive capabilities to NetFlow analysis moves monitoring from reactive problem-solving to proactive planning.
Customizing LogicMonitor’s NetFlow Dashboards for Better Insights
Customizing your NetFlow dashboards helps you focus on the network traffic and performance metrics that matter most.
With flexible views and dynamic filters, LogicMonitor’s NetFlow monitoring solution gives you real-time visibility and long-term context without overhead. Dashboards can be configured to present high-priority data, making it easier to troubleshoot issues, track usage trends, and improve network reliability.
Here’s how you can do customizations:
- Focused monitoring: Build dashboards around the metrics your team relies on most—like top talkers, application-specific flows, or interface-level traffic. This way, you can monitor NetFlow data in a way that aligns with your network priorities, without having to sift through noise.
- Custom NetFlow reporting: LogicMonitor lets you create reports that match your team’s workflow from daily overviews to detailed traffic analysis. These NetFlow reports show usage trends, bandwidth patterns, and application behavior. And they help you stay informed, whether you’re handling real-time alerts or planning future upgrades.
Threshold Alarms and Alerts
LogicMonitor’s NetFlow monitoring solution makes it easy to set custom threshold alarms and alerts, so your team can track NetFlow traffic and spot performance issues as they happen.
These alerts highlight abnormal activity like sudden traffic drops or unexpected bandwidth spikes, so you can take action before users are affected.
Let’s see how threshold-based alerting improves your network traffic monitoring:
- Custom thresholds: Define thresholds for specific metrics such as bandwidth usage, latency, packet loss, or protocol-level traffic. By aligning thresholds with your network’s baseline behavior, NetFlow analyzers reduce alert fatigue and ensure you’re only notified when something truly needs attention.
- Instant alerts: Delivers real-time alerts the moment traffic exceeds or falls below set limits. This allows your team to respond to traffic anomalies quickly and prevent downtime, congestion, or degraded performance.
- Smarter incident response: Assign severity levels to different alerts based on their impact. Critical events can trigger escalations automatically, while lower-priority issues can be logged for review. This helps your team focus on what matters most.
- Threshold tuning over time: Use historical NetFlow traffic analysis to fine-tune your alert settings. By reviewing trends and past alert behavior, you can minimize false positives and maintain accurate monitoring as your network evolves.
Common Network Issues Solved By NetFlow Traffic Analyzers
Here are some of the most frequent problems a network flow analyzer helps address and how NetFlow monitoring supports faster troubleshooting.
Bandwidth Hogging
Heavy bandwidth consumption or “bandwidth hogging” is one of the most common causes of slow network speeds.
A NetFlow bandwidth monitor shows which applications, devices, or users are using the most traffic. This gives IT teams the visibility they need to track bandwidth usage across the network. With these insights, you can optimize traffic flow and ensure fair resource distribution.
Application Slowdowns
Laggy or unresponsive applications can seriously affect productivity.
But with NetFlow monitoring software, your team can analyze traffic patterns to identify the cause of slowdowns, whether it’s high network utilization, latency, or a misconfigured service. A traffic flow analyzer delivers metrics that make it easier to identify and fix the problem quickly.
Network Congestion and Bottlenecks
Network congestion often shows up during peak business hours or large data transfers.
A NetFlow analysis tool helps visualize traffic patterns and identify high-traffic paths or chokepoints. By monitoring traffic flow across interfaces, devices, and protocols, teams can reroute traffic or adjust capacity in real time to reduce congestion and keep data moving efficiently.
Security Threats and Unusual Activity
Abnormal traffic behavior like a sudden spike in outbound traffic or unfamiliar IP activity may indicate a security risk.
NetFlow analyzers offer deep visibility into network behavior by helping teams detect unusual traffic patterns, investigate potential DDoS attacks, and detect unauthorized access attempts.
Combined with real-time NetFlow alerts and historical records, these tools help teams respond to threats faster and with more context.
Resource Misallocation
Sometimes performance issues stem from inefficient use of resources.
A network traffic monitor analyzer helps IT teams analyze NetFlow data to see which applications or services are using the most bandwidth. By aligning actual usage with priorities, you can adjust bandwidth allocation, improve QoS settings, and make sure mission-critical traffic gets the performance it needs.
Take Control of Your Network with NetFlow Analysis
Adopting NetFlow monitoring tools isn’t simply about visibility, it’s about proactive network management.
A modern NetFlow traffic analysis tool helps your team detect anomalies, track bandwidth usage, and resolve issues before they affect users.
With LogicMonitor’s NetFlow analyzer, you get AI-driven insights, customizable dashboards, and threshold-based alerts—everything you need to stay ahead of network problems and deliver reliable performance.