At LogicMonitor, ingesting and processing time series metric data is arguably the most critical portion of our AI-powered hybrid observability platform. In order to fully prepare for growth, scale, and fault-tolerance, we have evolved what we refer to as our Metrics Processing Pipeline from a monolith to a microservice-driven architecture. We previously detailed our evolutionary journey in a series of articles:
However, the further we ventured into our evolution from a monolith system into a distributed microservice and message-driven architecture, new problems arose. In this article, we will detail one such problem and how we architected the solution.
Our Kafka-based Microservices architecture and scaling challenges
Using Quarkus and Kubernetes to consume from Kafka
First, let’s consider a high-level partial architectural overview. After ingesting time series metric data, the data eventually makes its way onto a Kafka topic where it is consumed and processed by a microservice. This runs on Kubernetes and was written using the Quarkus framework. We run multiple instances of this microservice, and they join the same Kafka consumer group. The partitions of the Kafka topic are assigned to the consumers in the group, and when the service scales out, more instances are created and join the consumer group. The partition assignments will be rebalanced among the consumers, and each instance gets one or more partitions to work on.
This microservice is a highly compute-intensive application, and we leverage the Kubernetes Horizontal Pod Autoscaler (HPA) to automatically scale instances of the application based on cpu utilization metrics.
At LogicMonitor, we support multiple different datapoint metric types for the time series data we ingest. After collecting the data from the source, we need to have some additional processing of the raw data in order to produce the actual value of a datapoint as dictated by its metric type. As a requirement of this processing, we need to cache some prior existing data for each datapoint as we process incoming messages from Kafka. For more details about how we use Kafka in this way, check out this article.
Now, we arrive at the crux of the problem. In order to maximize our scalability and throughput, we’ve built a multi-instance message-consuming application, which scales in and out based on computational load. Additionally, the membership of Kafka consumer group is extremely dynamic in nature, where various partitions can move over from one consumer to another in the same group.
However, as we mentioned above, each datapoint we process has some state associated with it – the cached existing data. Thus, a Kubernetes pod getting killed due to a scale-down event is not a loss-less incident. Now we lose the context associated with the data points that this pod was processing. Similarly, a Kafka partition reassignment is also not a loss-less incident. The new consumer that gets a partition either doesn’t have the context of the data points in the partition, or it has older, out-dated context.
Whenever this loss of context occurs, we experience ephemeral inconsistencies with our metrics processing. We need to address this loss of context that occurs due to a Kubernetes pod shutdown or Kafka partition reassignment.
Cost-Performance considerations for choosing a distributed cache
At first glance, it would seem like there is an obvious solution for this: replace the in-memory cache we have been using to save the context with a distributed cache of some sort. However, there are other factors which make that solution more complicated:
Speed – Due to the sheer volume of data that LogicMonitor ingests, our metrics processing pipeline relies on speed. If we introduce a distributed cache for every single raw metrics message evaluation, we are replacing a very cheap in-memory lookup with a lookup to an external system over the network. There’s a high probability that such a lookup will negatively affect the speed of the pipeline.
Cost – There is a high volume of processed messages , so calling to a distributed cache for each message has non-trivial cost implications. For example, the cache will require sufficient resource allocation to handle such frequent traffic, and the additional required network bandwidth will also have cost implications.
Nature of the data being cached – In order to store context associated with the data points, we built an in-house data structure specifically for metrics processing purposes. Initial investigation into various caching systems indicated that none of them offer a direct alternative, and instead we will have to massage/modify the data in order to store them in an external cache. However, if we need to serialize/deserialize the data every time for each write/read,the overall processing speed will diminish.
Using Redis to preserve scalable microservice’s state
Balancing state storage between distributed and in-memory cache
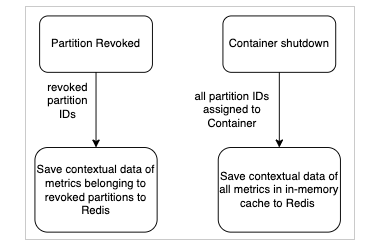
The natural solution is a middle ground between in-memory cache and external distributed cache. We continue to store the contextual data in memory. There are two scenarios which cause the loss of this data:
the container is shut down by Kubernetes (due to scale down event or deployment)
partition rebalancing is triggered in the Kafka consumer group
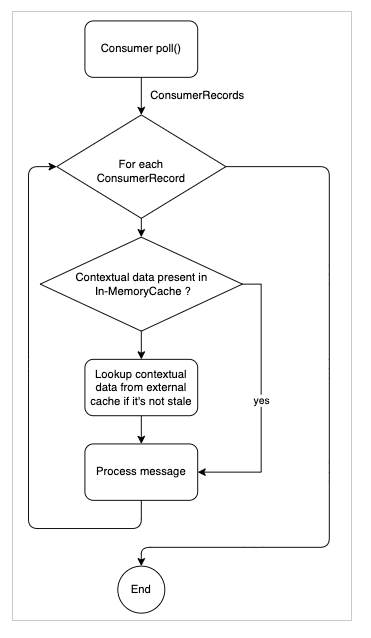
If we can detect when these two events occur and trigger a persistence of the contextual data to an external distributed cache, we should be able to save the “state.” Subsequently, when we’re looking up contextual data, if we do not find it present in the in-memory cache, we can look it up from the external cache and if found, insert it back into the in-memory cache, thus restoring the “state.”
We can lose context without incurring too much overhead by saving the contextual data into an external distributed persistent cache during container shutdown and partition rebalancing, we avoid losing the contextual data. By only looking up the contextual data from the external cache (if it’s not found in the in-memory cache), we avoid incurring too much increased overhead.
Why we chose AWS ElastiCache Redis
We chose Cluster-mode AWS ElastiCache Redis as our distributed cache. Here are a few of the main reasons:
We need to quickly look up contextual data for one specific datasource instance. So, a key-value based data store like Redis is ideal.
Redis has exceptional write and access times, which meets our requirement to be able to quickly dump and read back the contextual data.
We want the contextual data that we’re backing up to be resilient. AWS ElasticCache for Redis in cluster-mode provides the flexibility that we’re looking for by distributing the data across multiple shards and also providing replication
As the LogicMonitor platform grows, we want to use a distributed caching that can scale horizontally. AWS ElastiCache Redis provides non-disruptive horizontal scaling for Redis clusters.
Leveraging Quarkus shutdown hooks, Kafka listeners, and Redisson
We used Quarkus framework’s shutdown hook to listen for Kubernetes container shutdown and trigger the backup of contextual data
We used the Kafka ConsumerRebalanceListener to listen for Kafka consumer rebalance events and trigger backup of contextual data for the partitions which were revoked in the event
We implemented our own in-house serialization and deserialization logic geared towards quickly writing cached data in-memory to Redis and quickly reading backed-up data from Redis
In order to speed up the data backup, we parallelized the process
When reading back persisted data from Redis, we implemented a check to ensure that we were not reading outdated information from Redis. If the data didn’t pass this check, it was discarded.
Using Compression and TTL to optimize Redis memory usage
In order to minimize Redis cluster memory requirement and network I/O, we used the lz4 compression algorithm to compress the context data before we saved it onto Redis. On the other end, we use Redisson’s compression capabilities to simultaneously decompress the data after fetching it.
The contextual data that we save to Redis does not need to stay on Redis for long periods of time, as the contextual data is only relevant for the next few polling intervals of the associated LogicMonitor datasources. To further optimize our Redis Cluster memory usage, we set a TTL (time-to-live) value for each contextual data we save to Redis, based on the collection interval of the associated LM datasource. This allows automatic freeing up of Redis memory once the data is no longer needed
Once we’ve backed up contextual data to Redis, we invalidate and remove the data from the local in-memory cache. This has the following advantages:
ensures that when contextual data is backed up to Redis, it is no longer backed up again in the future. This also ensures that only the latest contextual data is present in Redis
ensures that the in-app cache no longer contains unnecessary and potentially contextual data
frees up in-app memory
Summary
LogicMonitor continues to migrate our monolithic services to microservices to improve how we develop, deploy, and maintain our services. Check back for more articles about our experience during the journey.
Disclaimer: The views expressed on this blog are those of the author and do not necessarily reflect the views of LogicMonitor or its affiliates.