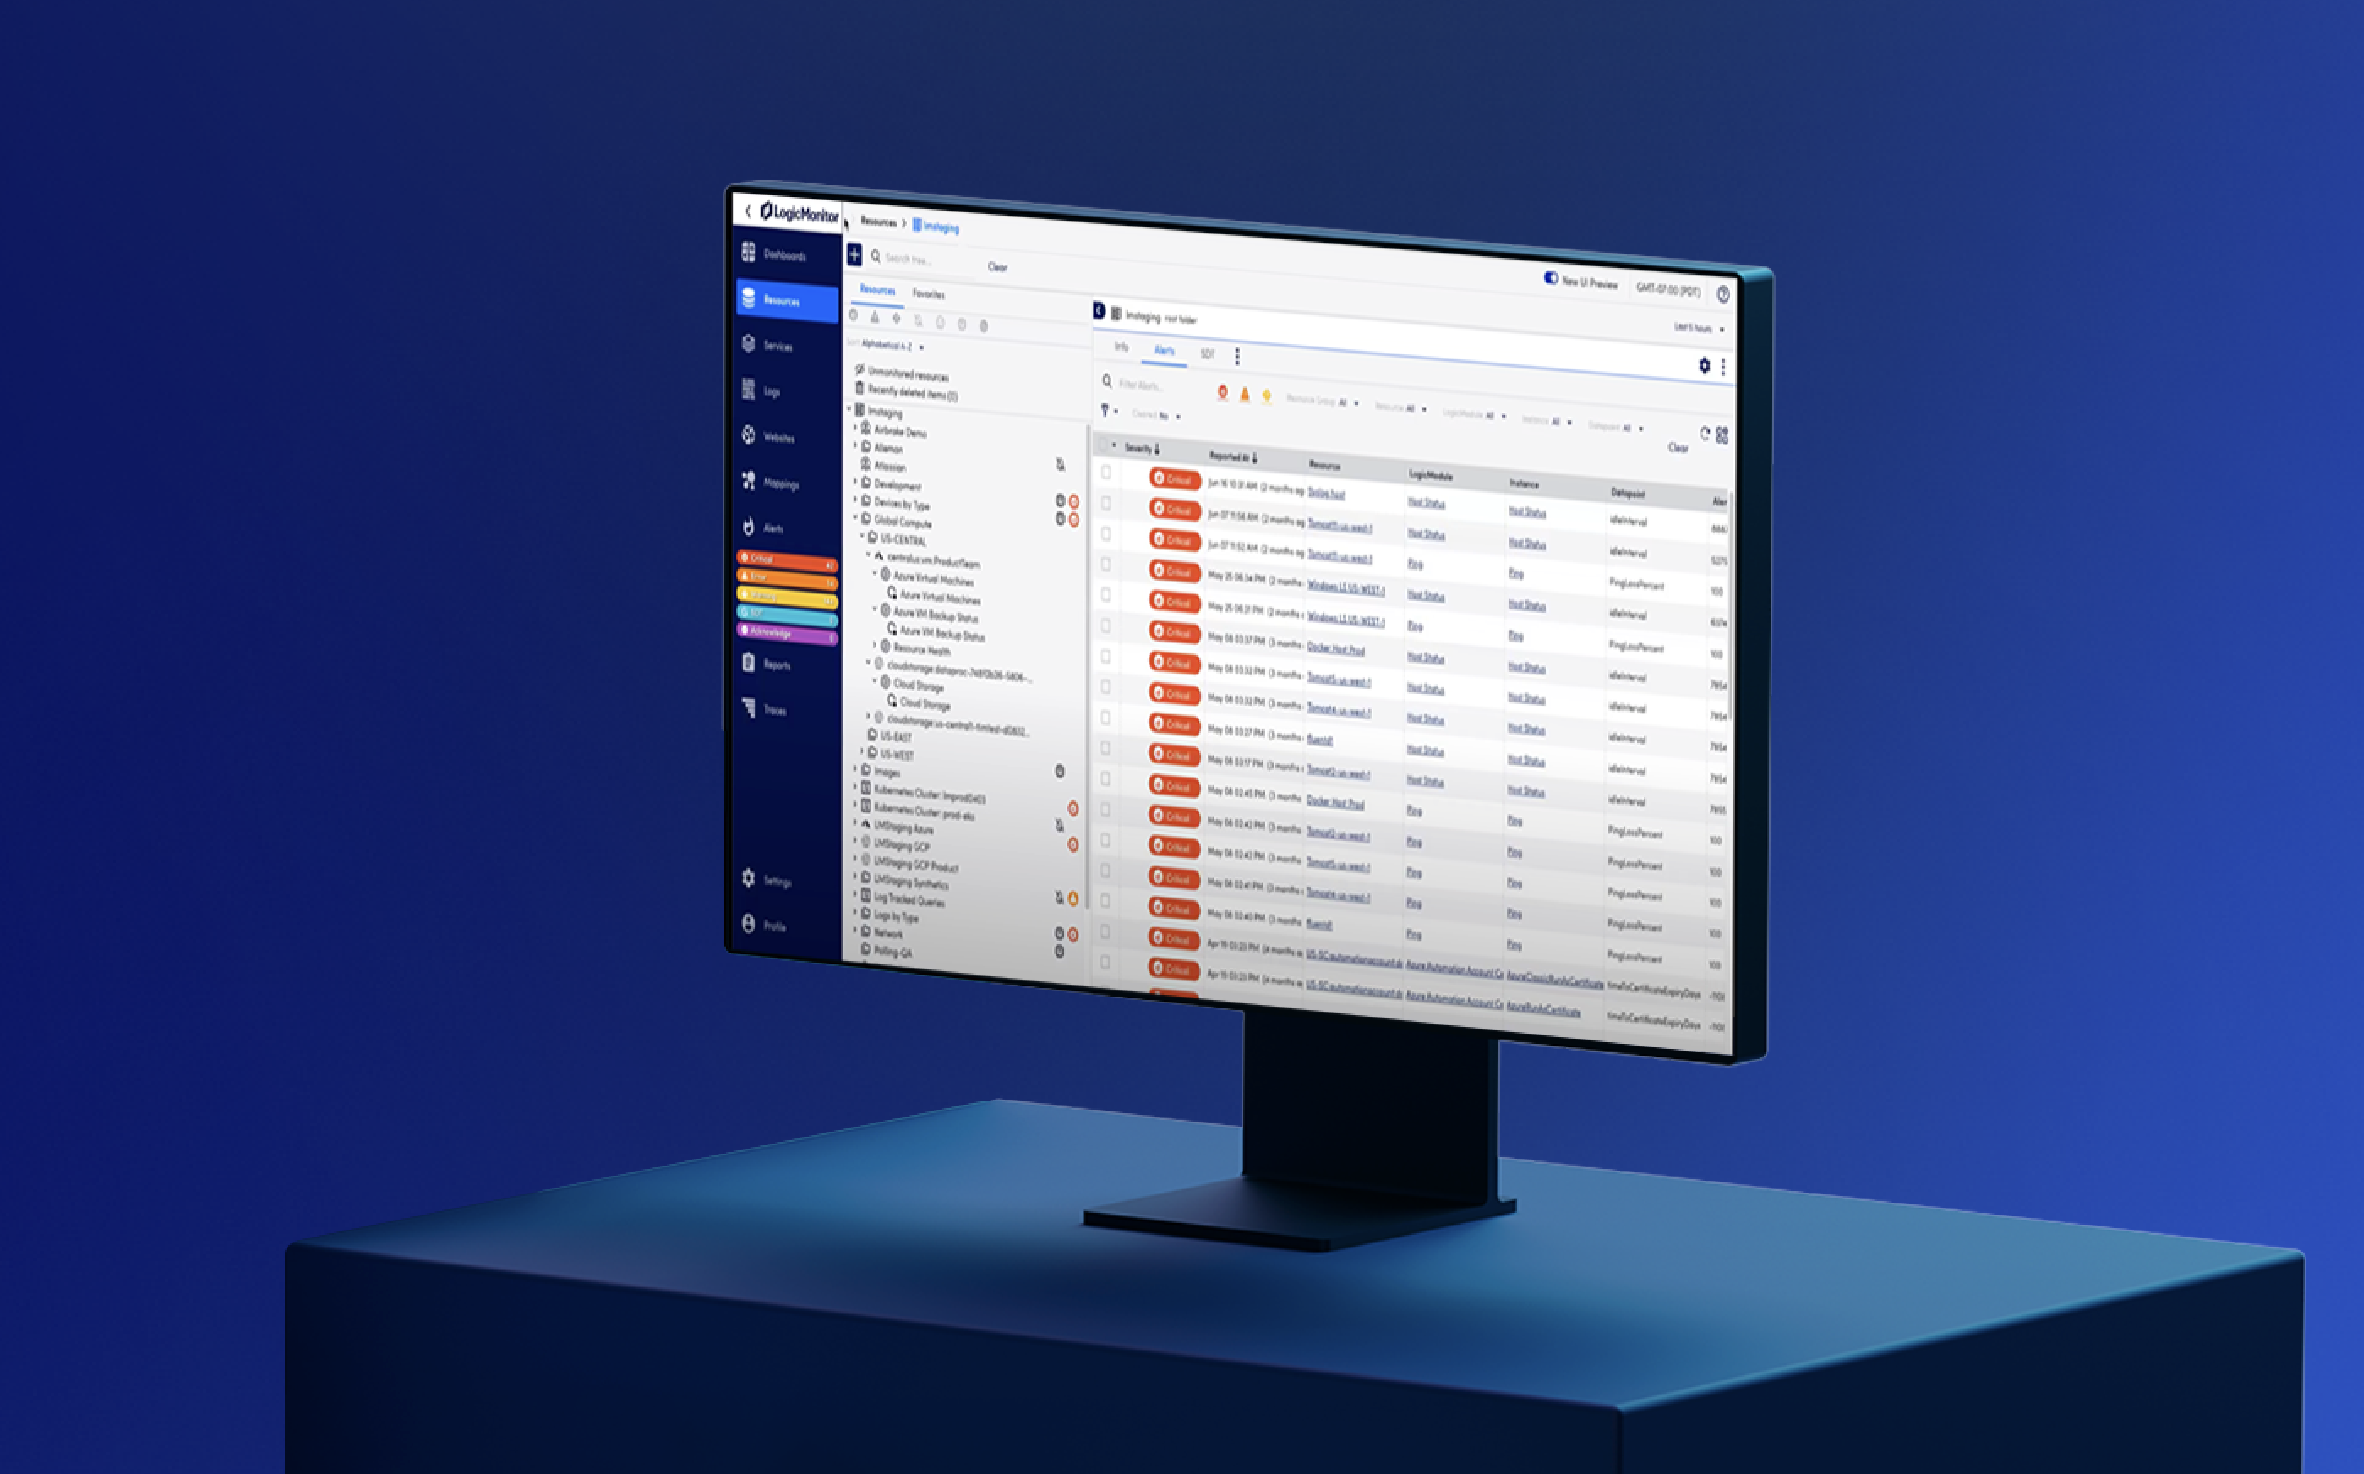
IT monitoring is evolving rapidly, and LogicMonitor is at the forefront of this transformation with the release of LogicMonitor’s new user interface (UI). This release marks a significant milestone, reflecting our commitment to innovation, responsiveness to user feedback, and anticipation of future technological trends.
LogicMonitor’s new UI isn’t just an upgrade; it’s a comprehensive reimagining of the user experience (UX) tailored to meet the demands of modern hybrid observability and cloud-centric operations.
The need for a new UX in IT monitoring
A significant shift towards hybrid observability has occurred in the IT industry, blending traditional monitoring techniques with modern, innovative approaches. A growing emphasis on cloud personas and layered intelligence drives this transformation. Such a dynamic shift in organizational goals necessitates a robust and versatile UX that can adeptly adapt to the complexities and continual changes of the cloud environment.
Responding to the demand for hybrid observability
Hybrid observability has emerged as a cornerstone in modern IT strategies, merging insights across your entire infrastructure, regardless of the hosting environment. This approach is pivotal in offering a comprehensive view that is essential for the diverse and intricate nature of current IT ecosystems.
With its SaaS-based hybrid observability platform, LM Envision offers a powerful solution to meet the ever-growing needs of modern enterprises. It enables organizations to adopt a cloud-ready operating model that effectively meets key business demands.
Enhancements in LogicMonitor’s new UI – Prioritizing UX
Enhanced usability: A core focus of LogicMonitor’s new UI
In LogicMonitor’s new UI, a key priority has been to enhance usability, making it a core aspect of the UX. The introduction of resource-level dashboards, along with a revamped Resources Overview tab and an improved Resources Info tab, exemplifies this commitment. Additionally, the new Cloud Locations tab has been designed to offer streamlined access and greater efficiency in cloud management. The launch of LM Exchange, Module Toolbox, and Store further signifies our dedication to providing a more integrated and user-friendly platform.
A new skin specific to this new UI means that your dashboards will now feature an updated look, along with LogicMonitor’s new UI-only improvements like real-time widget editing. No publishing needed.
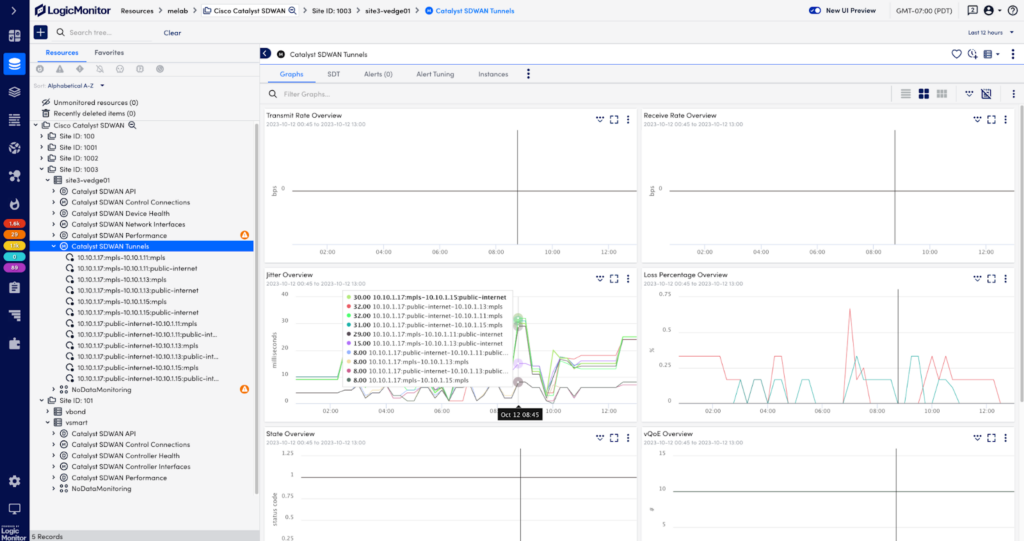
Preserving topology context for enhanced network management
Topology context preservation is a standout feature in LogicMonitor’s new UI, offering critical benefits for those managing complex network structures. This feature maintains the user’s situational awareness within network topologies, enabling more effective troubleshooting and network management.
Consistent experience across the platform
A consistent UX across the entire platform has been a major goal in developing LogicMonitor’s new UI. This consistency ensures that users have a seamless experience, regardless of the tool or feature they are utilizing.
Intuitive instrumentation for deeper insights
Intuitive instrumentation in LogicMonitor’s new UI empowers users with deeper insights and a more comprehensive understanding of their IT environments. This approach is designed to make complex data more accessible and actionable, catering to users at all levels of expertise and contributing to more informed decision-making.
Exploring LogicMonitor’s new UI’s features
Beyond the aforementioned improvements, LogicMonitor’s new UI offers a multitude of new features designed to enhance UX and productivity.
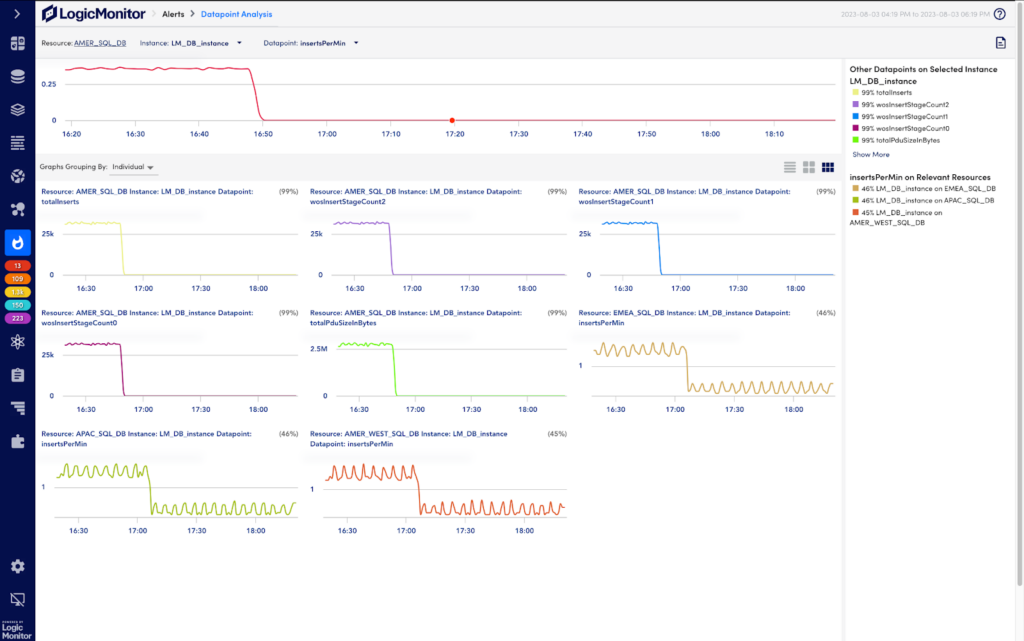
Datapoint analysis: A leap in data interpretation
The introduction of Datapoint Analysis in LogicMonitor’s new UI signifies a major advancement in how data is interpreted and visualized. This feature allows users to analyze their data with unprecedented depth, offering insights and analytics capabilities that facilitate more informed decision-making and efficient problem-solving. It’s a tool designed for those who need to perform complex data analyses, transforming raw data into actionable intelligence.
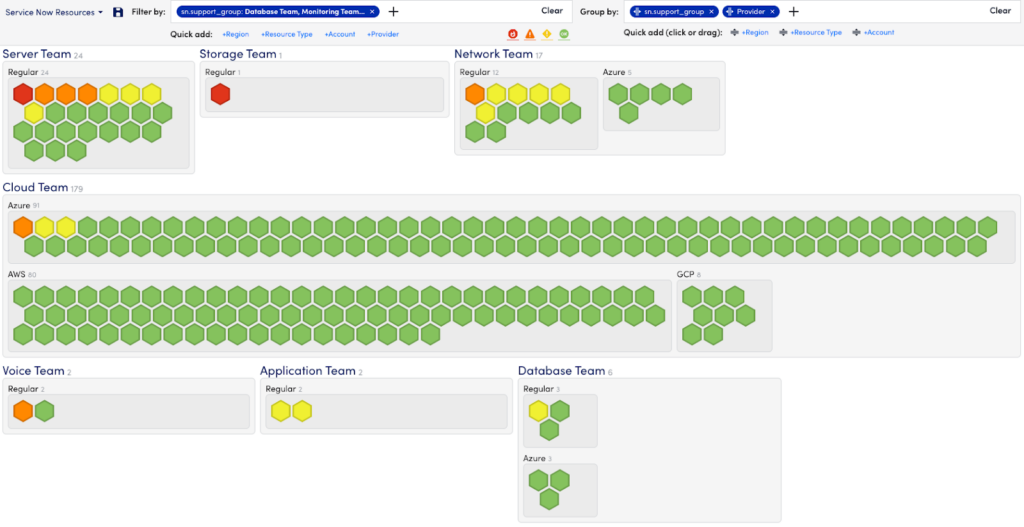
Resource Explorer: Comprehensive IT infrastructure monitoring
The Resource Explorer in LogicMonitor’s new UI revolutionizes IT resource monitoring and management. It provides a detailed, comprehensive view of the entire IT infrastructure, enabling users to pinpoint and address various issues at an accelerated rate. This feature is invaluable for overseeing large and intricate environments, offering clarity and control that significantly enhance operational efficiency.
Enhanced Resource Tree & Reports Navigation
LogicMonitor’s new UI’s Enhanced Resource Tree & Reports Navigation brings an organized, intuitive approach to managing IT resources. It simplifies the process of navigating through complex infrastructures, allowing users to easily find and analyze critical data. Some new features unique to the new UI:
The Enhanced AppliesTo IDE in LogicMonitor’s new UI offers a more streamlined and efficient way to target resources within the monitoring environment. This improvement allows users to write and debug complex dynamic groups and reports with greater ease, enhancing the precision and effectiveness of their monitoring strategies.
Event-driven ansible: Dynamic IT operations
Integrating Event-driven Ansible into LogicMonitor’s new UI marks a significant stride in automation capabilities. This feature enables dynamic and responsive IT operations by allowing users to automate tasks based on specific events within their environment. The synergy of Ansible’s powerful automation with LogicMonitor’s insights paves the way for a more proactive and streamlined operational workflow.
Selenium test & steps: Enhanced web application monitoring
Selenium Test & Steps in LogicMonitor’s new UI introduces an advanced level of web application monitoring. This feature allows users to simulate and test browser interactions, ensuring web applications perform optimally. It’s a crucial tool for maintaining the best UX on web platforms, showcasing our commitment to comprehensive monitoring solutions.
Usage reporting: Insightful data on resource utilization
The enhanced Usage Reporting feature in LogicMonitor’s new UI provides in-depth insights into resource performance and usage patterns. This advanced reporting tool assists IT professionals in making data-driven decisions, optimizing resource allocation, and planning for future infrastructure needs.
Availability and rollout of LogicMonitor’s new UI
The new LogicMonitor’s new UI has already been released to the majority of our customers. With V197 we are in the final stage (between December 11 and December 20) of the rollout that started months ago. Users can access the new UI by clicking the LogicMonitor’s new UI toggle in all portals. This phased rollout ensures a smooth transition and allows users to familiarize themselves with the new features at their own pace.
The road ahead: LogicMonitor’s new UI’s exciting future developments
Upcoming features in LogicMonitor’s new UI: Enhancing monitoring and management
Users can look forward to the general availability of several key enhancements which will all be ready before 2023 ends:
Dashboard Filters: Tailored for resource-specific insights, allowing for more targeted and efficient monitoring.
Alert Health Check Report: A feature designed to provide comprehensive health reports, enhancing proactive monitoring.
Alias Manager/Property Normalization: Streamlining data categorization for more organized and efficient data handling.
Azure Lighthouse and Container Registries Support: Expanding cloud monitoring capabilities.
Kubernetes and Cloud Topology: Offering more detailed and actionable insights into cloud-native environments.
Topology Node Grouping and Zoom/Magnifier: To facilitate better navigation and understanding of complex network structures.
LM Container Upgrade Workflow Improvements: Streamlining the container upgrade process for enhanced efficiency.
Forensics for Logs and APM Traces: Providing deeper insights into application performance and log data.
SNMP Traps as Logs: Integrating SNMP trap data for monitored resources into the log management framework.
Config Gold Standard and Config Identifier/Comparison: Elevating configuration management to new levels of precision and ease.
Looking forward: Advanced monitoring solutions
This new UI promises even more advancements in 2024, focusing on elevating environmental monitoring and network management for the year ahead:
Meraki Environmental Sensors: Introducing real-time environmental monitoring, crucial for safeguarding IT assets in sensitive conditions.
Cisco Catalyst Wireless Access Points: Enhancing wireless network monitoring with improved visibility and control.
RBAC on Access Groups: Implementing role-based access control for better security and management.
Cloud Billing/Spend Visibility and Cost Optimization: Offering insights into cloud expenditures, aiding in cost-effective cloud management.
Websites LogicMonitor’s new UI: A refreshed and enhanced UI for an even more intuitive experience.
Embracing the future: The launch of LogicMonitor’s new UI
LogicMonitor’s new UI is more than just an update; it’s a testament to LogicMonitor’s dedication to evolving in sync with our users’ needs and the technological landscape. We eagerly await your feedback and engagement with the new UI, as it represents a collaborative effort to push the boundaries of IT monitoring. This launch is pivotal in our journey, marking a new era of innovation and user-centric design.