The Technical Operations team at LogicMonitor is charged with keeping LogicMonitor’s SaaS-based application running at all times, day or night, and has someone on-call 24/7.
5 min read
April 10, 2015
In this article
NEWSLETTER
Subscribe to our newsletter
Get the latest blogs, whitepapers, eGuides, and more straight into your inbox.
Thank you!
Your video will begin shortly
SHARE
In this article
The Technical Operations team at LogicMonitor is charged with keeping LogicMonitor’s SaaS-based application running at all times, day or night, and has someone on-call 24/7. The uptime and security of LogicMonitor’s application is the highest priority for the team, but there are also other services that fall under its umbrella. Some are customer impacting such as the services that the LogicMonitor customer support team uses, and some are internal corporate resources such as JIRA and Confluence (our internal issue tracking platform and wiki, respectively). The TechOps team also plays a large role in supporting and securing developer environments, including aspects of the build and test systems.
It will come as no surprise that the monitoring platform used by TechOps at LogicMonitor is…LogicMonitor! All aspects of all the systems mentioned above are monitored to the highest degree possible. It is where LogicMonitor excels: from hardware to OS to database and application, everything is in the system. Even 3rd party services we utilize are monitored (via LogicMonitor’s SiteMonitor). Due to our extensive use of the platform, it is extremely rare for any sort of issue to arise that the TechOps team is not made aware of almost immediately. This goes with a favorite slogan of mine, said from the perspective of someone in Ops: if your boss or your customer is telling you of an issue before you are aware of it, your monitoring system has failed.
Having said all of this, regardless of how well everything is monitored, TechOps has to be prepared for a situation where a fault was not automatically detected. Using LogicMonitor and our corporate issue tracking system, JIRA, we created a way for employees to sound the alarm and notify TechOps, day or night, of an issue that needs to be addressed immediately. The neat thing about this approach is the notification will follow the same alerting path that is used for normal alerting and escalation in our LogicMonitor account, meaning it will first notify the on-call engineer, and then quickly escalate from there.
The first step was defining the JIRA issue type in the TechOps project to use for automated alerting. We chose two:
Issue Type
Use Case
Examples
Outage
Any issue pertaining to the LogicMonitor platform that renders the service unacceptable from the perspective of a customer
Account is unavailable
Data is not being gathered
False alerts are being generated
Service Disruption
An internal LogicMonitor resource is not available or not functioning in an acceptable manner, preventing employees from doing their job
The next step was defining when a ticket of this type should generate an alert. We decided there should be an ERROR alert in LogicMonitor if any tickets exist in an “Open” state for either issue type, which will then alert the TechOps team via their normal LogicMonitor escalation chains.
We achieved the above by creating a datasource “JIRA Issues Count” (available for import from the LogicMonitor core repository) that simply runs “JIRA Query Language” (JQL) queries against our JIRA instance using the JIRA API. The queries are simple:
Description
JQL
Open Outage Tickets
Project=”Technical Operations” AND issuetype=Outage AND status=Open
Open Service Disruption Tickets
Project=”Technical Operations” AND issuetype=”Service Disruption” AND status=Open
As described in the help page for the datasource, each of these queries is entered as a datasource instance, with the “Instance Name” being the description and the “Instance Wildcard Value” set as the raw JQL query. The result is the datasource will query our JIRA server and get the number of each of the above records returned. If the number is greater than zero, an ERROR is generated in LogicMonitor. Once an alert is generated, the recipient can acknowledge the alert, or transition the ticket from an “Open” state to “In Progress”, causing the JQL result to not match.
In our setup we also have two additional datasource instances that keep track of the number of “In Progress” issues and cause a WARN alert to be generated if any exist. This serves to keep track of how long an issue takes to resolve, as well as making it so other TechOps engineers can see in the Alerts tab that there are unresolved “Outage” or “Service Disruption” tickets.
Description
JQL
In-Progress Outage Tickets
Project=TECHOPS AND issuetype=Outage AND status=”In Progress”
In-Progress Service Disruption Tickets
Project=TECHOPS AND issuetype=Outage AND status=”In Progress”
The end result is the TechOps team can be alerted to issues raised by anyone in the company simply by creating a Jira issue, and all TechOps engineers can easily see if there are any outstanding issues.
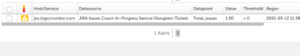
Here’s an example of an “In Progress” service disruption alert (in WARN state):
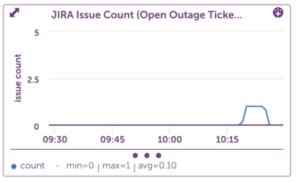
We can see how quickly an outage ticket went from “In Progress” to “Closed”, or “Open” to “In Progress”:
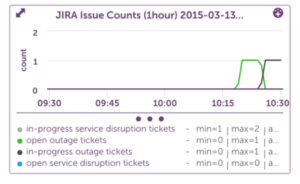
And finally, with the Overview graph, we can see all states on the same graph:
This datasource could be used for any number of purposes, including simply keeping track of the number of the different types of issues, or perhaps warning if a specific issue type had fallen out of its SLA (it should have been resolved within 4 hours, say).
Leave a comment if you come up with interesting uses!