Observability, which originated from control theory, measures how well you can understand a system’s internal states from its external outputs. Observability uses instrumentation to provide insights that aid monitoring.
In DevOps, gaining observability is achieved through a set of monitoring solutions. The shift to use one vendor platform to do so, versus multiple solutions, make sense as:
Deployment of agents/collectors of different monitoring platforms creates significant initial and ongoing overhead for an Ops team.
Troubleshooting flows cross-platforms hardly exist. This means that the DevOps engineers need to learn different tools and how to regain context while troubleshooting (e.g. different query specs), or else it will result in high MTTR.
An Observability Suite Is Not Just a Vendor Upsell!
While the upsell might be the outcome, the goal is to deliver a flawless user-experience between metrics, logs, and tracing.
While evaluating any Observability Suite, you should ask yourself:
Do I need to deploy multiple agents, one for each type of data (logs, tracing, metrics, etc.)?
Do I need to create a template (or regex-rules) to align logs and metrics for the same resource?
Once an alert on a metric is created, do I need to write a query to retrieve the relevant logs?
If you answer yes to even one of these questions, you are likely facing an upsell attempt rather than evaluating a platform that will improve the user experience through comprehensive observability.
Eventually, you should ask yourself: Will this Observability suite truly reduce MTTR, or will it cost you more but deliver the same business outcomes as you have today?
The Holy Grail: One-Click-Observability™
At LogicMonitor, we believe that users should be able to gain full observability in one click. Our platform is able to connect the dots between metrics, logs, and traces straight out of the box. There is no need for templates or regex-rules to match metrics, logs, and tracings.
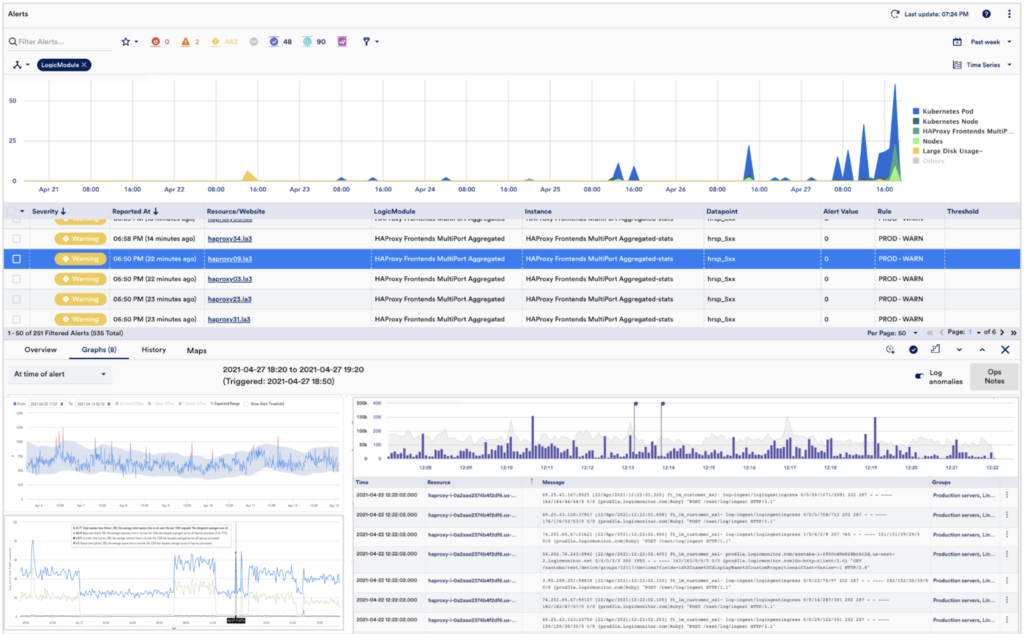
Once an alert is triggered through a static threshold (or anomaly detection), LogicMonitor users can obtain full observability without typing a single query.
In one click, users can easily answer the following questions:
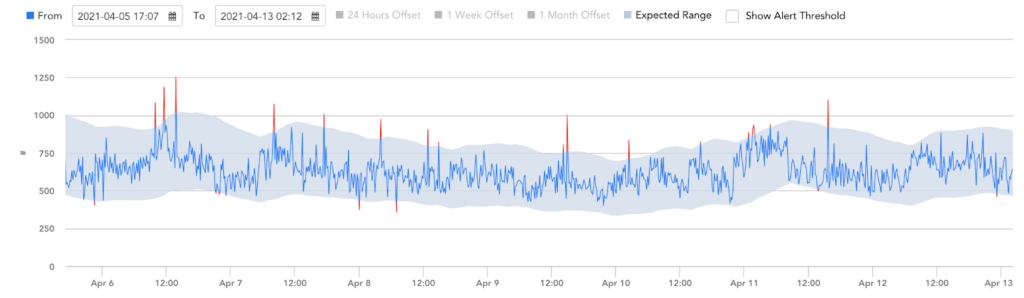
Is this abnormal or not compared to 24 hours, 7 days, and a one month offset?
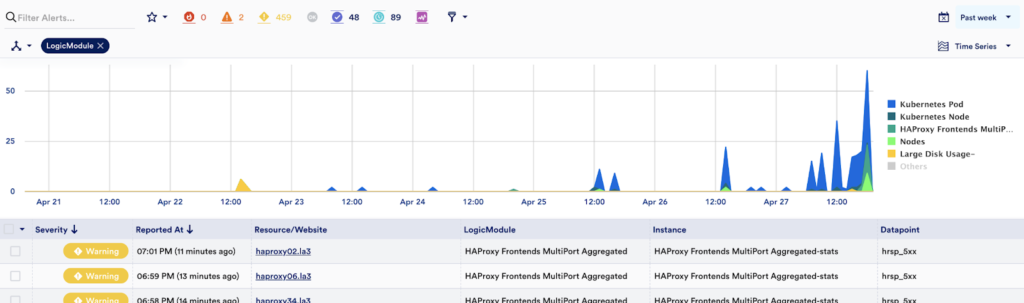
Is this an alert storm? How are these alerts related?
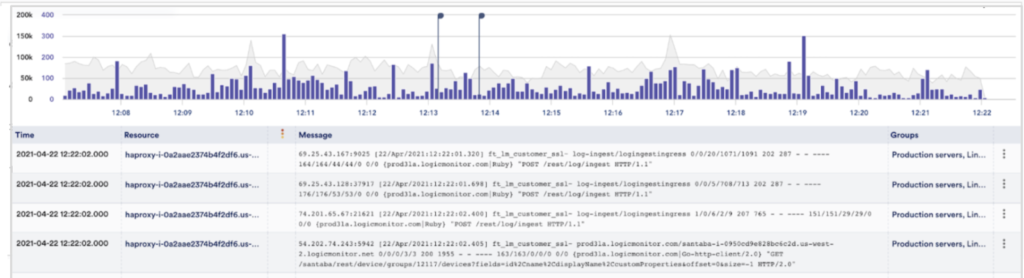
What are the log anomalies and raw logs at the time of the alert?
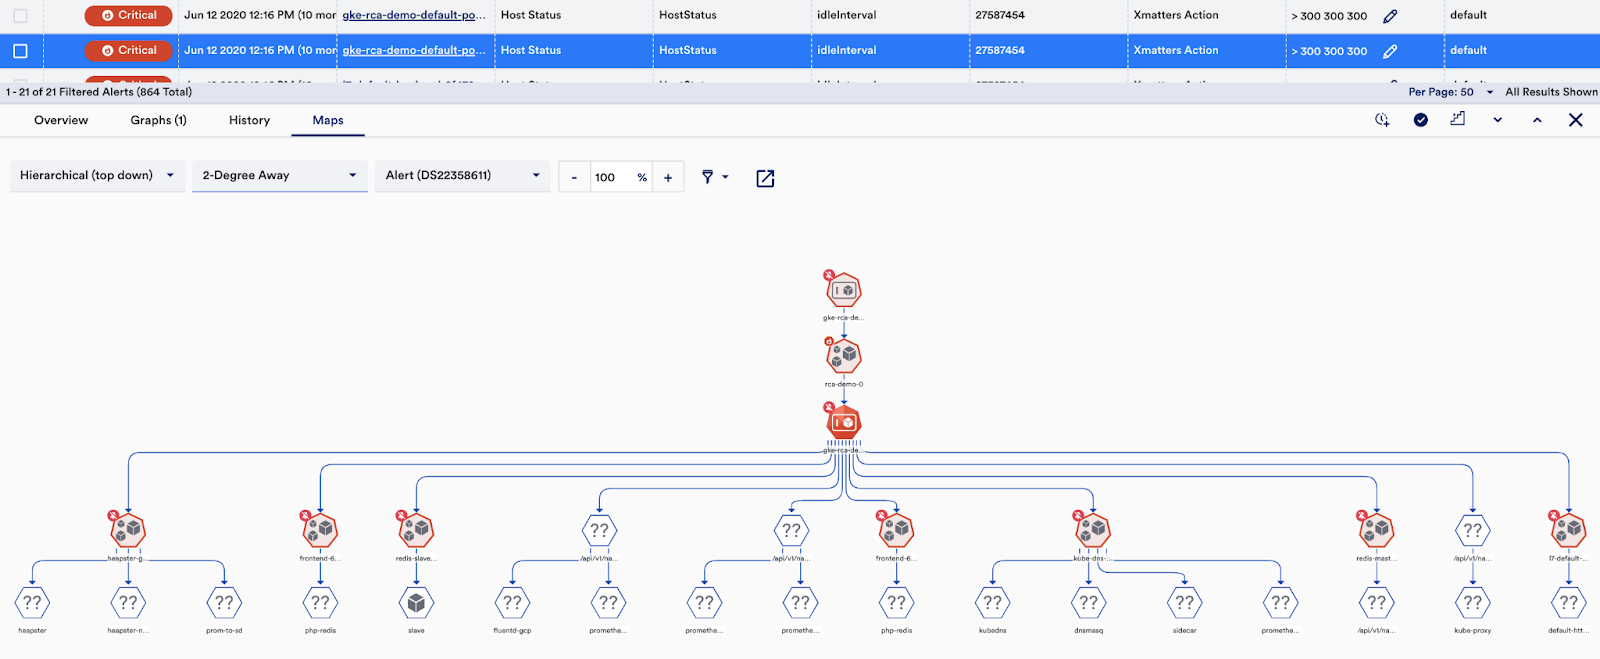
Are any other resources impacted?
Measuring the User Experience Through One-Click-Observability™
Observability platforms are expanding behind metrics, logs, and tracing, additional use-cases such as error monitoring and synthetic transactions are added.
The observability challenge is no longer a Big Data challenge (most of the platforms already solved this problem). Now it is a user experience challenge, and a great way to measure it is through One-Click-Observability™.
Summary
As you modernize the architecture for your digital enterprise or cloud applications, one of the goals must be to build complete observability across every level of your application framework– including metrics, logs, and tracing. Such an observability framework is instrumental in delivering a flawless user experience.
Disclaimer: The views expressed on this blog are those of the author and do not necessarily reflect the views of LogicMonitor or its affiliates.