

We’ve recently put in a big chunk of work to update our Palo Alto monitoring suite. Palo Alto exposes very little data by SNMP, so creating these particular LogicModules was a bit more work than usual. To get the best data we now plug in to their API to get the real meaty performance metrics.
Word on the street is that Palo Alto Networks is now a go-to vendor for intrusion prevention, full-stack inspection, and VPN. As a testament to its popularity, we’ve had our fair share of customers and prospects ask us for in depth monitoring of Palo Alto devices.
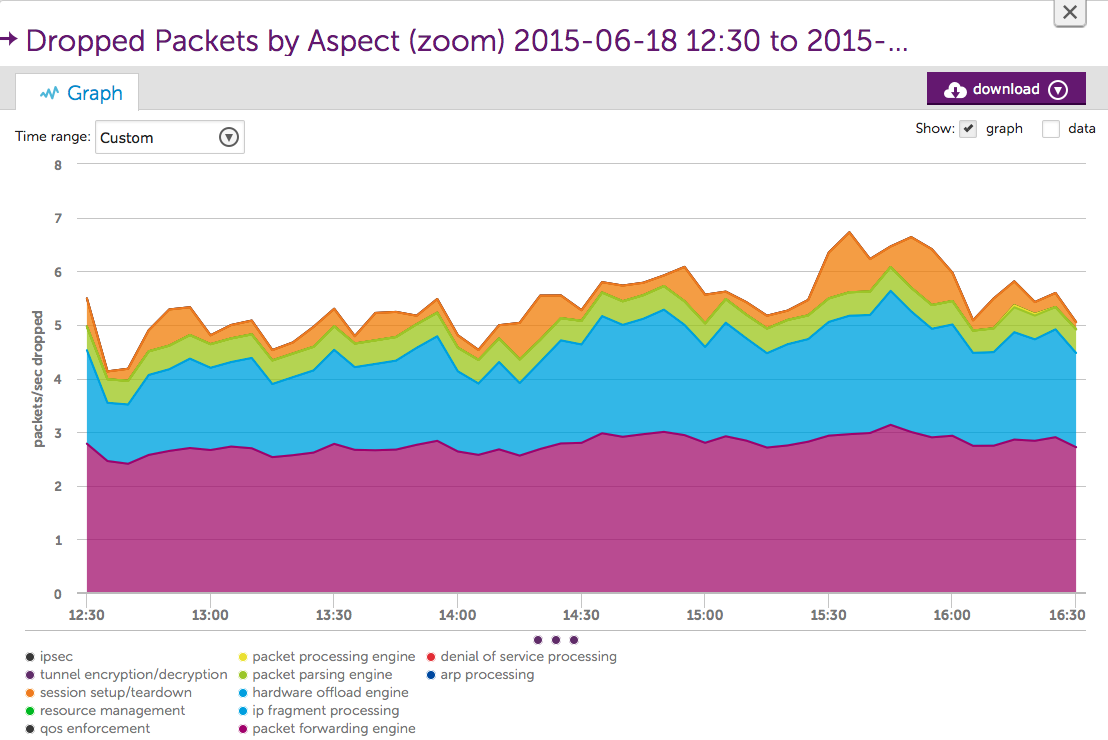
We’re of course monitoring all of the standard stuff: network throughput, CPU usage, power, fans, temperature — all important metrics, but that’s the minimal stuff you’d expect. The nonstandard performance metrics we’re pulling include packet handling (see graph below), session detail — including session utilization within any virtual system — High Availability pair status, OSPF neighbor status, BGP peering detail. And… drum roll…if you’re using their Panorama management portal we monitor that as well! So you can make sure all of your device policies and configurations remain in sync with the mothership.
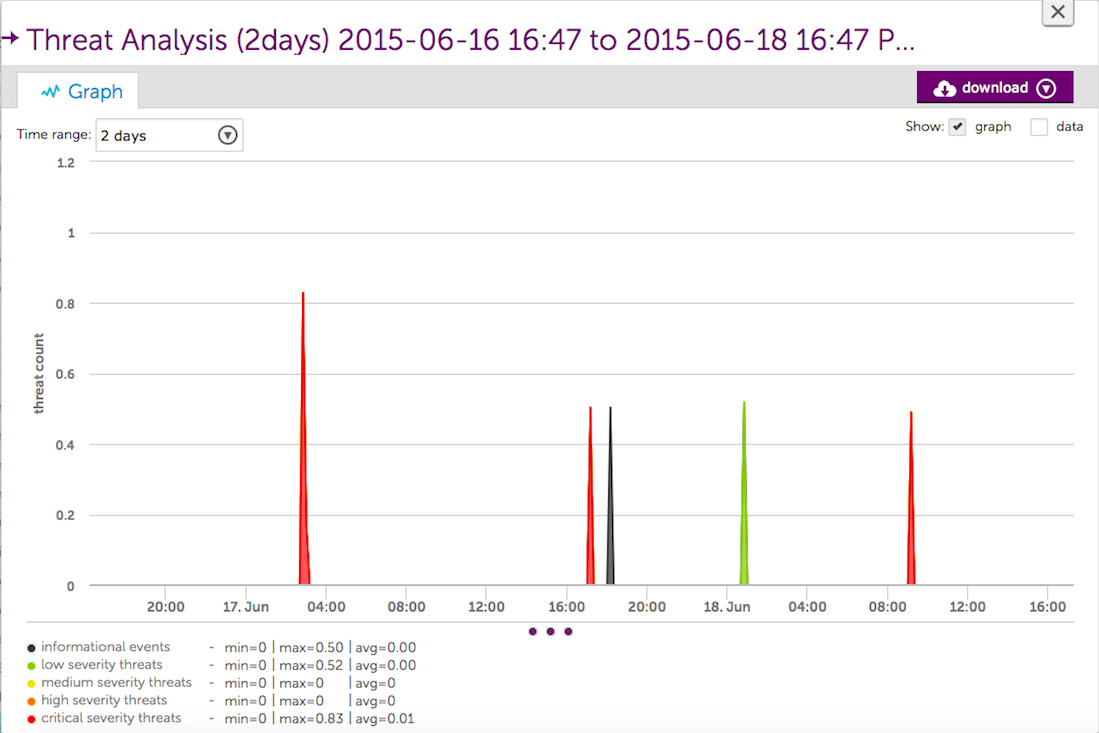
Additionally, as part of the new Palo Alto monitoring we released a revamped Threat Analysis LogicModule, which will tell you how many threats your device has detected, categorize them by severity, and issue an alert if the threat volume has exceeded a reasonable threshold.
What’s the point of monitoring your firewall if you’re not checking that’s it’s doing what it’s supposed to do? Since you’ve spent the cash on Palo Alto hardware, make sure you’re getting the most out of your investment by monitoring it end-to-end with a complete operations monitoring solution.


