Preventative SQL Server Monitoring

LogicMonitor + Catchpoint: Enter the New Era of Autonomous IT

Proactively manage modern hybrid environments with predictive insights, intelligent automation, and full-stack observability.
Explore solutionsExplore our resource library for IT pros. Get expert guides, observability strategies, and real-world insights to power smarter, AI-driven operations.
Explore resources
Our observability platform proactively delivers the insights and automation CIOs need to accelerate innovation.
About LogicMonitor
No matter the kind of database – Oracle, SQL server, MySQL, PostgreSQL, etc – there are distinct kinds of monitoring for the DBA. There is the monitoring done to make sure everything is healthy and performing well, that allows you to plan for growth, allocate resources, and be assured things are working as they should.
Then there is the kind of in depth activity that DBA’s undertake when they are investigating an issue. This takes far more time, and uses a different set of tools – the query analyzer, profilers, etc – but can have a large impact, and is where a good SQL jockey can really make a difference. But given the amount of time that can be required to analyze and improve a query, when is it worth it?
This post is a quick look at some indicators as to when SQL server monitoring tells you to go more in depth.
 If there is a big change (for the worse) in any of your metrics over time. Full scans per second is a good indicator of a missing index, that can often be easily improved and have a large performance benefit.
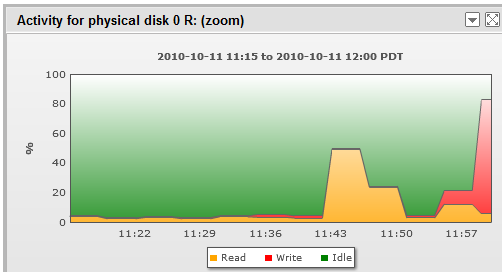
Of course, non-DB monitoring needs to be tracked, too – and as every good DBA always blames the performance of the disk storage system, keep a close eye on that, and keep ahead of issues there. For example, a DBA may first blame the disk system on seeing a graph like this:


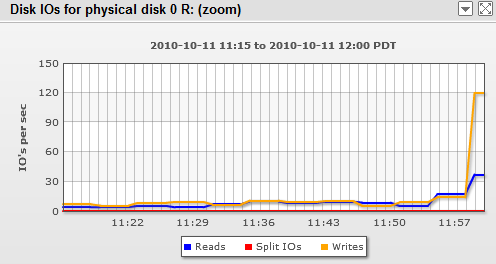
but if the disk is being made busy by an increase in operations from the database, the monitoring is just indicating that the DB workload has changed to put more load on the disks. (In this case, check disk latency graphs to see if the disks are keeping up.)
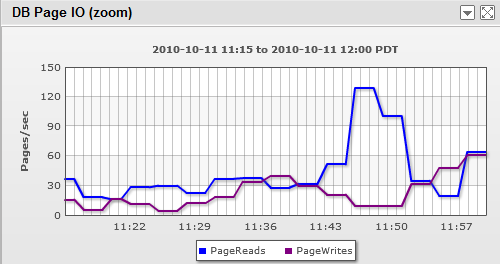
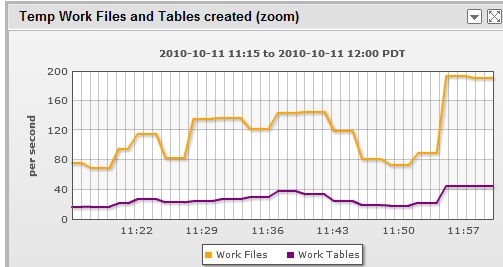
The savvy DBA will then check the database page statistics, but finding no cause there, notice that the temporary objects increased in correlation with the increased disk IO.


Now he has a target for in depth tuning – query plans can often be tuned to minimize the use of the tempdb, and by doing so, he can justifiably claim to have enabled the deferment of a large capital expense (faster disk systems for the database.) He’ll even have the before/after disk usage graphs to prove it – he can just zoom in to not show the bit where the temporary object usage went up for the first time!
What are your best canary in the coal mine metrics for triggering in depth review? Leave a comment to let us know.
Want to learn more about monitoring, and how to practice safe operations in your environment? Setup a free trial of LogicMonitor, and get a consultation with one of our experienced operations staff.
Free Trial.
© LogicMonitor 2026 | All rights reserved. | All trademarks, trade names, service marks, and logos referenced herein belong to their respective companies.
