Expanded cloud coverage, advanced log analysis workflows, new application topology views, and more. Check out LogicMonitor’s Spring ‘23 product enhancements here.
Over the past few months, LogicMonitor released a number of enhancements to the LM Envision platform across all of our solutions. We’re excited to share some of these new capabilities with you. We’ll begin by looking at a few recent innovations within LM Envision, LogicMonitor’s unified monitoring platform.
LM Envision Platform
Firstly, LogicMonitor extended our best in class coverage to include Juniper Mist. As an official Juniper Mist Technology Partner, the LM Envision platform provides monitoring for Mist-managed Access Points, EX-Series Switches, and Session Smart Routers. This enables network service managers to track health, capacity, and performance trends, so they can provide proactive support rather than waiting for incidents or problems to occur. For more information, check out the Juniper Mist Integrations page.
Next, we added an HPE Aruba ClearPass Policy Module for network access control. This new module enables IT to detect issues with authentication, authorization, policy handling, and changes in the overall Policy Server performance, and it provides insights into various network traffic metrics ranging from simple HTTPS information to authentication-specific intel, such as RADIUS, WebLogin or SAML. For more information, here is the documentation.
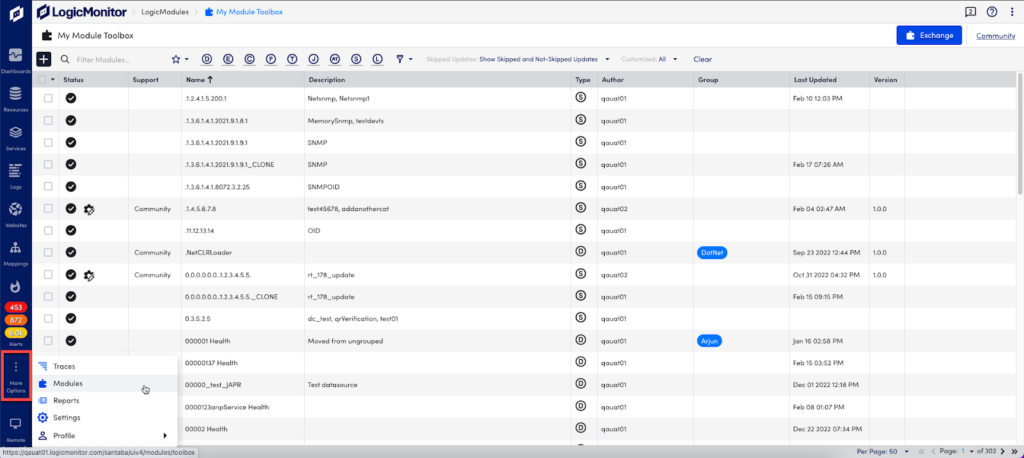
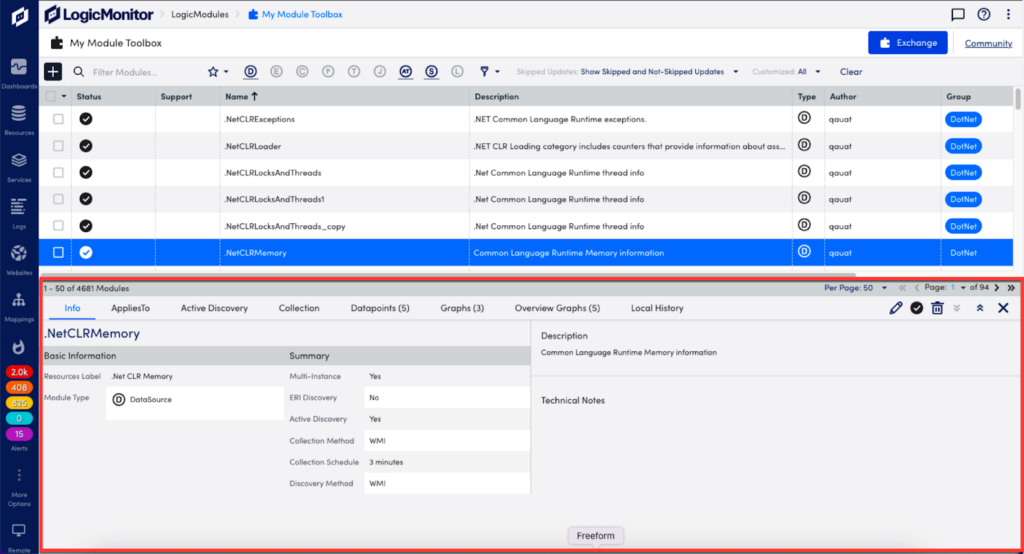
We also made some changes to the UI to provide a better customer experience. The formerly named Installed Modules tab is now the Toolbox. This is where users will update, create, edit, and delete locally installed modules and commit them to the LM Exchange. In addition, the My Modules and Public Repository tabs will be combined into the Module Store. This is where users can interact with items available in the LM Exchange. This will include Core, Community, and self-published modules. In the Module Store, users can now manage their locally installed LogicModules with a cleaner UI and have more options to filter down to what they want to view. They can also more easily manage their own contributions or privately versioned modules.
The LogicModule Editor was also upgraded. It’s easier than ever for users to create, edit, and test LogicModules in the new UI, as well as update LogicModules without overriding customization. Users can also commit and publish them to the LM Exchange from the editors.
For more information about Modules, see our documentation. And please stay tuned for more product news later this year, including more enhancements to the UI!
Cloud
We are expanding monitoring coverage with support for four new AWS regions. We also released new Azure topology coverage to map common Azure services and determine relationships such as VM scale sets to virtual machines. This can be used as a starting point for troubleshooting and to help visualize the environment. Customers can see what’s connected and better understand their Azure environments. Now alerts are visually overlaid on a map so you can locate errors quickly and troubleshoot them faster, improving MTTR.
We also improved Azure Databricks datasources to remove completed jobs in a timely manner, so you can save time and focus on the jobs that require immediate attention. We also added support for Azure Databricks Application Status monitoring, so you can quickly know when applications are not in a good status and prioritize those for troubleshooting.
Additionally, Kubernetes monitoring enhancements include better visibility into cluster role based access controls. You can use topology and configuration monitoring for Kubernetes cluster roles, cluster role bindings, and service accounts.
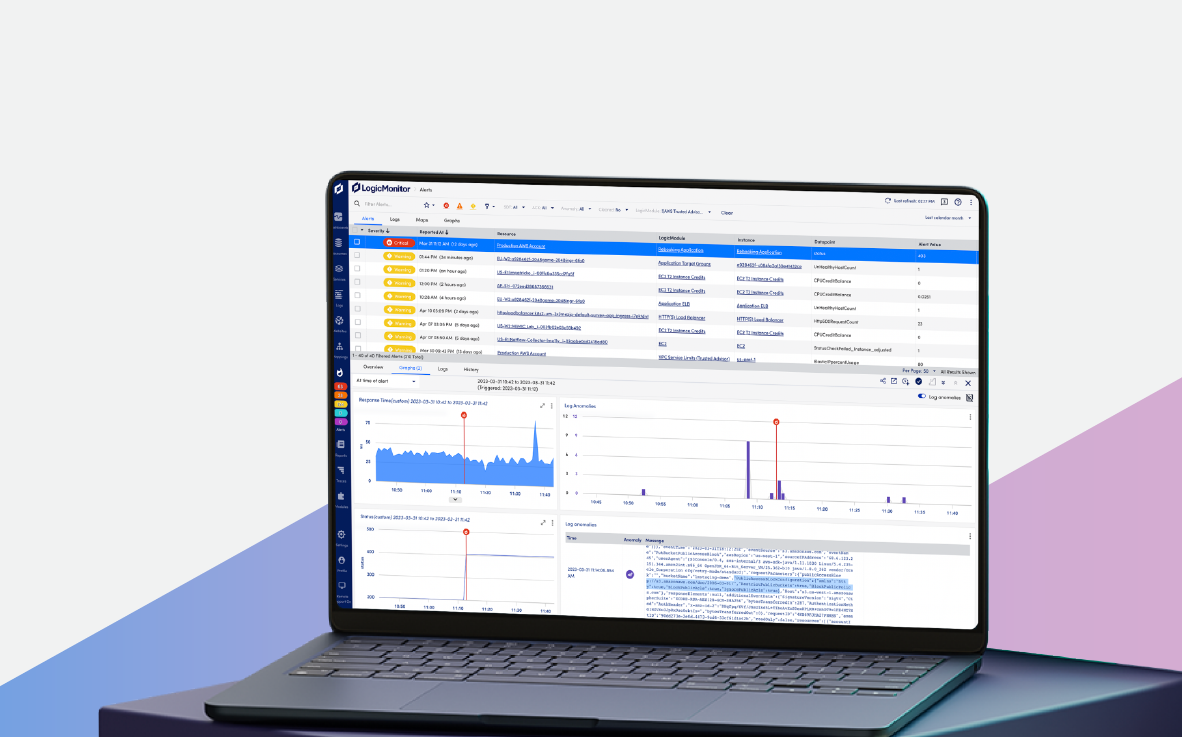
LogicMonitor enhanced our log analysis workflows in quite a few ways. We released Advanced Search capabilities with more precise ways to narrow down the massive amount of log volume within hybrid cloud environments. We now support advanced operations and Regex within each log query to parse out values from log messages, and users can view the results in Aggregated views to sort by min/max/count.
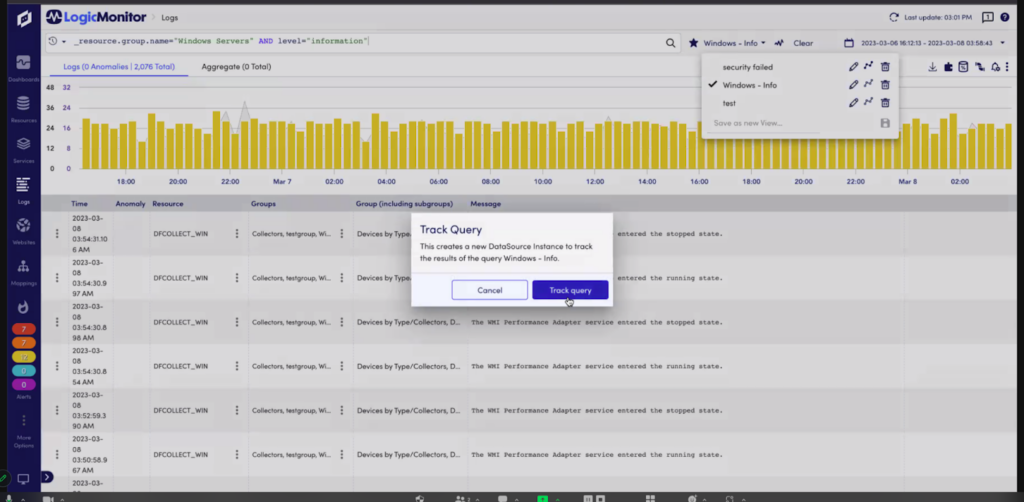
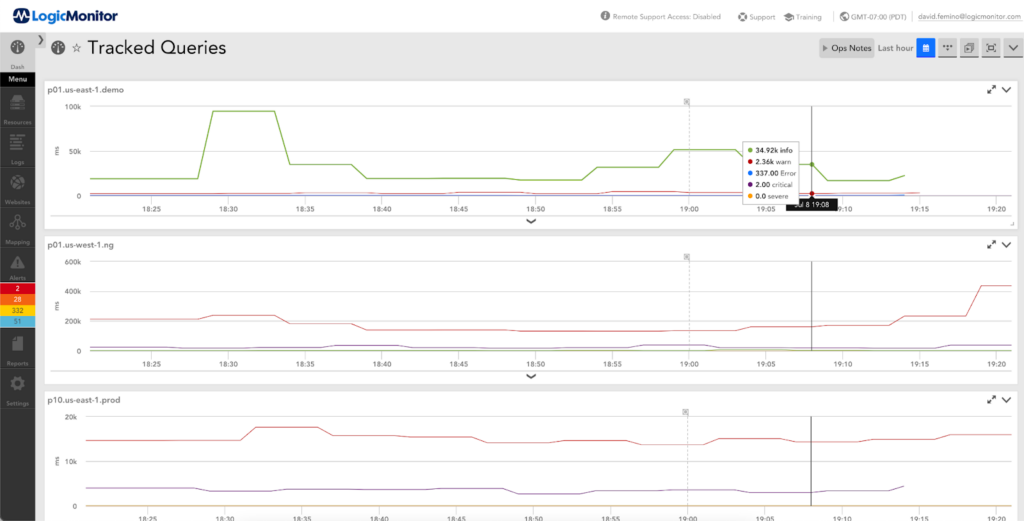
LogicMonitor also released “Query Tracking” for analyzing the amount of log data generated by your IT devices. Users can save popular log searches as tracked queries with one click, which become LogicMonitor data points to visualize within LogicMonitor dashboards, just like any other datasource, keeping an early eye on trends with our dynamic threshold and forecasting capabilities.
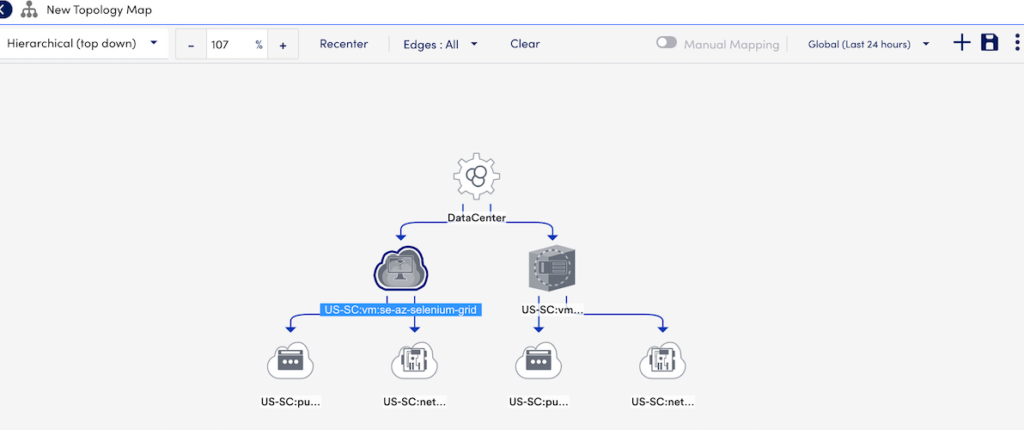
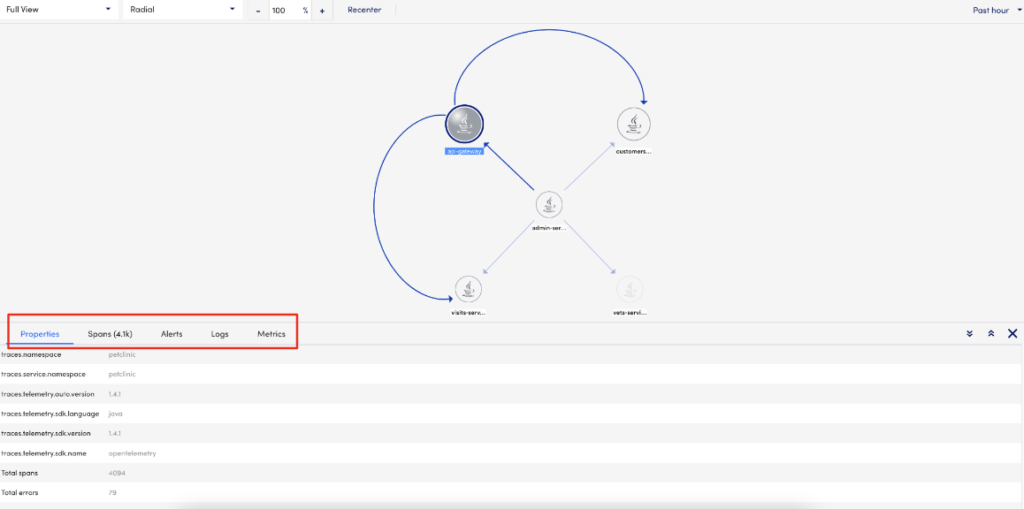
LogicMonitor improved our APM workflows with a new Application Topology view. We now provide a real-time view into the application service architecture, showing relationships between services and critical RED metrics of throughput, latency, duration, and error rates. This new topology map is automatically generated based on the ingested trace data for applications that are being monitored. It’s now much easier for users to identify any downstream or upstream implications on application performance and then continue drilling down into the traces to see any related alerts, logs, and metrics.
Stay tuned for more improvements to connecting application performance with the rest of your overall hybrid cloud infrastructure.
Application Topology view of services within a given namespace