
We are living in an era where everything depends upon data, any application you are using or that you are creating is going to either consume or create data. LogicMonitor REST API makes it easy for customers who prefer to use APIs to access features without performing activities manually via a UI. LM API allows end-users to perform several activities with added security and reduced efforts.
As of today, we are offering v1, and v2, and now have v3 as base versions of API & SDK going further. On average, LogicMonitor has ~2.5m external API hits per day and this is a consolidated count with all the versions of API & ~0.4m SDK hits per day (Python & GO).
What is LogicMonitor REST API?
LogicMonitor REST API is a product used to access LM Envision – LogicMonitor’s AI-Powered Hybrid Observability platform.
The LogicMonitor REST API exposes all sorts of LogicMonitor functionality via REST resources and HTTP methods including:
- Customer onboarding tasks such as adding devices, creating device groups, Adding websites, and creating alerts
- Infra monitoring tasks like audit logs, extracting a data source, datapoint details, escalation chains, and alert rules
- Infrastructure updating tasks like updating Ops notes, reports, and recipient groups
LogicMonitor REST API framework ensures developers don’t need to invest efforts in building wrapper code. Our SDK, Scripts, and API docs touch base on all business aspects of guidelines, authentication, versioning, formats, usage, and rate-limiting. This empowers our customers to quickly integrate our REST API and flex our muscle from IT infrastructure all the way up to business outcomes.
LogicMonitor offers integration with third-party service providers via REST APIs to allow our customers to link their data and gather insights from ServiceNow, PagerDuty, AutoDesk, Slack, and Connectwise. Not just restricting ourselves on this, we offer webhooks for customized integration to further improve our API experience.
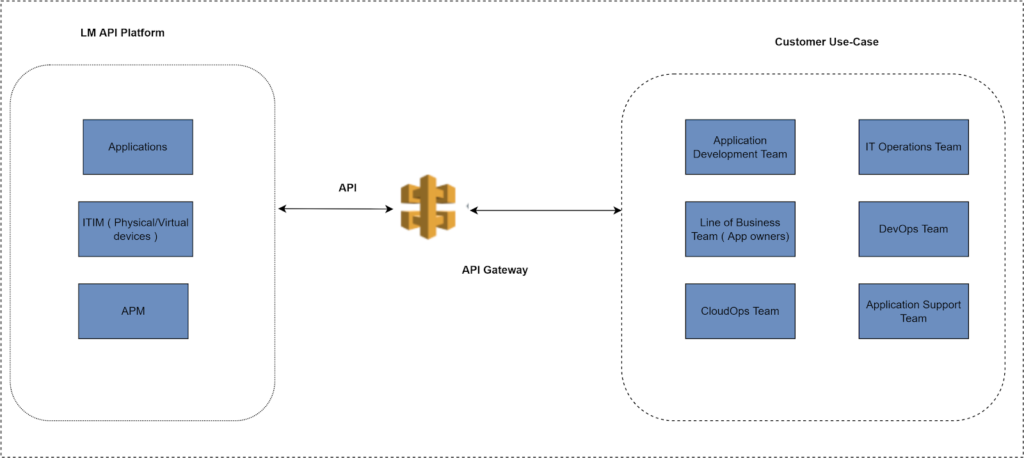
There are several use cases where REST APIs enable customers with contextual & correlated insights from their data collected via LogicMonitor. Let’s dive into Resource/Configuration Management API & Reporting API use cases.
Resource/Configuration Management API :
LogicMonitor is keen to provide a lot more managing operations via API. With a volatile ITOps environment, our customers need to swiftly tap on the configuration of Devices, Websites, and applications to manage uncertainty.
CRUD operations PUT, PATCH leverage operations like update, replace device/websites groups, its properties and enabling/disabling. Secondly, you can even retrieve the Time series metric data via API, which yields correlation, aggression, analysis, and debugging. You can further slice and dice the data, store it in a local database, and recall it based on business needs.
Onboarding operations for tenants, adding a new group (Static/Dynamic), adding devices, adding properties, scheduling SDT, and adding websites groups are capable via LM API.
LogicMonitor ensures that customers get value-added insights data and can retrieve the data to the fullest at any point in time.
For example, you can use a GET call to further retrieve the details of your devices, group counts, data points, data source, instances, reports, alerts, users, and admins with enhanced security tokens to further validate that the communication is trustworthy.
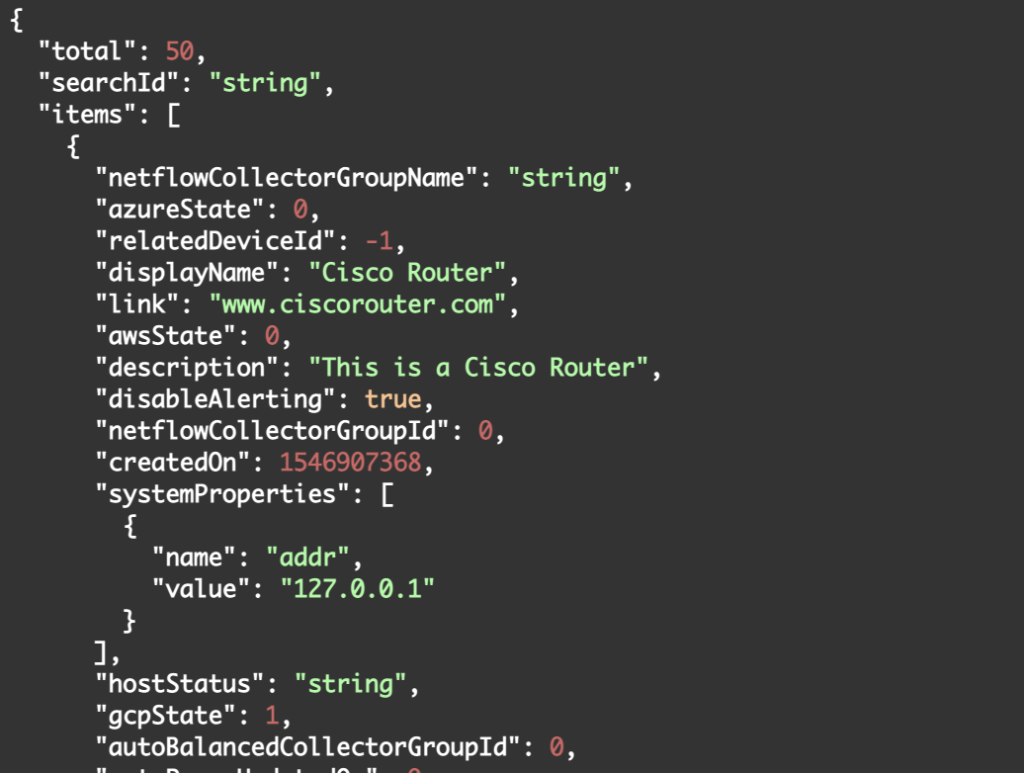
To fetch the detail of all the devices, you could call
- GET: /device/devices – To get all the devices list. Below is the snippet of the expected response
To create a new device group, we can use the following
- POST: /device/groups – To add device groups, you could explicitly update the body with the below param.
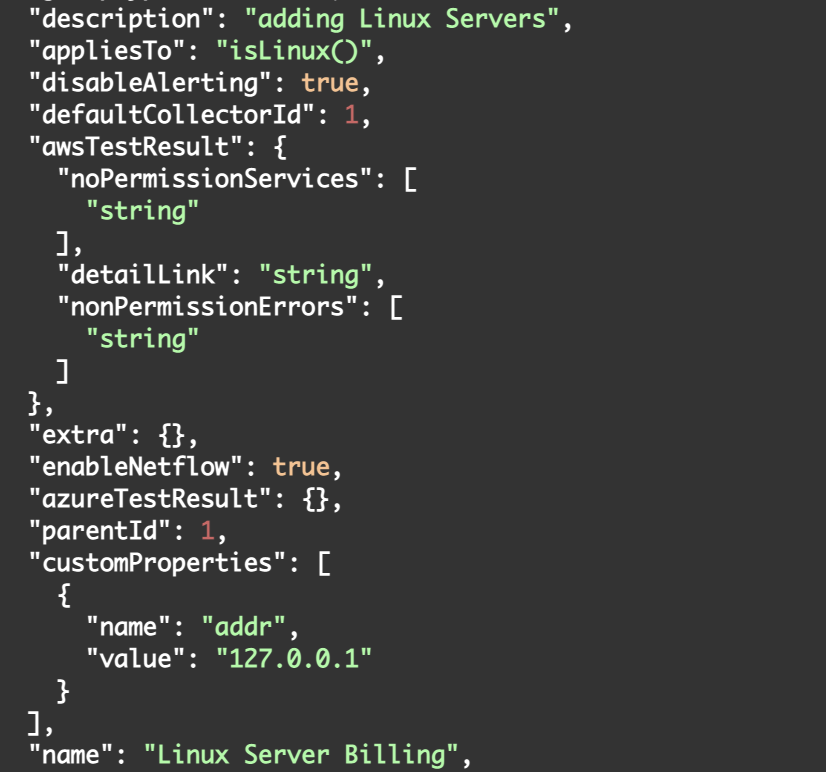
You could further use query parameters like
- appliesTo – specify the device group type ( example: isLinux() will create a dynamic group of type Linux & and an empty string will create a static group )
- name – assign the name of the device group
- defaultCollectorId – allocate collector to the device group
Reporting API:
Reports aim at informing managers and coworkers on different aspects of the business to help them make better-informed decisions. LogicMonitor reports collect data from various key performance indicators (KPIs) and present themes within LM Envision. Data via the Reporting API helps answer how the company is doing, empowering decision-makers to find the right path operating efficiency and remain competitive.
These reports provide insight into the consumption of storage, CPU, track unplanned downtime, resource inventory, various aspects of monitored data, and help optimize costs and risks.
In addition, these reports provide an overview of your monitored infrastructure and assist in providing actionable senses. Thus, enabling you to customize and obtain reports that display data based on your business needs. ITOps teams can use these reports’ details to take necessary actions.
For example, you can create a report that can display all of your alerts along with other details for the past 2 hours. If required, you can further filter the report based on Groups, Resources/Websites, Instances, Alert rules, Severity, SDT, and niche parameters to further fine-tune the reports as per business needs.
All you need to do is to call the Reporting API available in our Doc.
- POST: /report/reports – To add a new report, you could explicitly update the body with the below param.
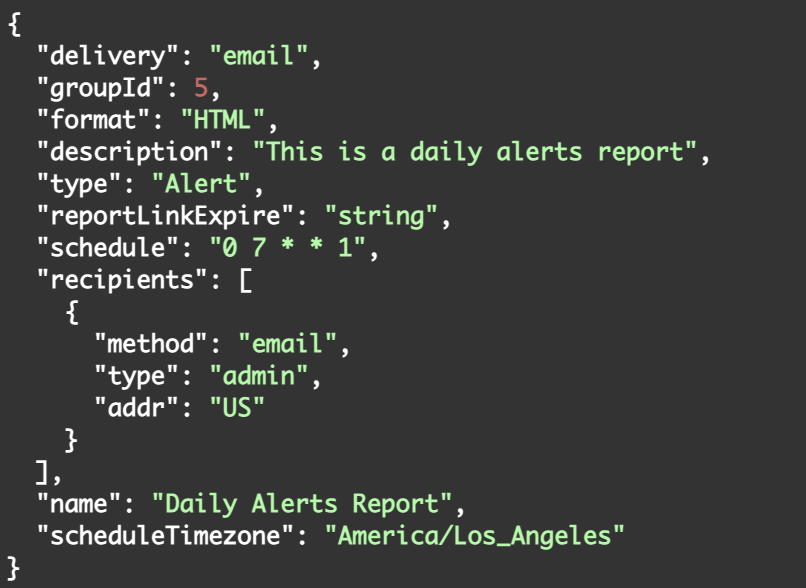
You could further use query parameters like
- ‘type’ – specify the type of the report ( example: Alert SLA report, Dashboard report, Audit log report )
- ‘Format’- specify the format of the report( example: HTML, CSV, PDF )
- ‘name’ – assign the name of the report
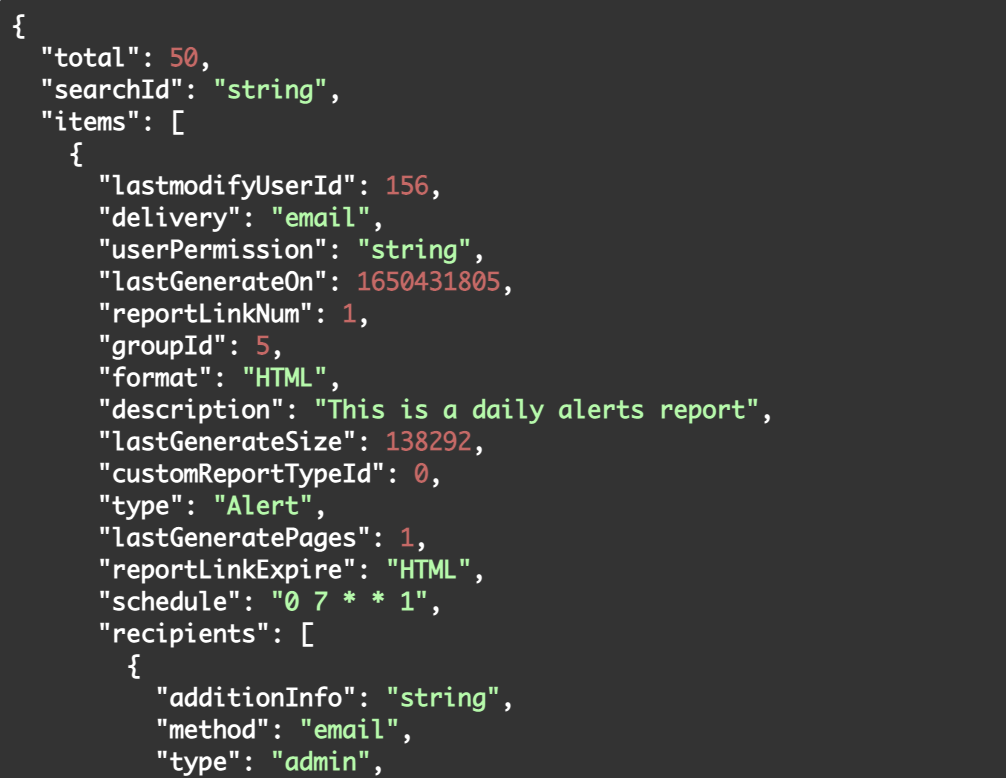
- GET : /report/reports/ – to get list of all existing report
Below is the snippet of the expected response
LogicMonitor API REST supports customers who prefer to use APIs for accessing data instead of through LM Envision’s UI. For more details visit the REST API Support Guide in our Support Center.