

Every time you load a webpage or send data online, your device establishes a Transmission Control Protocol (TCP) connection to keep that communication reliable. These connections typically begin with a three-way handshake and end with a graceful termination using FIN flags, but sometimes they terminate abruptly with a TCP reset (RST).
A TCP RST is a segment sent by one side to immediately terminate the connection without following the standard teardown process. This can happen for normal reasons, like closing a browser tab, or for abnormal ones, like network errors, misconfigurations, or attacks.
In this guide, we’ll explain how TCP connections work, why resets happen, and how to tell normal behavior from possible problems. You’ll also learn simple ways to diagnose resets, spot attack patterns, and keep your connections healthy.
TL;DR: TCP resets are instant connection terminations that can indicate whether your network is healthy, misconfigured, or under attack.
-
A TCP reset (RST) instantly terminates a connection—sometimes intentionally (like rejecting traffic to a closed port), and sometimes due to timeouts, application crashes, or malicious interference.
-
Early resets usually point to closed ports or firewall rejections, while mid-session resets hint at app crashes, policy drops, or user cancellations.
-
Frequent or irregular RSTs can signal issues like bad routing, proxy interference, or deliberate tampering (RST floods or injection attacks).
-
Combine ACLs, rate limiting, conntrack, and app-level tuning to block fake resets and maintain stable, secure connections.
How TCP Connections Start and End
TCP is the foundation of reliable communication on the Internet. It makes sure data is delivered accurately and in order between two systems, such as a browser and a web server or an app and an API.
A TCP connection goes through a few main stages. It begins with a handshake, followed by data exchange, and ends with a connection termination. The connection can close cleanly, end suddenly, or simply stop responding.
How Connections Start
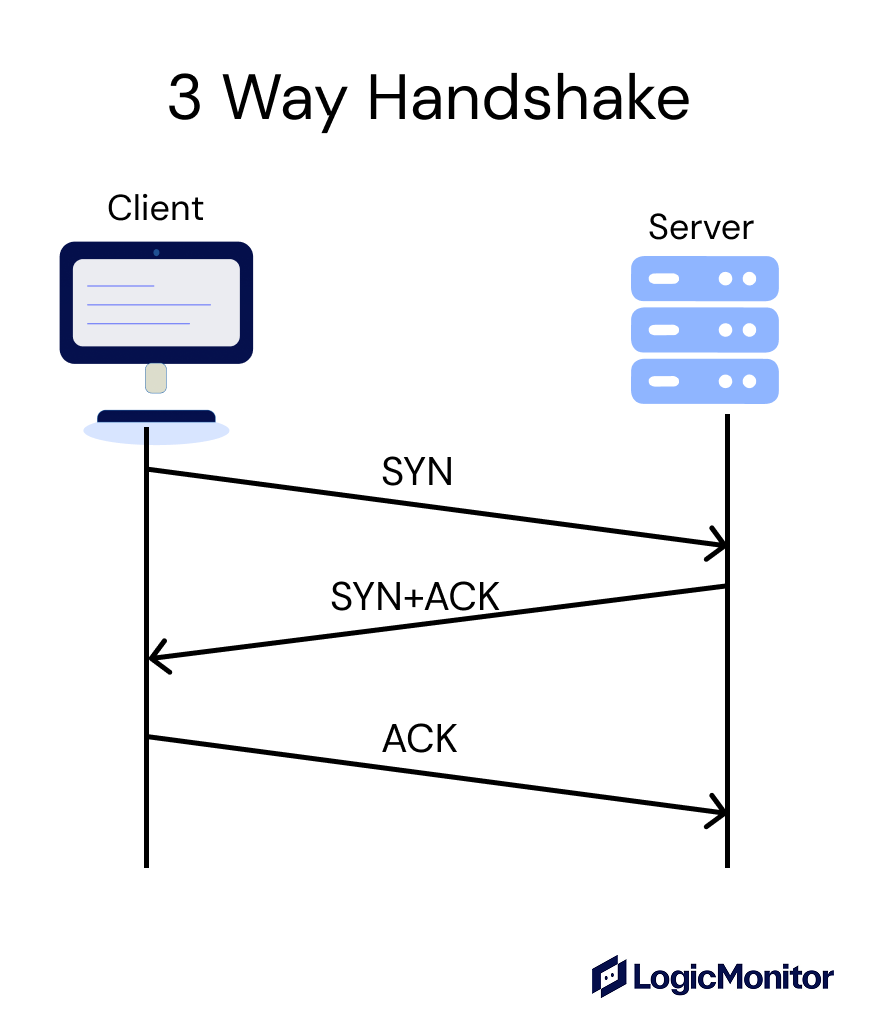
Before two devices can exchange data, they need to agree to communicate. This setup is called the three-way handshake, and it happens in three quick steps:
- SYN: SYN is used to initiate the connection and indicate the client’s initial sequence number.
- SYN-ACK: The server responds with a packet that has both the SYN and ACK flags set, acknowledging the client’s request and initiating its side of the connection.
- ACK: The client sends back an acknowledgment to complete the handshake.
After these steps, both sides are ready to transfer data.
How Connections End
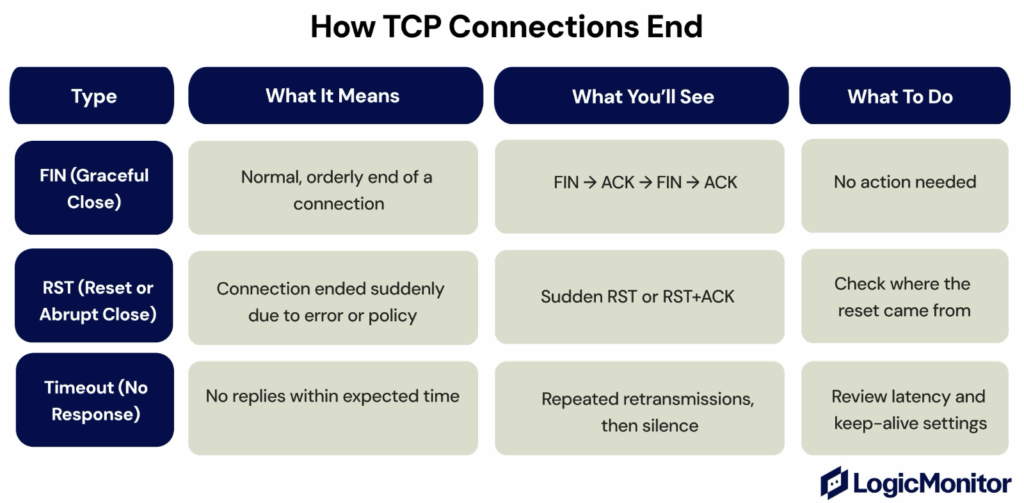
When a TCP connection finishes, it can close in three main ways:
- Graceful Close Happens (FIN): One side sends a TCP segment with the FIN flag to indicate it’s done sending data. The other side responds with an ACK, then sends its own FIN when ready. A final ACK completes the four-step process, so all data is acknowledged before the connection fully closes.
- Abrupt Close Happens (RST): An RST flag means the connection ended suddenly, often due to an error, crash, or blocked port. No pending data is sent; the session just stops.
- Timeout: A timeout occurs when one side stops responding. No close message is exchanged—the session expires after retries fail.
Understanding TCP RST in Detail
A TCP RST (Reset) is a control flag in the TCP header that tells two devices to close a TCP connection immediately.
It’s sent when one side receives unexpected traffic, for example, when a computer gets a message for a port that isn’t open, or when an app has already closed the connection.
When a TCP RST is sent, both sides stop sending data immediately. The connection ends without going through the standard TCP teardown (FIN/ACK).
When TCP RSTs are Normal
RST packets are often part of normal TCP behavior. In such cases, they help clean up unused or invalid connections.
Let’s look at some common examples:
- A client attempts to connect to a port that isn’t open, so the host responds with a TCP RST.
- The client application (e.g., browser) closes a browser tab before the page finishes loading.
- An application closes its socket or crashes while a connection is still open.
- Firewalls or proxies send RSTs to forcibly terminate sessions that are idle, unauthorized, or match a security policy.
These are all normal and help maintain healthy connections.
When TCP RSTs are Not Normal
Too many resets, or resets that appear at odd times, may mean there’s a problem.
Here are some common scenarios:
- Firewalls or security tools inject RSTs to block or drop connections.
- Misconfigured routing or NAT rules can cause unexpected RSTs if packets are received out of context or by the wrong endpoint.
- Attackers send fake RSTs to disrupt real connections..
- Apps or systems close connections incorrectly or too early.
Why You’re Seeing TCP Resets: Diagnose by Connection Stage
You can often tell why a TCP connection was reset by examining when it happened.
Each stage of a TCP session gives you clues about what caused the reset if it’s normal cleanup, a setup issue, or network interference.
Here are the main stages where resets happen and what they usually mean.
Post-SYN (During the Handshake)
A Post-SYN reset occurs during the TCP three-way handshake—after the client sends a SYN, but before the connection is fully established.
To understand what’s happening, look for:
- Signs like closed destination ports, scanning attempts, or firewall rejections
- A port that isn’t open
- Spoofed traffic that never completes the handshake
- The server or firewall sends an RST in response to unauthorized or unexpected connection attempts
To confirm the cause, check if the destination port is open and an application is actually listening. Review firewall or intrusion-detection logs for blocked SYN packets. If you notice many resets coming from random IPs, it’s likely a network scan rather than a real connection attempt.
In packet captures, a reset typically follows a SYN-ACK with no ACK from the client, often just a few milliseconds apart.
Post-ACK (Right After the Handshake)
A Post-ACK reset happens after the three-way handshake is complete, but before any application data is exchanged. This means something interrupted the connection right after setup, before communication really began.
This can likely be caused when:
- A middlebox (firewall, proxy, or filter) drops the session by policy
- An application or service aborts early, such as an SNI mismatch during TLS setup
- Carrier-level traffic shape or “zero-rating” behavior that interferes with the connection
To confirm the cause, check for policy or TLS errors in your server or proxy logs. You can also trace the path through middleboxes or CDNs that might be injecting resets.
When you review packet captures, the reset appears immediately after the ACK, with no data following. It often comes with a different TTL, which suggests middlebox interference.
Post-PSH (After the First Data Packet)
A Post-PSH reset happens after the connection is established and application-layer data (such as an HTTP request) has started flowing. For example, once the client sends its first HTTP request. This type of reset typically indicates that the session was disrupted during an active communication.
To understand what’s happening, look for:
- The client application (e.g., browser) aborting the connection such as when a user closes a tab or cancels the request mid-transfer
- An application crash or forced shutdown while the connection was still open
- A security system, such as a web application firewall (WAF) or intrusion prevention system (IPS), that injected a forged reset
To confirm the cause, review client actions (like user cancellations or timeouts) and server logs for app crashes or restarts. Check packet captures (pcap) to see if a middlebox or security system is injecting resets into the traffic flow.
In packet traces, the reset often follows a PSH/ACK and may appear with identical ACK numbers or sudden TTL changes, both signs of possible tampering.
Later (After Several Data Packets)
Resets that occur after a few data packets have been exchanged often indicate application-level issues or user-driven behavior.
To understand what’s happening, look for:
- Manual user actions, such as page reloads, canceling a request, or navigating away from a website
- Application timeouts, retries, or logic errors that prematurely close the session too early
- Network scanners or monitoring tools that initiate short-lived connections and quickly reset them
To confirm the cause, compare the timing between data bursts and resets, and check application logs for timeout or retry events. If you see repeated short sessions from the same IP, it could indicate automated scanning or monitoring activity.
In packet traces, resets usually appear after several data packets and may repeat in short bursts with consistent IP IDs or window sizes.
Troubleshooting Playbook: From Symptoms to Root Cause
When you start seeing a high number of TCP resets, the best next step is to capture them and interpret what’s really happening.
So let’s explore some simple ways to trace resets, understand what they mean, and identify where the problem starts.
Quick Packet Capture Filters
The fastest way to see what’s going on is to capture RST packets directly. You can use two primary tools to capture and analyze these resets
- With tcpdump
- With wireshark
Let’s see how to use both.
Using tcpdump
# Show all TCP resets
tcpdump -n -v 'tcp[tcpflags] & (tcp-rst) != 0'
# Capture only resets from clients
tcpdump -n -v 'tcp[tcpflags] & (tcp-rst) != 0 and src port < 1024'
# Capture resets to a specific port
tcpdump -n -v 'tcp[tcpflags] & (tcp-rst) != 0 and dst port 443'
# Capture resets on the loopback interface
tcpdump -i lo -n -v 'tcp[tcpflags] & (tcp-rst) != 0'
If you’re not seeing anything on your main interface, don’t forget to check the loopback interface (-i lo).
Many local services communicate internally, and that’s often where hidden resets appear.
Using Wireshark
In Wireshark, use the display filter:
tcp.flags.reset == 1To make patterns easier to spot, add the Delta time column (the time between packets). This helps you distinguish between fast resets (immediate aborts) and delayed ones (timeouts or user actions).
Interpret Common Messages
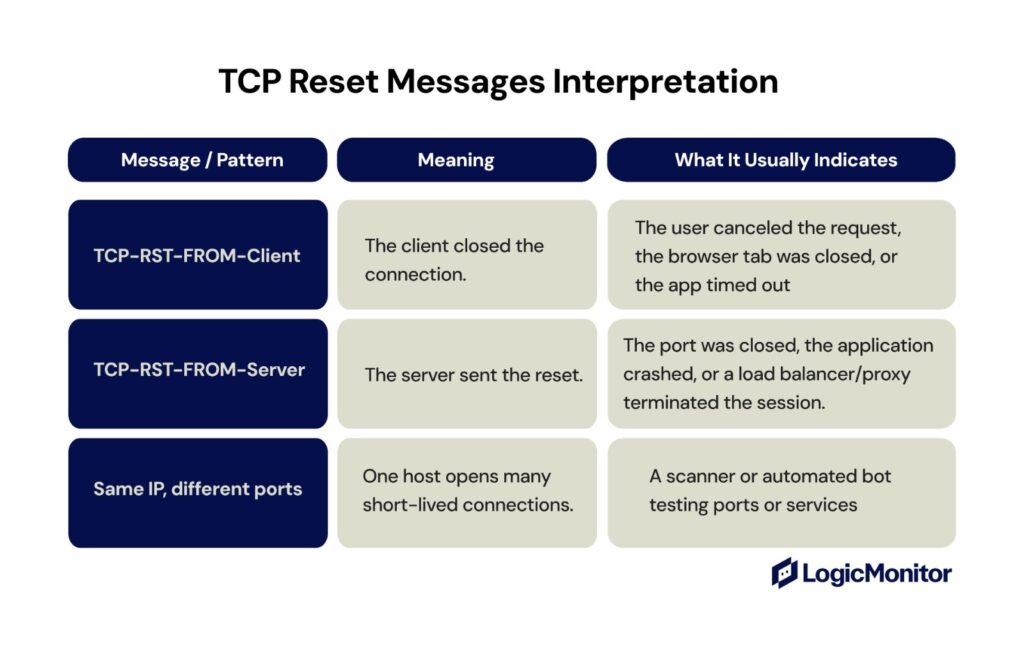
Once you have captured TCP RSTs, look at who sent the reset (client or server) and at what stage of the session it occurred. Some of the most common messages/patterns are:
- TCP-RST-FROM-Client
- TCP-RST-FROM-Server
- Same IP, different ports
Decision Tree
Here’s a simple way to interpret common TCP resets based on timing and behavior:
| Pattern | Likely Cause | Next Step |
|---|---|---|
| RST appears immediately after SYN-ACK | Middlebox policy, port block, firewall, proxy, server rejecting connection (e.g., by policy or misconfiguration), or misrouted backend | Check firewall rules, proxy behavior, or TLS SNI policies. |
| RST appears about 30 s after the request with no response | Idle timeout, client retry, or app-level inactivity disconnect | Verify client retry logic or server keep-alive settings. |
| Many Post-SYN resets from many IPs | Port scanners, internet-wide probes, or noisy botnets | Block or rate-limit at the edge. |
| RST appears right after the first PSH (data) | Client aborted the request or the app/server crashed | Check app logs and client session behavior. |
| RST appears later in the session | Flaky app logic or user reload | Review app retry handling or session timeouts. |
You can use this table as a quick checklist before deeper packet inspection.
Attacks and Tampering You Should Recognize
Sometimes, a TCP reset (RST) packet doesn’t come from a normal connection error—it comes from an attack or deliberate interference. Two common attack patterns are:
- RST floods
- RST injection
They look similar in packet captures, but the cause and response are entirely different.
RST Flood
An RST flood is a type of denial-of-service (DoS) attack where an attacker sends a high volume of fake TCP reset packets to a target.
The goal is to break active connections or overload the server by forcing it to process large volumes of invalid TCP resets.
These packets are often spoofed (the attacker fakes their source IP addresses), which makes it hard to filter them by origin.
What you’ll see in packet captures:
- Sudden spike in RST packets with no matching SYN/ACK history.
- Traffic targeting multiple destination ports or services within a short timeframe.
- Sequence and acknowledgment numbers don’t line up with real sessions.
Here’s how to respond:
- Rate-limit RST packets to slow down floods without blocking normal traffic.
- Use connection tracking (conntrack) so only valid, established sessions can send resets.
- Enable upstream DDoS mitigation (e.g., ISP-based or cloud scrubbing) to filter high-volume RST floods before they reach your infrastructure
Tip: Watch for false positives—some real apps, proxies, or load balancers also send quick RSTs when closing idle sessions.
RST Injection
An RST injection is different.
Instead of sending thousands of packets, a firewall or middlebox forges a single RST packet to interrupt a specific connection.
This technique is often used in network censorship (locking or restricting access to certain websites or online content) or traffic filtering, especially after detecting certain content.
These forged resets often happen right after a TLS ClientHello (the message a browser sends first to start a secure HTTPS connection), where the domain name (SNI) is visible. This timing makes it a reliable indicator of tampering.
What to look for:
- A forged RST or RST+ACK appears right after the first data packet (often a ClientHello).
- The TTL value of the RST differs from the normal packets in that flow (it didn’t come from the same device).
- ACK numbers may be identical across several RSTs—a clear automation pattern.
Here’s how to confirm it:
- Test the same connection through a VPN or another network. If the resets disappear, the interference is likely on the original path.
- Compare TTL (Time To Live) and IP ID values between normal packets and the reset packet.
To mitigate this, you can do the following:
- Use TLS 1.3 with Encrypted ClientHello (ECH) so domain names are hidden from intermediaries.
- Try encrypted DNS (DoH or DoT) and VPN tunnels to bypass local middleboxes.
- Use connection retries with randomized timing to evade pattern-based RST injection.
- Log and document consistent reset patterns (for example, the same TTL delta or ACK numbers) to prove interference.
Mitigation Matrix (What Works Where and Trade-Offs)
There’s no universal fix for TCP resets. Each control layer—from your host to your ISP—has different tools and trade-offs. So, let’s look at some common methods to overcome TCP RSTs.
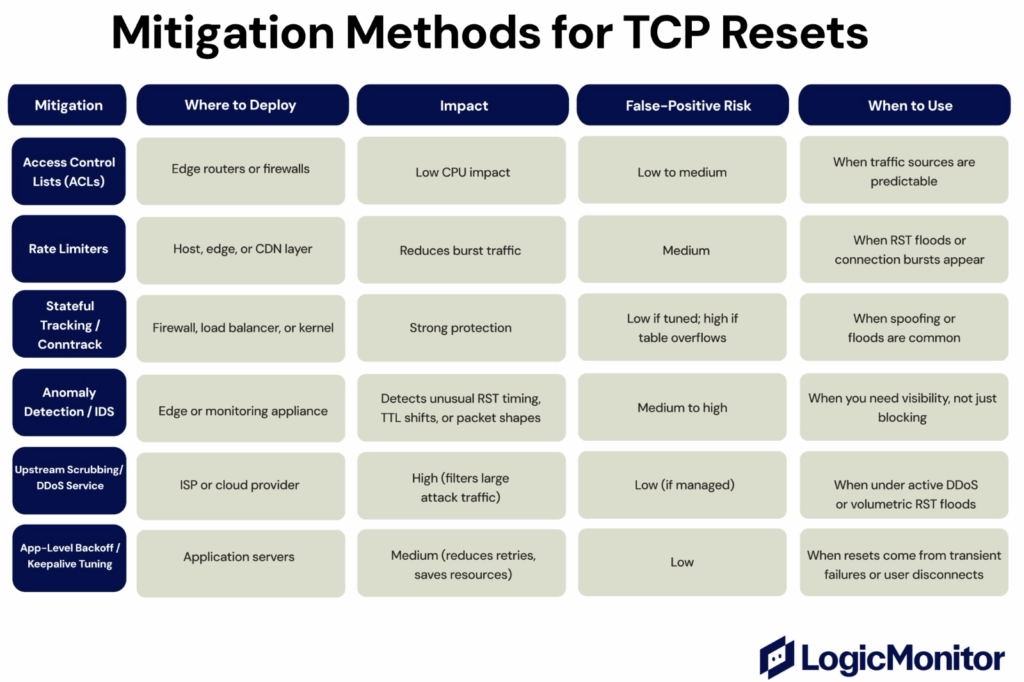
Access Control Lists (ACLs)
Access Control Lists (ACLs) are rule sets applied at routers or firewalls to permit or deny traffic based on IP addresses, ports, or protocol types. They work best at the network edge to block known bad traffic early.
You may use ACLs when you know your usual traffic patterns. For example, when your clients or servers come from fixed IP ranges.
Rate Limiters
Rate limiters control the volume of packets, connections, or sessions that are allowed in a short period of time. They prevent sudden traffic bursts or RST floods that could overwhelm servers.
However, if set too tightly, they might block normal spikes in traffic. So you should only use rate limiters when you see lots of resets or bursts of connections.
Stateful Tracking (Conntrack)
Stateful tracking, also called conntrack, keeps a record of all active TCP sessions. It checks whether each RST packet actually belongs to an existing connection.
This makes it very effective against forged or fake resets. The risk of mistakes is low if it’s tuned properly. However, under high connection volume, the tracking table can overflow, potentially causing dropped connections or degraded performance.
You may use conntrack when you face spoofing or flooding attacks.
Anomaly Detection or Intrusion Detection Systems (IDS)
Anomaly detection systems or IDS tools monitor network traffic for unusual behavior like strange RST timing, odd TTL values, or repeated ACK numbers.
They help you see when someone is tampering with connections, even if they don’t block the packets directly.
Here, the false-positive risk is medium to high, depending on how well the systems are trained. So you may use them when you want visibility and data for analysis, especially to prove tampering or censorship.
Upstream Scrubbing or DDoS Protection
Upstream scrubbing means sending your traffic through your ISP or a cloud provider that filters out bad packets before they reach you.
This is quite helpful when you’re under volumetric DDoS attacks or getting flooded with forged RSTs. So in such cases, you can use upstream scrubbing as an external defense layer.
App-Level Backoff and Keepalive Tuning
At the application layer, you can configure retry timers, backoff times, and keepalive settings to handle resets more smoothly. This won’t stop the resets, but it prevents your app from excessive reconnection attempts or wasting resources and reduces app-side load during transient failures.
Ultimately, it has a low risk of errors and helps apps stay stable when temporary network issues occur. So you can use it when resets are caused by short outages, user disconnects, or middlebox interference.
Automated Scanning Vs. Human Behavior
Not all TCP resets come from real users or broken apps. Many are caused by automated scanners that send test packets across the internet to check which systems or ports are open.
These test packets are called probes. They’re small connection attempts sent just to see if a device responds, not actually to exchange data.
How Scanners Behave
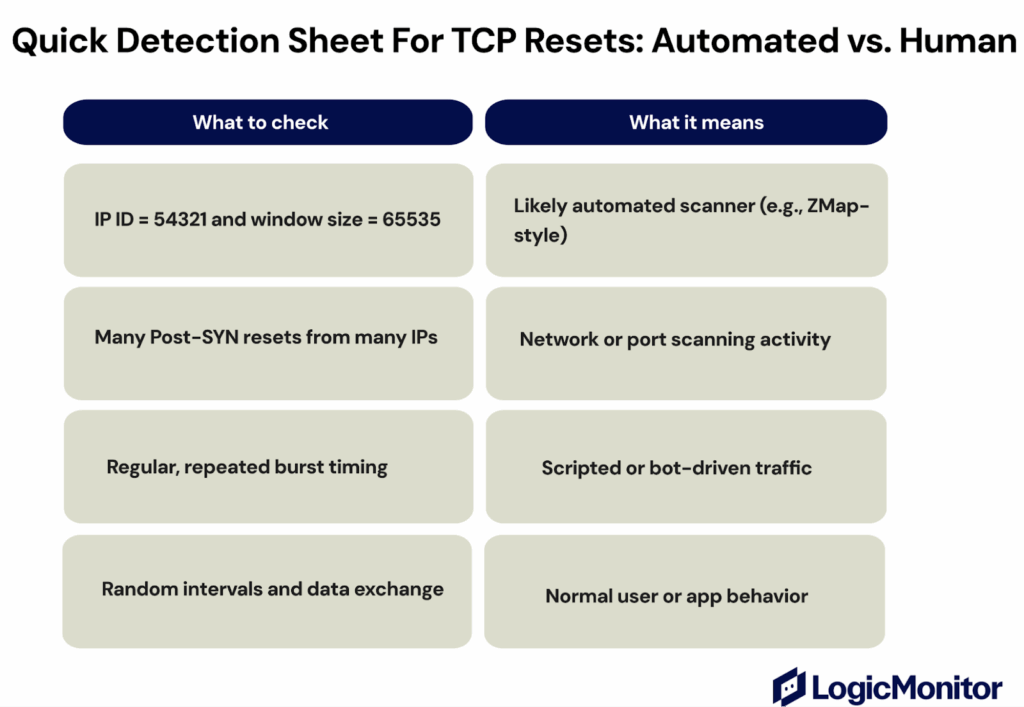
Automated scanners send thousands of these probes every second. Their traffic is fast, repetitive, and easy to spot once you know what to look for:
- The IP ID field is often fixed to a standard value such as 54321 (used by scanners like ZMap).
- The TCP window size is typically 65535.
- Most connections end right after the SYN stage; they never finish the handshake.
- Probes arrive in short bursts, hitting many different ports or servers quickly.
- The source port is often the same across many probes, instead of being randomized like in real client connections.
These consistent patterns make scanning traffic stand out from normal user activity.
How Human Traffic Looks Different
Connections from real users or apps behave in a more natural, varied way. They complete the handshake, exchange data, and usually close with a FIN or a single RST much later.
The timing and packet sizes vary, too, showing real user interaction rather than automated testing.
Monitor Your Network
TCP resets are part of normal internet traffic, but frequent or unexpected RSTs can tell you a lot about what’s happening in your network.
Some resets are harmless, like a user closing a page. Others may point to deeper problems, such as application crashes, network misrouting, broken connections, misconfigured apps, or even tampering and attacks.
The best way to understand them is to look closely. Capture a few resets with tools like tcpdump or Wireshark. Identify which side sent the RST, and observe the timing relative to connection setup and data exchange.
Over time, this becomes your baseline, a reference for spotting anything unusual.
By keeping an eye on resets and understanding their patterns, you’ll move from reacting to problems to predicting them. That’s how strong, reliable networks are built.
FAQs
How is TCP Different From UDP?
TCP establishes a connection and guarantees the ordered, reliable delivery of data between endpoints. UDP is connectionless and faster, but it does not guarantee that packets arrive or arrive in order.
Can Firewalls Cause TCP Resets?
Yes. Firewalls or intrusion prevention systems (IPS), or deep packet inspection (DPI) tools, can send RST packets to block connections that match unwanted patterns or violate security rules.
What is a Half-Open TCP Connection?
A TCP half-open connection occurs when one side considers the connection is still active, but the other side has either not completed the connection process or has already closed it.


