LogicMonitor can automatically track the important DataSources (Consul Agent, Consul Server, and Consul Cluster) of your Consul deployment to keep it running healthy. Learn more!
Companies around the world are going through digital transformation in some way or another. They are breaking monolithic applications into microservices for more natural development and deployment. HashiCorp Consul is one of the tools helping companies with this transformation. Consul helps with the shift of static infrastructure to dynamic infrastructure through service-based networking instead of host-based. With the added complexity of a company’s environment, it is increasingly important not just to monitor the underlying infrastructure of the servers, but also get crucial information about the Consul application.
LogicMonitor can automatically track the important DataSources (Consul Agent, Consul Server, and Consul Cluster) of your Consul deployment to keep it running healthy.
Monitoring Consul Agent
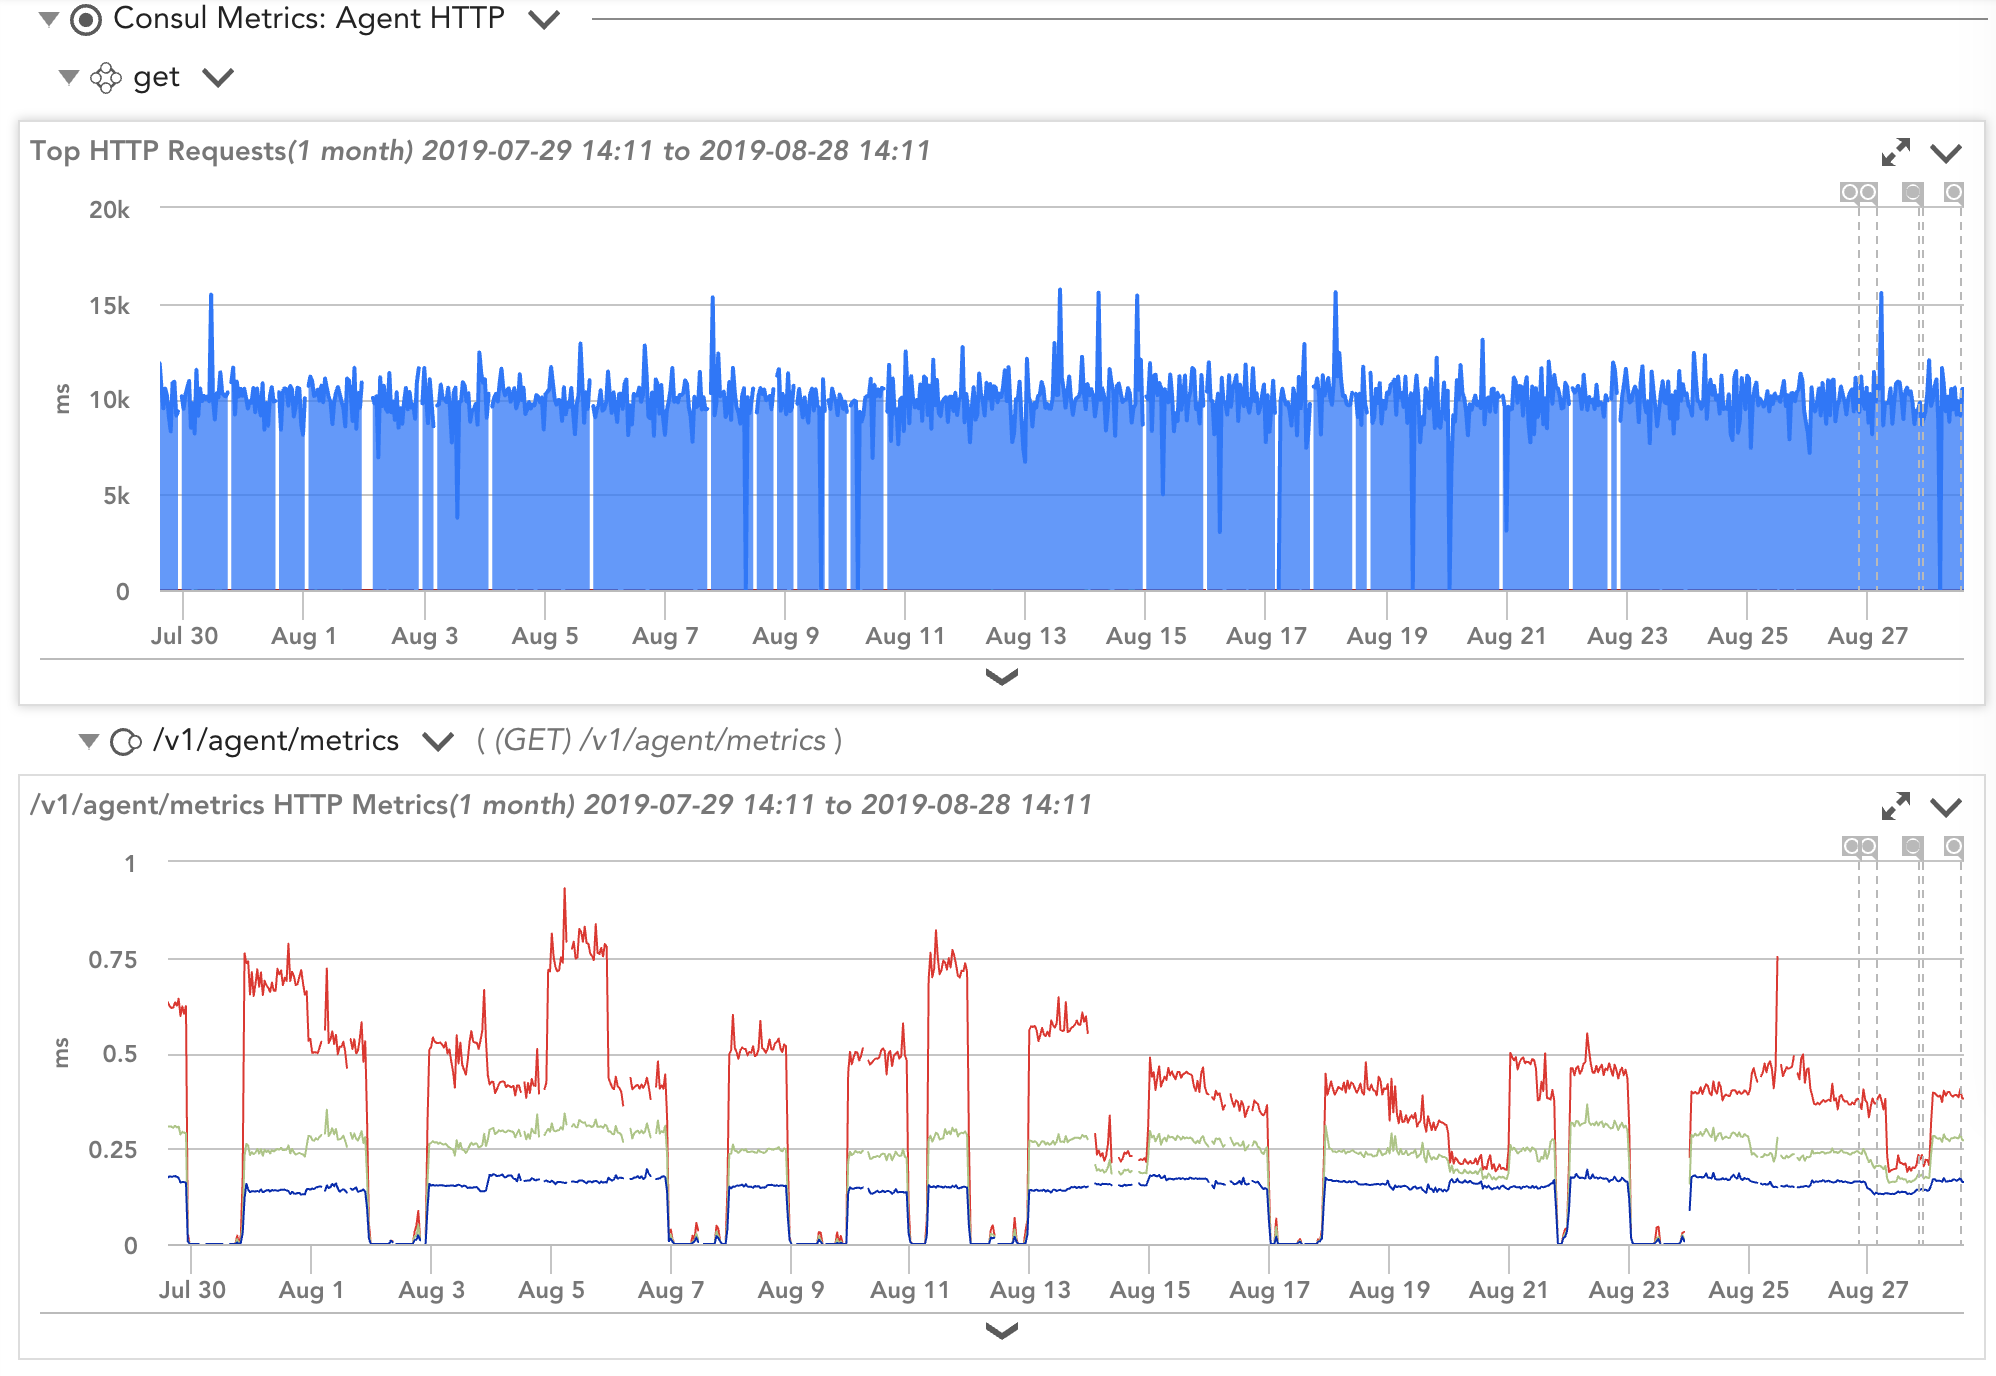
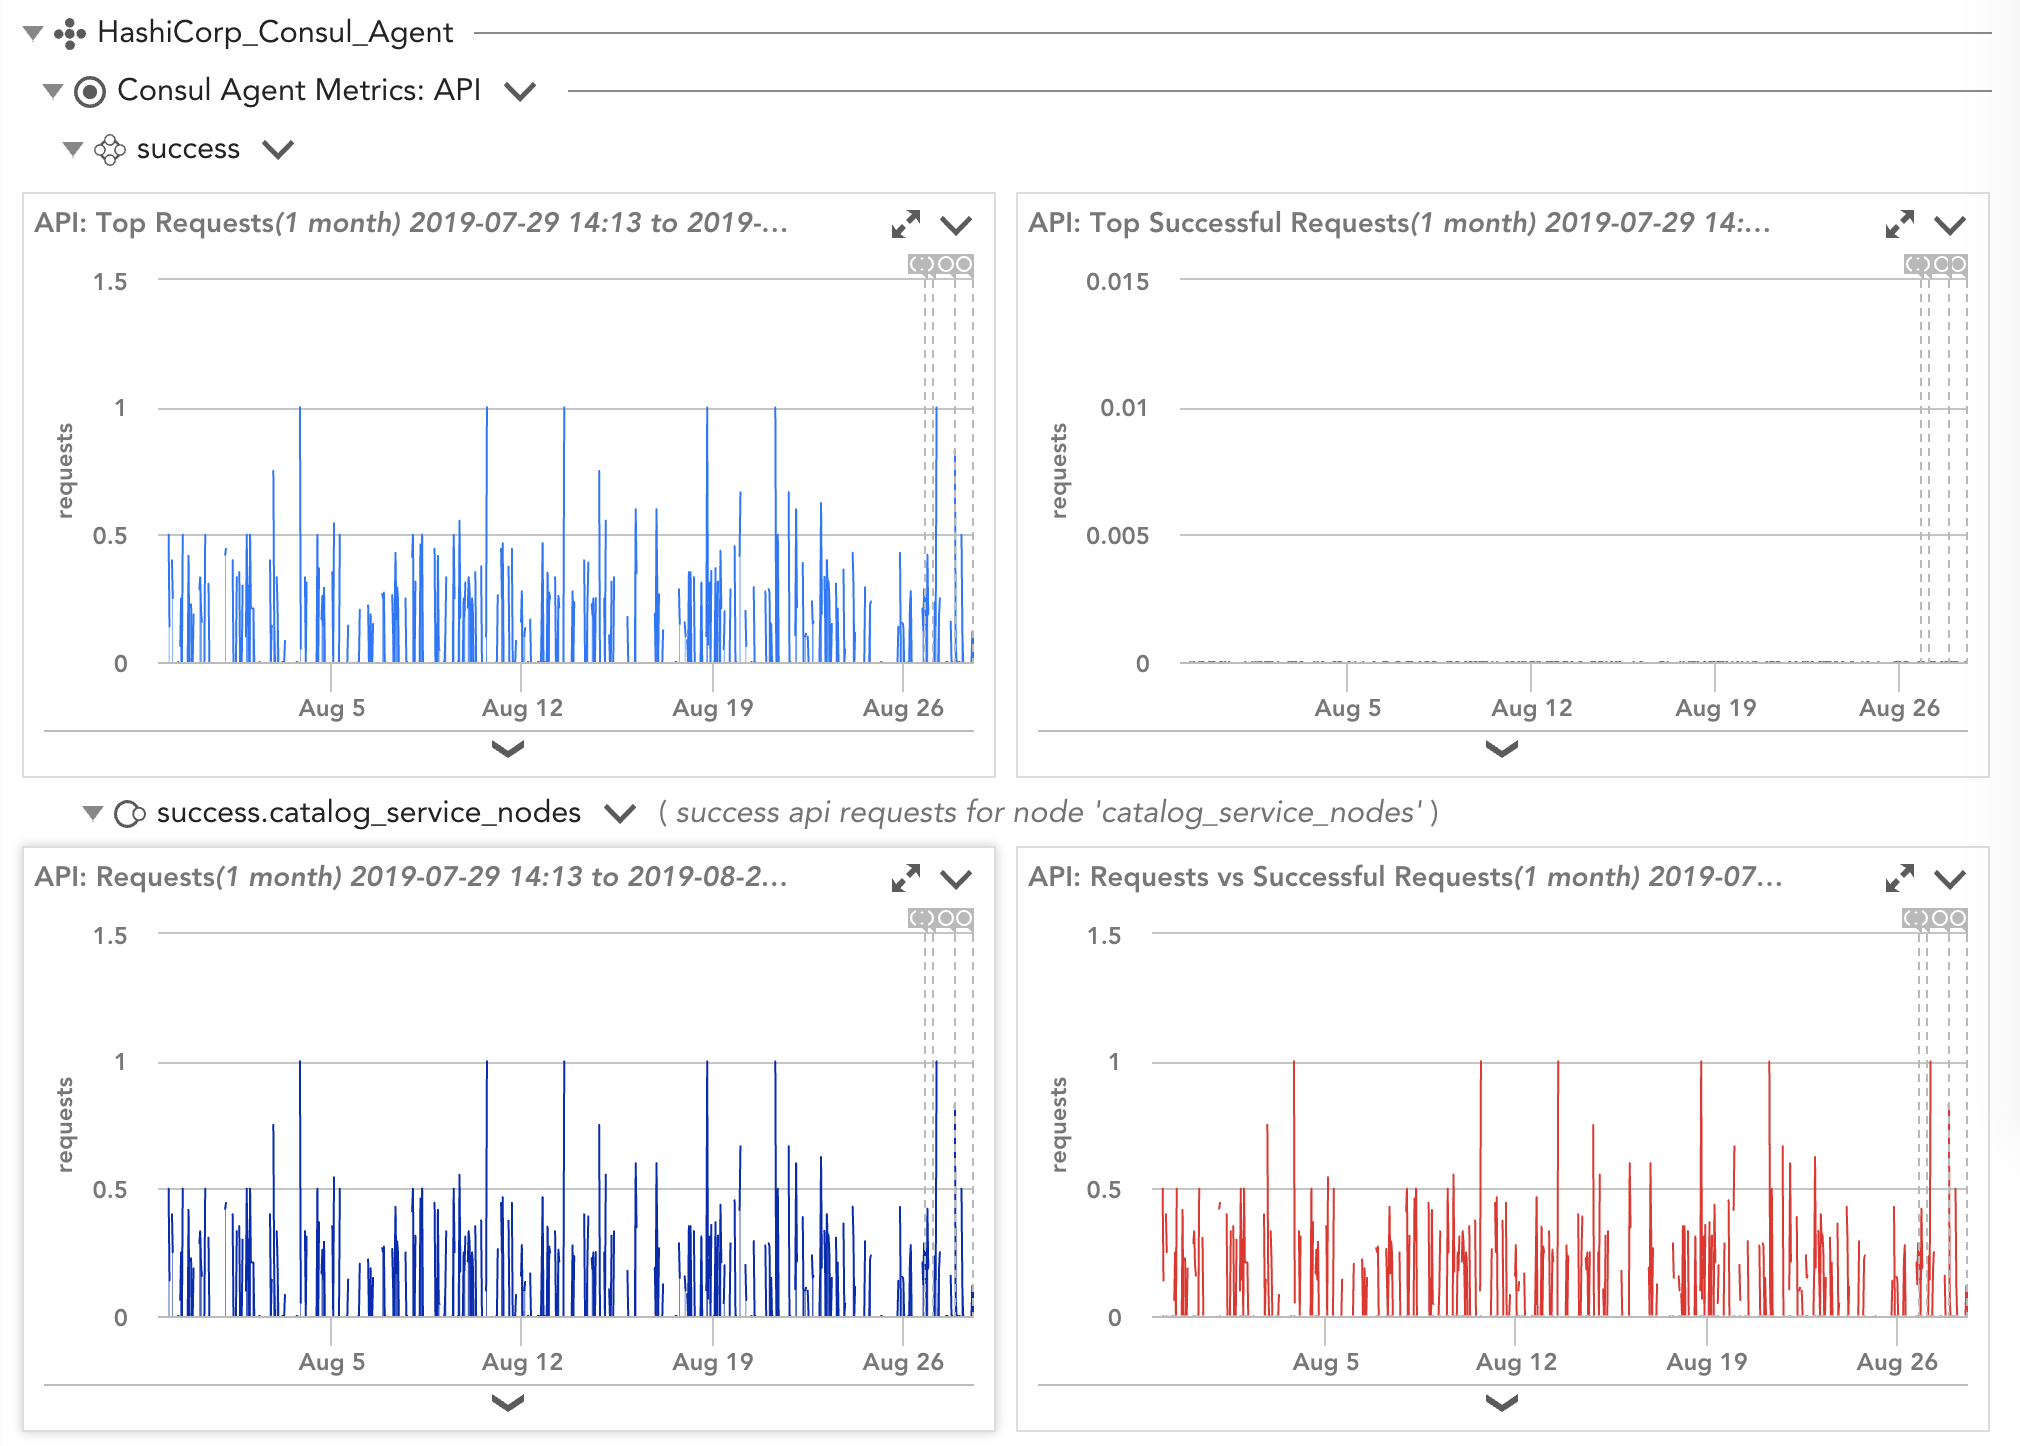
The Consul agent has two modes—client and server—and they run on every node of the Consul environment. The agents in client mode interface with the server nodes for the majority of their operations, thus making them lightweight. Several key metrics are beneficial to keep an eye on when monitoring the health of the agents:
Number of nodes
Register/Deregister requests
Number of services & services in a node
Number of datacenters
DNS queries
HTTP/RPC requests
If you notice that the nodes chart is flapping, this can be an indicator of overloaded agents, configuration errors, or network problems. By having these metrics handy and at a quick view over a set timeframe, you can identify whether or not the agents are behaving as expected or struggling to keep up with the demand.
View of Consul agent datasources collected via API and from the agent
What to Look for When Monitoring Consul Server
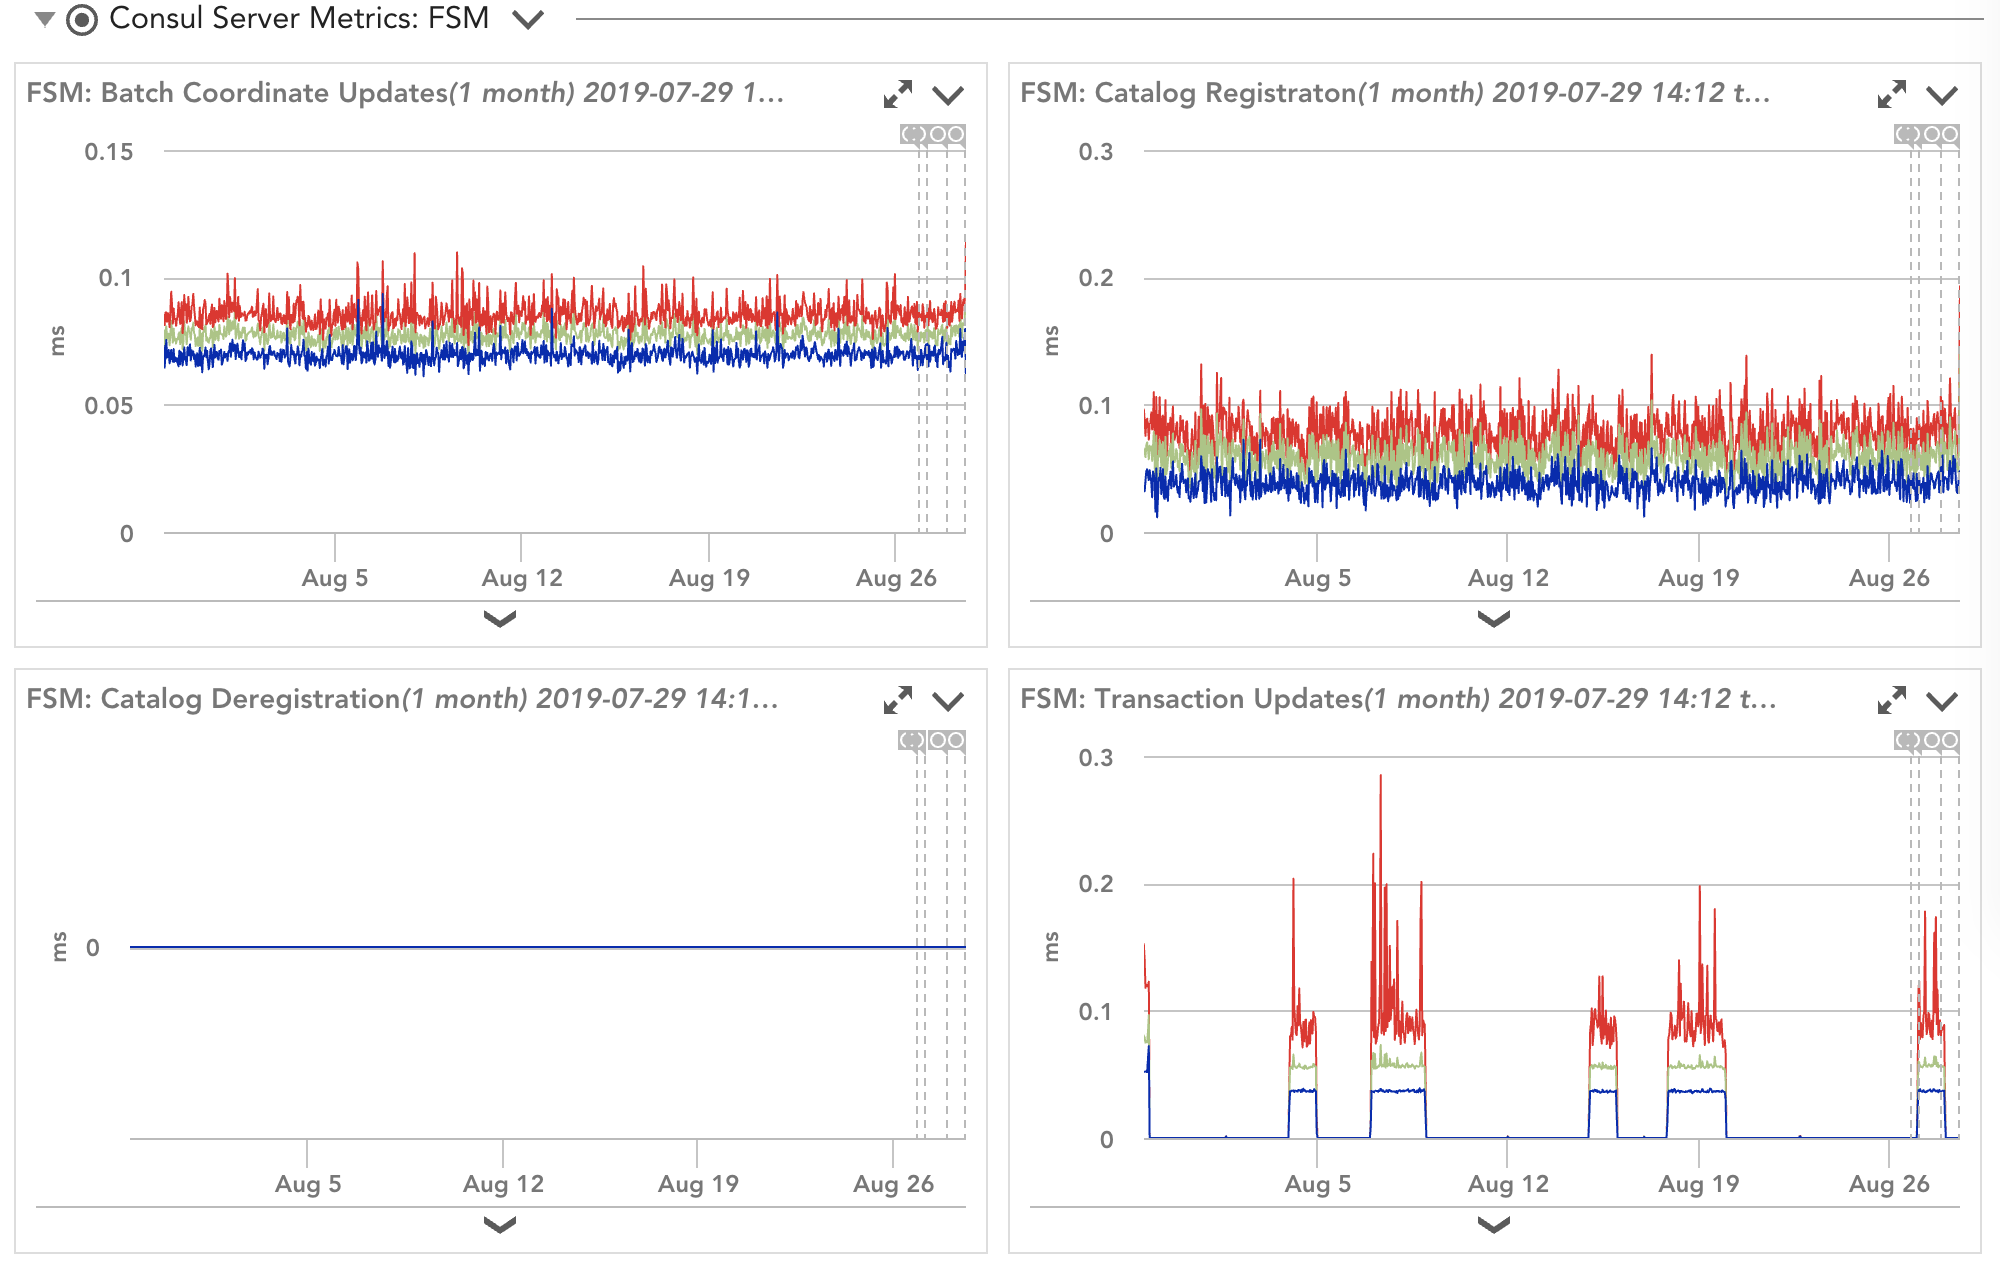
Server nodes are critical since they are the ones that process the operations of the Consul platform. When tracking the health of a server, more than likely, you want to look at the following data:
Register/Deregister latency
Key-Value update latency
Replication Latency
RPC requests/errors
Session update/renewal latency
Raft information
These metrics can help your team appropriately size your servers, and if you need to add another server to help with the demand. Troubleshooting becomes simpler since you will be able to pinpoint and focus on the Consul server that is struggling with these server-specific data points.
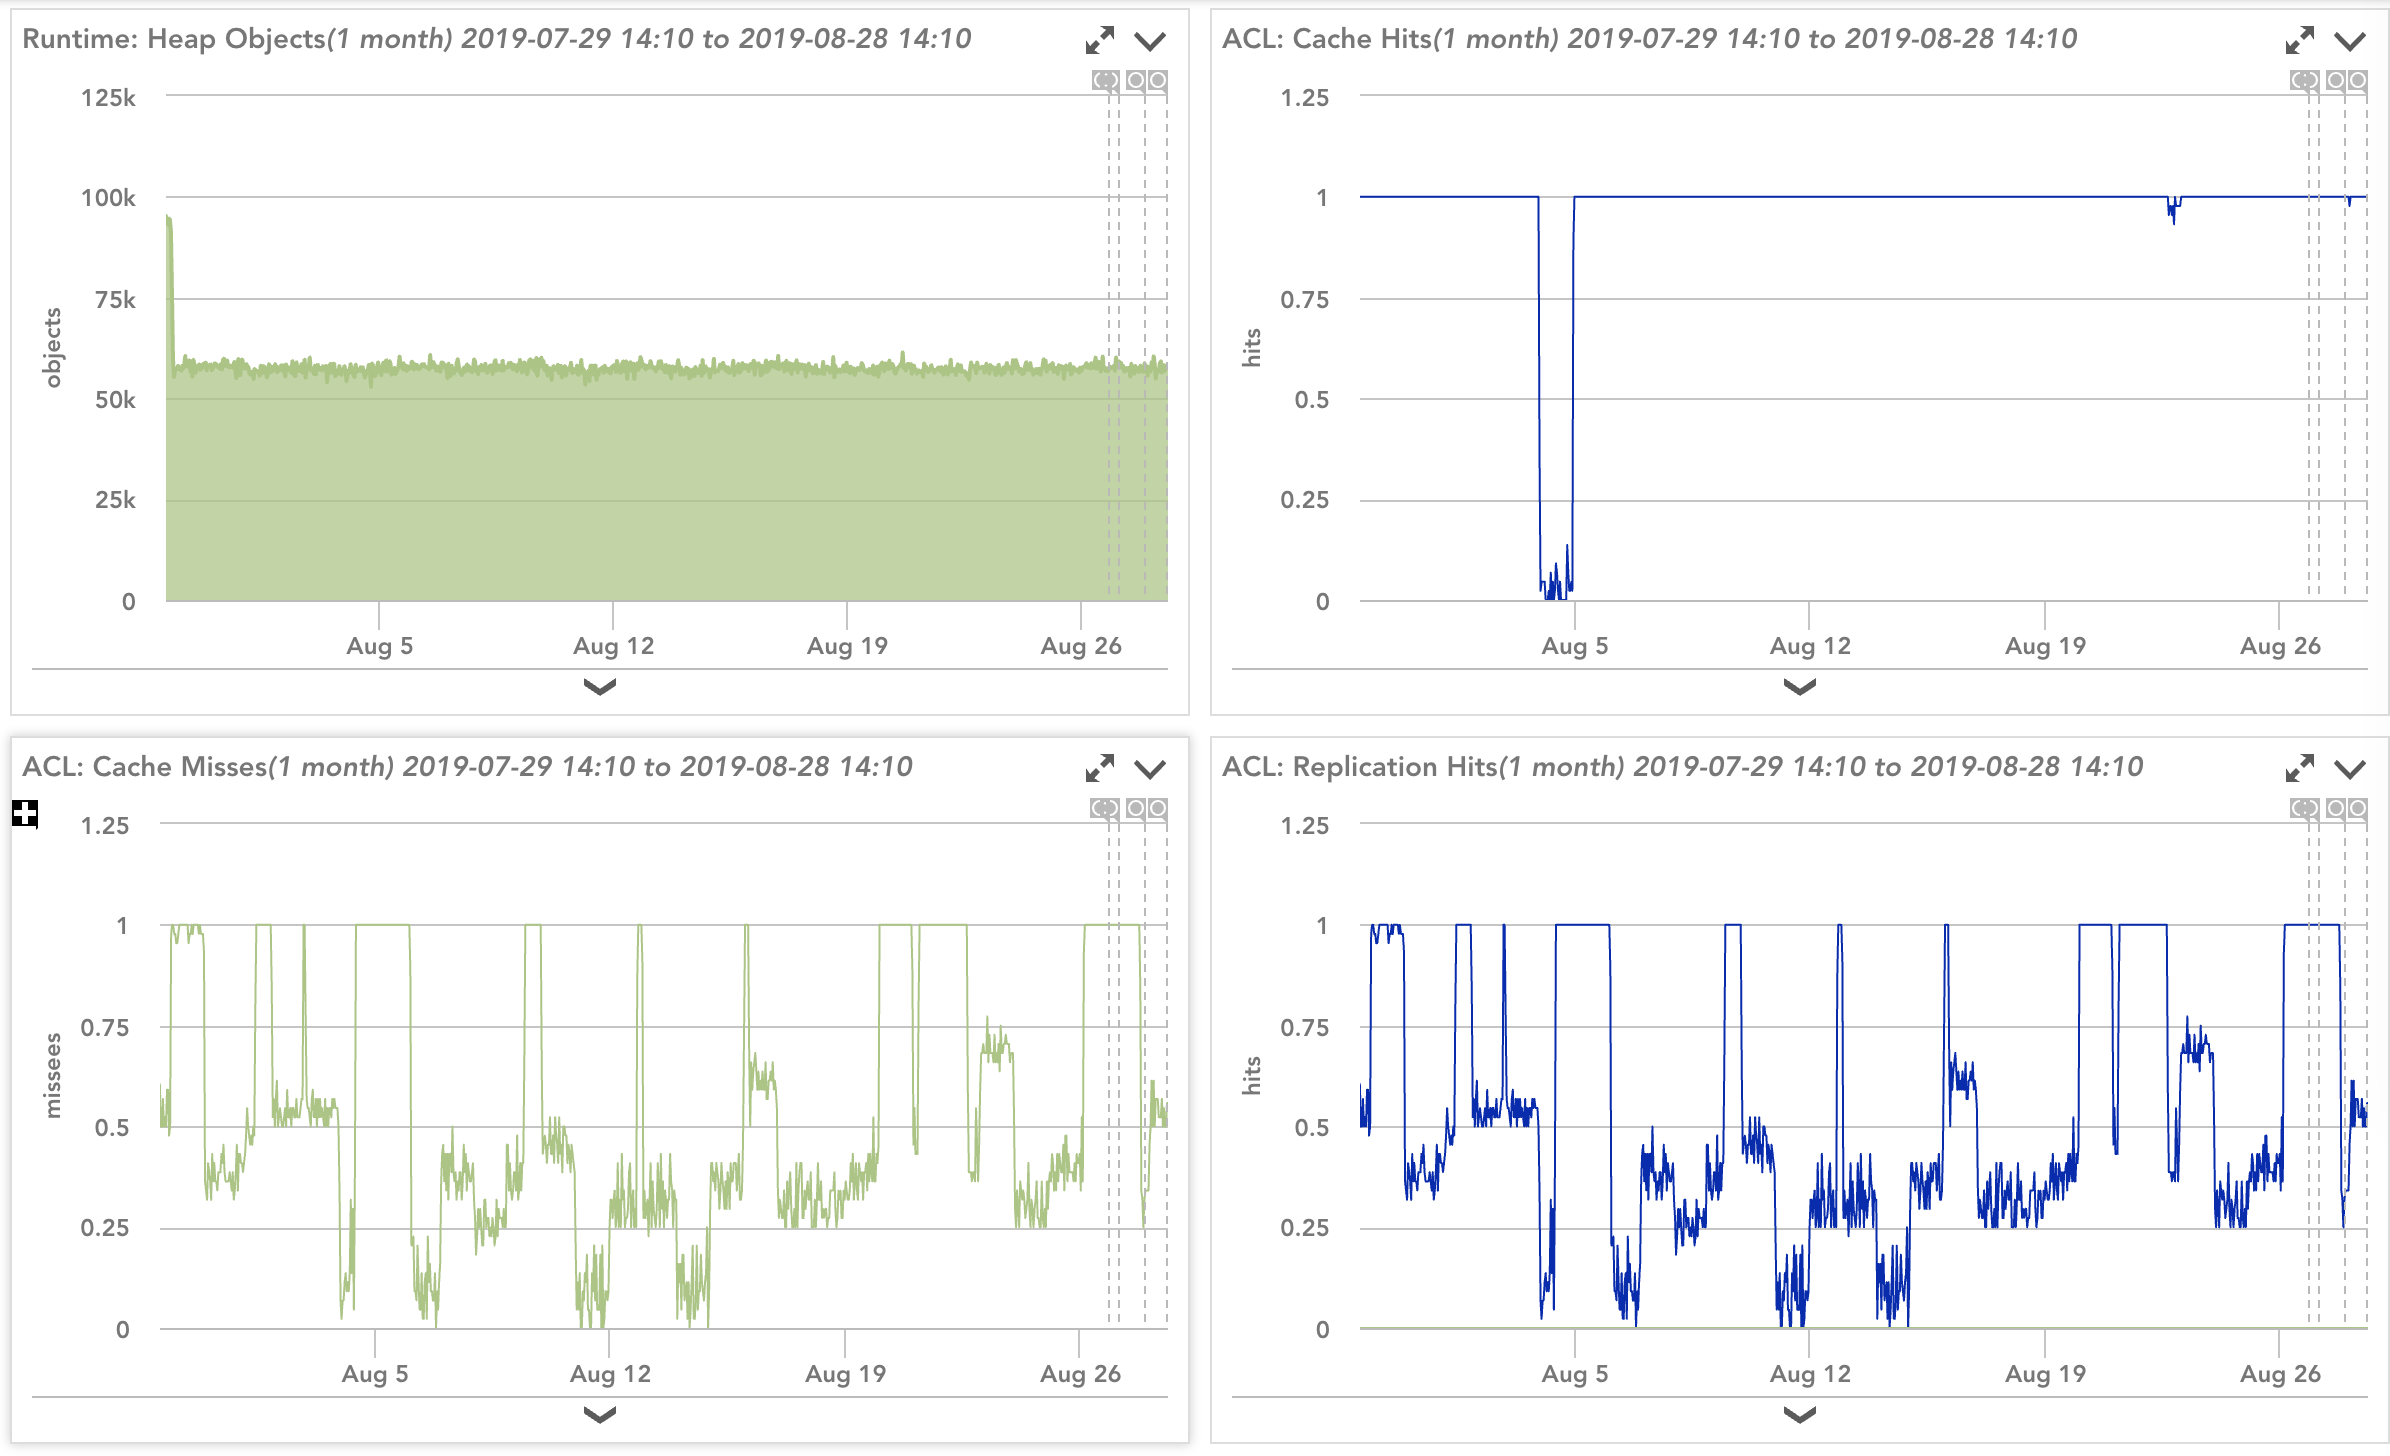
Display of Consul server metrics in LogicMonitor
Tracking Consul Clusters
Per HashiCorp documentation, it is highly advisable to have 3 or 5 servers in a cluster. A cluster allows redundancy and avoids data loss in case of a failure in one of the servers. With these many servers, you need to keep track of the leader and any leader changes that happen. If you start noticing a high number of leader changes, then this could be an indicator of network issues between the Consul Servers. As a bonus, if you have your network infrastructure added to LogicMonitor, you can see the dependency in the LogicMonitor topology view and drill down to the affect network component. At the cluster level, it is vital to keep track of the key-value store update time, transaction operation time, and the number of raft transactions. These values can help you understand the current state of the cluster, and you can be alerted if any of these metrics get pass a desired threshold. LogicMonitor also consumes the autopilot data, which indicates the overall health of the server cluster, if the value goes to zero, then LogicMonitor can send an alert.
These are some examples of how LogicMonitor can provide insights into your HashiCorp Consul environment. There are plenty of more use cases and data points that are collected. If you are attending HashiConf this year, make sure to visit our booth and we will be happy to answer any questions. Not attending? Don’t worry, request a free trial or visit our blog for more information that can be helpful as you manage your HashiCorp Suite.
Disclaimer: The views expressed on this blog are those of the author and do not necessarily reflect the views of LogicMonitor or its affiliates.